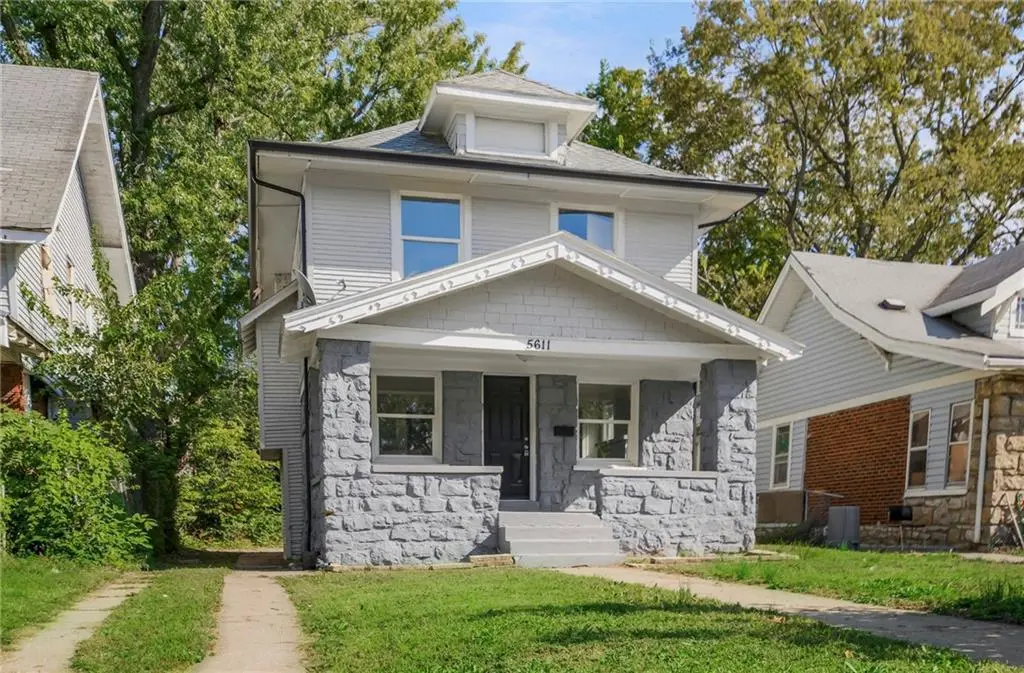
5611 Highland Ave · Kansas City, MO
Flood risk 1/10 · Minimal
- FEMA flood zone
- X (unshaded)
- Chance of flooding over 30 yrs
- 0.0%
- Est. flood insurance / yr
- $473 – $860
Fire risk 1/10 · Minimal
- Est. fire insurance / yr
- $1,054 – $1,958
Heat risk 4/10 · Minor
- Hot days now (above 106°F)
- 7 days/yr
- Hot days in 30 yrs
- 17 days/yr
Wind risk 2/10 · Minimal
- Chance of severe wind over 30 yrs
- —
Air-quality risk 3/10 · Minor
- Unhealthy air days now
- 2 days/yr
- Unhealthy air days in 30 yrs
- 4 days/yr
Risk factors via First Street. Map © Google.
Why this score? — see what drove the D grade
The composite is a weighted blend of 9 inputs, each scored 0–100. Each bar is that input's sub-score; the figure is the points it added to the 100-point composite (weight × sub-score).
- Cash flow +13.9/30.0
- ARV discount +11.3/15.0
- DSCR +4.2/10.0
- Livability +3.9/5.0
- Rent growth +3.5/5.0
- 1% rule +2.7/10.0
- Condition / age +2.5/5.0
- Schools +1.5/10.0
- Appreciation +0.0/10.0
$189,900
🖨 Deal sheet (PDF) 📄 Offer letter ✓ Due diligence
Listing remarks MLS
Bank Owned Property Sold in As-Is Condition. No warranties, disclosures provided by Seller. Proof of funds/ Pre-Approval MUST accompany all offers. Seller hours M-F, 9-5. Response times from Seller varies. Please ask your Buyers to be patient. Addendums apply, BUT not necessary to submit an offer.
Key facts
- 4,809 sq ft lot
- Built 2934
- Listed 34 days
Property features AI
Finance
- Other: Property age approximately 76–100 years; Above-grade finished area reported; additional finished space below grade; Inside city limits
- HOA & community: No association fees
Exterior
- Parking: Off-street parking
- Utilities: City/public water (verify); Public sewer; Cable, fiber, and high-speed internet available
- Home design: Single-family residence; Residential property; Two stories; Entry level: Main; Built with frame construction; Composition roof
- Construction: Frame construction; Composition roof; Below-grade finished area present
- Exterior features: Front porch; Metal fencing; City lot within city limits; Level lot; Paved road with public maintenance
Interior
- Kitchen: Main-level kitchen
- Bedrooms: Three bedrooms (all on the second level)
- Bathrooms: One full bathroom
- Heating & cooling: Natural gas heating; Has cooling
- Interior features: Living/dining combo; Unfinished basement; One fireplace in the family room; Two-story floor plan
- Laundry & utility: Laundry located in the basement
Neighborhood map
What this means for you Summary
Snapshot
- This is a 3-bed/1.0-bath single-family listed at $190k.
Deal economics
- At list price, monthly cash flow is $21 ($247/yr) — positive.
- The deal already cash-flows at list — no discount required.
- To meet the 1% rule (rent ≥ 1% of price), the offer needs to be $147k (22.8% below list).
- Recommended offer: $147k (22.8% below list) — sets the bar for 1% rule.
- Cap rate 6.4% vs local median 3.9% in Kansas City — top-decile yield for the area; either an underpriced asset or a hidden risk that comps aren't pricing in. Stress-test before assuming the spread holds.
Location & tenants
- Location reads 78/100 on livability (#28 in MO, #2,671 nationally) — a middle-class / working-renter tenant base. Strengths: amenities A+, commute A+, cost of living A+; Watch: crime F.
- Kansas City 33 (urban): math 12% / reading 24% proficiency, ranked #308 of 324 in MO (top 95%) — low school quality limits family demand, transient renter base, plan for 1-2y turnover; 75% free/reduced lunch — lower-income household profile, screen leases tightly.
- Zoned schools: Ac Prep Elementary (math 12% / reading 27%, grade F, #941 of 1,115 statewide, top 86%, 341 students, 99% FRL); Central Middle School (math 0% / reading 9%, grade F, #388 of 391 statewide, top 99%, 428 students, 99% FRL); Southeast High School (math 2% / reading 12%, grade F, #512 of 521 statewide, top 99%, 487 students, 99% FRL) — zoned schools average 99% FRL vs 75% district-wide (24 pts higher); higher-poverty schools than district average — tighter screening recommended.
- Market conditions: Rents rising (+4.0%/yr); tight market (median 1 DOM); 126 active listings in the ZIP; 40 comparable units currently listed for rent nearby; rentals at typical pace (median 22d on market — plan ~3-4 weeks tenant-placement turnaround); 4,002 units permitted in Jackson County in 2024 (2,271 in 5+ unit buildings).
Forward outlook
- Local home prices are declining (-3.0%/yr); year-one equity from $1k of loan paydown is wiped out by about $6k of value loss. Plan a longer hold.
- Jackson County population projected at +4% by 2050 — modest demand growth; plan on rents tracking national, not racing it.
Negotiation context
- It's been on market 34 days — a 3% lower offer ($184k) is reasonable based on typical stale-listing flexibility.
- 3 sale attempts since 17y ago with the ask held roughly flat each time — persistent listings suggest the price (not the market) is what's stuck; bring a comps-based counter.
Questions for the listing agent
- It's been on market 34 days. Have you received any prior offers? Is the seller open to a 23% concession, seller financing, or rate buy-down credit?
- Is there a deadline driving the sale (1031 exchange, divorce, estate, relocation)? That informs how much negotiation room exists.
- Crime grade is F in this area — have there been break-ins, vandalism, or insurance claims at this property in the last 3 years? What carrier currently insures it and at what premium?
- The area grade is low — what's the realistic commute time and amenity access for the typical tenant pool here? Any planned neighborhood developments (good or bad) we should know about?
- What's the average days-on-market for RENTAL listings here right now (not sales)? A rising rental-DOM trend means longer vacancies and softer asking-rent achievability than the comps imply.
- What's the recent tenant-quality profile in this submarket — average credit score on applications, eviction rate, late-payment / NSF rate, and stable-employment percentage? A property-management company in the area should have these aggregated.
- How much new for-sale + rental construction is in the pipeline within 1–3 miles? Heavy new supply typically softens prices + rents 12–24 months out; constrained supply supports both.
Investment metrics
- 1% rule
- 0.77% ✗
- Cap rate
- 6.42%
- Cash-on-cash
- 0.47%
- DSCR
- 1.02
- GRM
- 10.8
CMA / ARV
- ARV (median comp)
- $207,655
- List price
- $189,900
- Delta
- 5.46%
- Verdict
- FAIR
- Comps
- 20 within 1.0 mi
Show comp detail 12 sales within ~0.75 mi
| Address | Dist | Beds/Ba | Sqft | Sold | Price | $/sf | Match |
|---|---|---|---|---|---|---|---|
| 5629 Highland Ave | 0.05mi | 3/1.5 | 1,412 (+1%) | 3mo | $199,900 | $142 | 92 |
| 5700 Woodland Ave | 0.11mi | 3/2.0 | 1,440 (+3%) | 2mo | $204,000 | $142 | 84 |
| 5630 Woodland Ave | 0.05mi | 3/2.0 | 1,500 (+7%) | 1mo | $250,000 | $167 | 81 |
| 5806 Highland Ave | 0.24mi | 3/1.0 | 1,328 (-5%) | 4mo | $179,000 | $135 | 77 |
| 5836 Michigan Ave | 0.33mi | 3/1.5 | 1,440 (+3%) | 1mo | $200,000 | $139 | 77 |
| 5433 Tracy Ave | 0.37mi | 3/2.0 | 1,415 (+1%) | 4mo | $325,000 | $230 | 73 |
| 5341 Wayne Ave | 0.32mi | 3/1.5 | 1,496 (+7%) | 2mo | $250,000 | $167 | 70 |
| 5341 Wayne Ave | 0.31mi | 3/1.5 | 1,498 (+7%) | 2mo | $150,000 | $100 | 70 |
| 1820 E 55th St | 0.20mi | 4/2.0 (+1) | 1,294 (-7%) | 4mo | $225,000 | $174 | 66 |
| 1116 E 58th St | 0.45mi | 3/1.5 | 1,314 (-6%) | 3mo | $289,000 | $220 | 64 |
| 6112 Tracy Ave | 0.70mi | 3/2.0 | 1,405 (+1%) | 1mo | $219,500 | $156 | 62 |
| 5712 Harrison St | 0.55mi | 3/2.5 | 1,454 (+4%) | 1mo | $430,000 | $296 | 60 |
Match score weights: distance 35% · size 25% · config 20% · recency 20%. Top-matched comps best support the ARV.
Projected returns pro-forma
-3.0% appreciation · 3.95% rent growth · sell at horizon
- IRR
- -14.7%
- Equity multiple
- 0.47×
- Total profit
- $-28,129
- Equity at exit
- $28,315
- IRR
- -4.8%
- Equity multiple
- 0.68×
- Total profit
- $-17,228
- Equity at exit
- $16,419
Cash invested: $53,172 (down + closing). Projections, not guarantees.
Landlord ↔ Tenant lean methodology
- Overall (STATE)
- 81 Strongly Landlord-Friendly
- State Missouri
- 81 Strongly Landlord-Friendly · R+10
- County
- — inherits STATE
- City
- — inherits STATE
ZIP-level market 64110
- Rents YoY
- 4.0%
- Median DOM (109 sales)
- 1 d
- Active inventory
- 126
- Price-to-rent
- 10.8×
Monthly cashflow live
- Estimated rent
- $1,467 high interval (Pro) →
- Mortgage (P&I)
- −$996
- Tax from tax record
- −$63 /mo · $759/yr
- Insurance
- −$79
- HOA
- −$0
- Vacancy / Maint / Mgmt
- −$308
- Net cashflow
- $21
Break-even live
Sensitivity live
| Price | -10% $128 | -5% $74 | +0% $21 | +5% $-33 | +10% $-87 |
|---|---|---|---|---|---|
| Rent | -10% $-95 | -5% $-37 | +0% $21 | +5% $79 | +10% $136 |
| Rate | -1.0pp $116 | -0.5pp $69 | base $21 | +0.5pp $-29 | +1.0pp $-79 |
UW: 25.0% down · 7.5% · 30yr · 1.5% tax · 5.0% vac · 8.0% maint · 8.0% mgmt
Financing live
Cash to close
- Down payment
- $47,475
- Closing costs
- $5,697
- Reserves months
- —
- Total cash needed
- —
Loan-product check · same deal, 3 products live
Conventional
25% down · 7.5% · 30yr
- Down + closing
- —
- Monthly P&I
- —
- Monthly cashflow
- —
- DSCR
- —
- Eligible?
- —
Personal DTI + credit; lowest rate.
DSCR
20% down · 8.5% · 30yr
- Down + closing
- —
- Monthly P&I
- —
- Monthly cashflow
- —
- DSCR
- —
- Eligible?
- —
No personal income docs; deal must DSCR.
Hard money
10% down · 12.0% · 12mo
- Down + closing
- —
- Monthly P&I
- —
- Monthly cashflow
- —
- DSCR
- —
- Eligible?
- —
Short-term bridge; refi at stabilization.
Rent comps 40 comps
| Address | Beds | Baths | Sqft | Rent | $/sqft | DOM | Units | Dist |
|---|---|---|---|---|---|---|---|---|
| 5524 Woodland Ave Kansas City, MO | 3.0 | 1.0 | 1243 | $1,095 | $0.88 | 25d | 1 | 0.05mi |
| 5531 Euclid Ave Kansas City, MO | 3.0 | 1.0 | 1135 | $1,300 | $1.15 | 45d | 1 | 0.17mi |
| 5430 Michigan Ave Kansas City, MO | 2.0 | 1.0 | 1250 | $1,495 | $1.20 | 45d | 1 | 0.19mi |
| 5430 Michigan Ave Kansas City, MO | 3.0 | 1.0 | 1710 | $1,100 | $0.64 | 21d | 1 | 0.19mi |
| 5708 Euclid Ave Kansas City, MO | 4.0 | 2.0 | 1350 | $1,600 | $1.19 | 18d | 1 | 0.20mi |
| 5410 Euclid Ave Kansas City, MO | 3.0 | 2.0 | 1119 | $1,395 | $1.25 | 45d | 1 | 0.26mi |
| 5332 Highland Ave Kansas City, MO | 3.0 | 1.0 | 1022 | $1,350 | $1.32 | 9d | 1 | 0.30mi |
| 2100 E 58th St Kansas City, MO | 2.0 | 1.0 | 1030 | $1,500 | $1.46 | 45d | 1 | 0.32mi |
| 5414 Brooklyn Ave Kansas City, MO | 3.0 | 1.5 | 1856 | $1,650 | $0.89 | 18d | 1 | 0.34mi |
| 5411 Tracy Ave Kansas City, MO | 2.0 | 1.0 | 1600 | $1,545 | $0.97 | 19d | 1 | 0.41mi |
| 5241 Brookwood Ave Kansas City, MO | 3.0 | 2.0 | 1431 | $1,550 | $1.08 | 45d | 1 | 0.42mi |
| 5618 Forest Ave Kansas City, MO | 3.0 | 1.0 | 1198 | $1,275 | $1.06 | 18d | 1 | 0.43mi |
| 5801 Wabash Ave Kansas City, MO | 3.0 | 1.0 | 1200 | $1,200 | $1.00 | 45d | 1 | 0.54mi |
| 5824 Wabash Ave Kansas City, MO | 3.0 | 1.0 | 1276 | $1,050 | $0.82 | 45d | 1 | 0.55mi |
| 5411 Harrison St Unit 1F Kansas City, MO | 2.0 | 1.0 | 900 | $1,199 | $1.33 | 25d | 1 | 0.57mi |
| 5409 Harrison St Unit 5411 Kansas City, MO | 2.0 | 1.0 | 900 | $1,199 | $1.33 | 25d | 1 | 0.57mi |
| 5407 Harrison St Unit 1F Kansas City, MO | 2.0 | 1.0 | 1025 | $1,195 | $1.17 | 45d | 1 | 0.58mi |
| 5446 Harrison St Unit 2F Kansas City, MO | 2.0 | 1.0 | 960 | $1,099 | $1.14 | 16d | 1 | 0.58mi |
| 5405 Harrison St Unit 2F Kansas City, MO | 2.0 | 1.0 | 1025 | $1,295 | $1.26 | 18d | 1 | 0.58mi |
| 5405 Harrison St Unit 2F Kansas City, MO | 2.0 | 1.0 | 1025 | $1,295 | $1.26 | 21d | 1 | 0.58mi |
| 5405 Harrison St Kansas City, MO | 2.0 | 1.0 | 1025 | $1,295 | $1.26 | 18d | 1 | 0.58mi |
| 5436 Harrison St Unit 1F Kansas City, MO | 2.0 | 1.0 | 1050 | $1,195 | $1.14 | 45d | 1 | 0.58mi |
| 5426 Harrison St Unit 2F Kansas City, MO | 2.0 | 1.0 | 1234 | $1,125 | $0.91 | 18d | 1 | 0.59mi |
| 5424 Harrison St Unit 5426 Kansas City, MO | 2.0 | 1.0 | 1234 | $1,125 | $0.91 | 21d | 1 | 0.59mi |
| 5115 Woodland Ave Kansas City, MO | 4.0 | 1.0 | 1136 | $1,700 | $1.50 | 45d | 1 | 0.59mi |
| 5122 Paseo Blvd Kansas City, MO | 3.0 | 1.0 | 1573 | $1,595 | $1.01 | 12d | 1 | 0.60mi |
| 6014 Virginia Ave Kansas City, MO | 2.0 | 1.0 | 1072 | $1,111 | $1.04 | 9d | 1 | 0.61mi |
| 5120 The Paseo Apt 1 Kansas City, MO | 2.0 | 1.0 | 1500 | $1,550 | $1.03 | 45d | 1 | 0.61mi |
| 5346 Harrison St Kansas City, MO | 3.0 | 1.0 | 1580 | $1,695 | $1.07 | 21d | 1 | 0.62mi |
| 5346 Harrison St Kansas City, MO | 3.0 | 1.0 | 1580 | $1,695 | $1.07 | 18d | 1 | 0.62mi |
| 1702 Bushman Dr Kansas City, MO | 1.0–2.0 | 1.0–2.0 | 895 | $1,065 | $1.19 | 45d | 1 | 0.64mi |
| 5114 Brooklyn Ave Kansas City, MO | 3.0 | 1.5 | 1116 | $1,300 | $1.16 | 9d | 1 | 0.64mi |
| 6024 Tracy Ave Kansas City, MO | 3.0 | 1.0 | 1000 | $1,250 | $1.25 | 18d | 1 | 0.67mi |
| 5424 Charlotte St Kansas City, MO | 2.0 | 1.0 | 958 | $1,395 | $1.46 | 21d | 1 | 0.69mi |
| 5424 Charlotte St Kansas City, MO | 2.0 | 1.0 | 958 | $1,395 | $1.46 | 18d | 1 | 0.70mi |
| 2811 E 58th St Kansas City, MO | 4.0 | 1.0 | 1348 | $1,473 | $1.09 | 45d | 1 | 0.71mi |
| 5335 Holmes St Unit 2F Kansas City, MO | 2.0 | 1.0 | 960 | $1,295 | $1.35 | 18d | 1 | 0.77mi |
| 5335 Holmes St Unit 2F Kansas City, MO | 2.0 | 1.0 | 960 | $1,295 | $1.35 | 25d | 1 | 0.77mi |
| 2420 E 51st St Kansas City, MO | 3.0 | 2.0 | 1460 | $1,350 | $0.92 | 25d | 1 | 0.79mi |
| 4910 Michigan Ave Kansas City, MO | 3.0 | 1.5 | 1199 | $1,400 | $1.17 | 9d | 1 | 0.85mi |
Listing history 24 events
-
2026-06-21days on market $189,900 Active 34 DOM
-
2026-06-18days on market $189,900 Active 31 DOM
-
2026-06-17days on market $189,900 Active 30 DOM
-
2026-06-16days on market $189,900 Active 29 DOM
-
2026-06-15days on market $189,900 Active 28 DOM
-
2026-06-13days on market $189,900 Active 26 DOM
-
2026-06-09days on market $189,900 Active 22 DOM
-
2026-06-08days on market $189,900 Active 21 DOM
-
2026-06-07days on market $189,900 Active 20 DOM
-
2026-06-05days on market $189,900 Active 17 DOM
-
2026-06-03days on market $189,900 Active 16 DOM
-
2026-06-02days on market $189,900 Active 15 DOM
-
2026-06-01days on market $189,900 Active 14 DOM
-
2026-05-31days on market $189,900 Active 13 DOM
-
2026-05-18historical
-
2026-05-18$189,900 Active
-
2025-10-25$219,000 Active
-
2023-07-11soldstatus
-
2022-11-16historical
-
2022-07-07soldstatus
-
2009-05-21soldstatus
Show marketing remark (298 chars)
Bank Owned Property Sold in As-Is Condition. No warranties, disclosures provided by Seller. Proof of funds/ Pre-Approval MUST accompany all offers. Seller hours M-F, 9-5. Response times from Seller varies. Please ask your Buyers to be patient. Addendums apply, BUT not necessary to submit an offer.
-
2009-04-14$7,900
Show marketing remark (298 chars)
Bank Owned Property Sold in As-Is Condition. No warranties, disclosures provided by Seller. Proof of funds/ Pre-Approval MUST accompany all offers. Seller hours M-F, 9-5. Response times from Seller varies. Please ask your Buyers to be patient. Addendums apply, BUT not necessary to submit an offer.
-
2003-04-02soldstatus
-
1984-10-01soldstatus
ⓘ Source: listings_history table (triggers on properties + properties_extension) + one-shot
backfill from property_details.listing_events for pre-trigger history.
Tax reassessment forecast MO · Resets to sale price
- Current annual tax
- $759 · $63/mo
- Projected year-2 tax
- $1,842 · $154/mo
- Expected delta
- +$1,083/yr (+$90/mo · 142.8%)
ⓘ Screening estimate from a state-policy table — verify with the county assessor before closing.
Climate risk First Street
- Flood 1/10 Low FEMA zone X (unshaded) · 0% chance over 30 yrs
- Wildfire 1/10 Low
- Heat 4/10 Moderate 7 d/yr ≥106°F today · 17 d/yr by 30 yrs out
- Wind 2/10 Low
- Air quality 3/10 Moderate 2 unhealthy d/yr today · 4 by 30 yrs out
Nearby sold comps map
Loading sold comps map…
Walkable amenities ~0.75 mi
Loading nearby amenities…
Taxation est. · year 1
- Rental income
- $17,602
- − Mortgage interest
- −$10,637
- − Property taxes
- −$759
- − Insurance
- −$950
- − Repairs & maintenance
- −$1,408
- − Management
- −$1,408
- − Depreciation
- −$5,524
- Taxable loss
- −$3,084
- Est. tax savings @ 24.0%
- +$740
- After-tax cash flow
- $987/yr
For passive investors: Depreciation is non-cash, so a rental often shows a tax loss while cash-flowing — sheltering income. Rental losses are passive: they offset passive income freely, and up to $25,000/yr can offset ordinary (W-2) income if you actively participate and your MAGI is under $100k (phasing out to $0 by $150k); unused losses carry forward. On sale, claimed depreciation is recaptured at up to 25%, and gains may owe capital-gains tax (a 1031 exchange can defer both). Figures are a year-1 estimate at your 24.0% rate — not tax advice; consult a CPA.
Schools (NCES district)
- District
- Kansas City 33
- NCES district ID
- 2916400
- Math proficiency
- 12% ▼ -8.00%
- Reading proficiency
- 24% ▬ 0.00%
- Median HH income
- $35,227
- Composite
- 14.8/100
- National rank
- #9387
- State rank
- #308 of 324 in MO
Livability — Kansas City
- Score
- 78/100
- State rank
- #28
- US rank
- #2671
Category grades
Schools grade is shown separately in the Schools card above.
Census & demographics
- Census place
- Kansas City, MO
- County
- Jackson County · 687,798 people
- City population
- 439,467
- Metro
- Kansas City, MO-KS
- Population (ZIP)
- 16,878
- Household income
- $63,044
- Rent vs Own
- Severe rent burden
- 962.0
Population outlook (Jackson County) Hauer SSP2
- Today (2025)
- 719,589 people
- By 2030
- 731,456 · +1.6%
- By 2040
- 746,689 · +3.8%
- By 2050
- 749,289 · +4.1%
- By 2075
- 736,227 · +2.3%
- By 2100
- 668,210 · -7.1%
Race, ethnicity, and origin ACS 2023
- Neighborhood character
- Diverse neighborhood (Simpson 0.63)
- Race & ethnicity
- White 49% Black 34% Two or more races 10% Hispanic / Latino 9% Asian 2%
- Hispanic origin (detail)
- Mexican 6%
- Common ancestry
- Romanian 2% Lithuanian 2% Italian 2%
- Foreign-born
- 4% · Canada
- Languages at home
- 92% English-only · Spanish 6% French/Haitian/Cajun 1% Other Indo-European 1%
Political lean MEDSL · Jackson
- 2024 margin
- D (+19.3) · D 58.9% · R 39.5% · Other 1.6%
- 2008→2024 swing
- -6.1pp toward R · 2008: 25.4pp · 2024: 19.3pp
- All cycles
- 2024: D+19.3 2020: D+22.0 2016: D+16.6 2012: D+19.0 2008: D+25.4
Not yet ingested
- Civics
- —
Market trends
- HPI YoY
- ▼ -514.37%
- Current HPI
- 371.8501
- Rent YoY
- ▲ 3.95%
- Metro
- Kansas City, MO-KS
- State GDP YoY
- ▲ 1.84%
- F500 in state
- 20
Industry mix (Fortune 500 HQ in MO)
| Industry | F500 HQs | Revenue |
|---|---|---|
| Healthcare | 1 | $163B |
|
||
| Insurance | 1 | $21B |
|
||
| Industrial Technology | 1 | $17B |
|
||
| Retail | 1 | $16B |
|
||
| Industrial Distribution | 1 | $10B |
|
||
| Utilities | 1 | $9B |
|
||
Price history
+2303.8% since first listed10 events — show timeline
- 2026-05-18 Listed $189,900 Heartland MLS as Distributed by MLS Grid
- 2026-05-18 Listing Removed — Heartland MLS as Distributed by MLS Grid
- 2025-10-25 Listed $219,000 Heartland MLS as Distributed by MLS Grid
- 2023-07-11 Sold (Public Records) — Public Records
- 2022-11-16 Rental Removed — RENT.
- 2022-07-07 Sold (Public Records) — Public Records
- 2009-05-21 Sold (MLS) — Heartland MLS as Distributed by MLS Grid
- 2009-04-14 Listed $7,900 Heartland MLS as Distributed by MLS Grid
- 2003-04-02 Sold (Public Records) — Public Records
- 1984-10-01 Sold (Public Records) — Public Records
Property tax history
+6.9%/yrLatest (2025): $759 · -42.2% YoY. Source: county tax records.
Cash-flow waterfall
monthlySold comps — $/sqft
last 12 mo · ≤1 miLoading sold comps…