 🔨 Auction
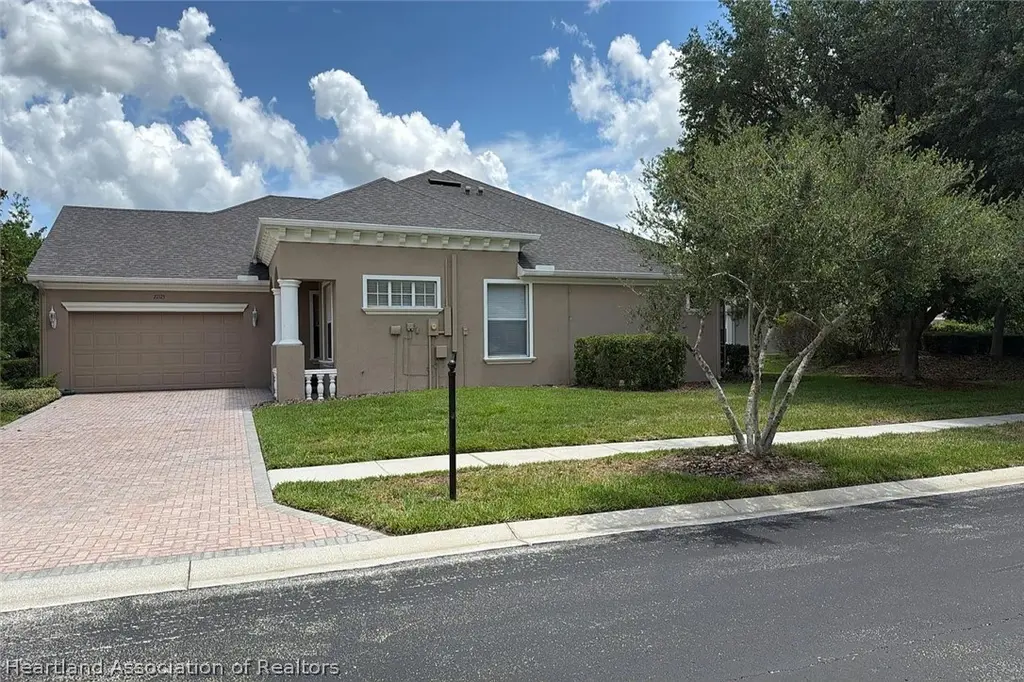
27325 Mistflower Dr · Wesley Chapel, FL
Flood risk 1/10 · Minimal
- FEMA flood zone
- X (unshaded)
- Chance of flooding over 30 yrs
- 0.0%
- Est. flood insurance / yr
- $507 – $1,088
Fire risk 3/10 · Minor
- Est. fire insurance / yr
- $947 – $1,759
Heat risk 10/10 · Severe
- Hot days now (above 109°F)
- 7 days/yr
- Hot days in 30 yrs
- 25 days/yr
Wind risk 9/10 · Severe
- Chance of severe wind over 30 yrs
- 99.0%
Air-quality risk 2/10 · Minimal
- Unhealthy air days now
- 2 days/yr
- Unhealthy air days in 30 yrs
- 2 days/yr
Risk factors via First Street. Map © Google.
Why this score? — see what drove the F grade
The composite is a weighted blend of 9 inputs, each scored 0–100. Each bar is that input's sub-score; the figure is the points it added to the 100-point composite (weight × sub-score).
- ARV discount +7.5/15.0
- Cash flow +5.3/30.0
- Schools +4.3/10.0
- Livability +4.0/5.0
- Condition / age +2.5/5.0
- Rent growth +1.9/5.0
- 1% rule +0.9/10.0
- DSCR +0.0/10.0
- Appreciation +0.0/10.0
$5,000
🖨 Deal sheet 📄 Offer letter ✓ Due diligence
Listing remarks
Foreclosure Auction Ends June 15, 2026 at 11:00 AM EST. Explore this charming 2-bedroom, 2-bath residence set in a peaceful and well-located Zephyrhills community. The list price is the opening bid for the online auction. Sold As-is. Explore more details and submit your bid through Federa Home App.
Key facts
- 7,841 sq ft lot
- 2 garage spots
- Built 2005
Property features AI
Finance
- Other: MPUD zoning
Exterior
- Parking: Garage (2 spaces)
- Utilities: Other water source; Other sewer
- Home design: Single family residence; One level; Residential property
- Construction: Construction materials: See remarks
- Exterior features: Front porch; Other roof
Interior
- Bedrooms: 1 room total
- Flooring: Other
- Bathrooms: 2 full bathrooms
- Heating & cooling: No heating; No cooling
- Interior features: Other flooring
Neighborhood map
What this means for you Summary
Snapshot
- This is a 2-bed/2.0-bath single-family listed at $5k.
Deal economics
- At list price, monthly cash flow is $-833 ($-10k/yr) — negative.
- The deal already cash-flows at list — no discount required.
- Meets the 1% rule at list price ($2k rent vs $5k).
Location & tenants
- Location reads 79/100 on livability (#143 in FL, #2,137 nationally) — a middle-class / working-renter tenant base. Strengths: employment A+, housing A+, health & safety A+; Watch: commute F.
- Pasco (suburban): math 50% / reading 52% proficiency, ranked #32 of 73 in FL (top 44%) — acceptable for families but not a draw, mixed tenant base, ~2y average lease.
- Market conditions: Rents soft (-2.3%/yr); 187 active listings in the ZIP; 17 comparable units currently listed for rent nearby; rentals at typical pace (median 20d on market — plan ~3-4 weeks tenant-placement turnaround); solid renter incomes; 6,765 units permitted in Pasco County in 2024 (1,250 in 5+ unit buildings).
Forward outlook
- Local home prices are declining (-3.0%/yr); year-one equity from $3k of loan paydown is wiped out by about $11k of value loss. Plan a longer hold.
- Pasco County population projected at +29% by 2050 — long-run rental-demand tailwind backs the buy-and-hold thesis.
Negotiation context
- Only 10 days on market — expect competitive offers; lowballing is unlikely to land.
- 7 sale attempts since 17y ago with the ask held roughly flat each time — persistent listings suggest the price (not the market) is what's stuck; bring a comps-based counter.
Risks & watch-outs
- Watch-outs: property tax is 111.4% of price.
- Climate carrying-cost: severe wind risk, 99% chance of damaging wind over 30y; extreme-heat days projected 7→25/yr by 2055 (HVAC capex compounding) — expect insurance premiums to compound above CPI over the hold.
Questions for the listing agent
- What do current leases actually rent for vs. the listed asking? Can we see a recent rent roll and the last 12 months of T-12 income?
- Property tax is high relative to price — has the assessment been appealed recently, and will the sale trigger a re-assessment?
- Is there a deadline driving the sale (1031 exchange, divorce, estate, relocation)? That informs how much negotiation room exists.
- Schools are B-rated — typically a magnet for longer-tenancy family renters. What's the average tenant stay here, and is there a school-zone premium baked into asking?
- The area grade is low — what's the realistic commute time and amenity access for the typical tenant pool here? Any planned neighborhood developments (good or bad) we should know about?
- What's the average days-on-market for RENTAL listings here right now (not sales)? A rising rental-DOM trend means longer vacancies and softer asking-rent achievability than the comps imply.
- What's the recent tenant-quality profile in this submarket — average credit score on applications, eviction rate, late-payment / NSF rate, and stable-employment percentage? A property-management company in the area should have these aggregated.
- How much new for-sale + rental construction is in the pipeline within 1–3 miles? Heavy new supply typically softens prices + rents 12–24 months out; constrained supply supports both.
Investment metrics
- 1% rule
- 0.59% ✗
- Cap rate
- 3.60%
- Cash-on-cash
- -9.61%
- DSCR
- 0.57
- GRM
- 14.1
CMA / ARV
- ARV (on-the-fly)
- $371,406
- Comps found
- 10
Show comp detail 10 sales within ~0.75 mi
| Address | Dist | Beds/Ba | Sqft | Sold | Price | $/sf | Match |
|---|---|---|---|---|---|---|---|
| 27427 Mistflower Dr | 0.05mi | 2/2.0 | 1,673 (0%) | 8mo | $319,000 | $191 | 91 |
| 27421 Mistflower Dr | 0.04mi | 3/2.0 (+1) | 1,751 (+5%) | 23mo | $445,000 | $254 | 66 |
| 3433 Chapel Creek Cir | 0.39mi | 2/2.0 | 1,525 (-9%) | 3mo | $325,000 | $213 | 64 |
| 3252 Chapel Creek Cir | 0.42mi | 3/2.0 (+1) | 1,790 (+7%) | 2mo | $360,880 | $202 | 62 |
| 27021 Cotton Key Ln | 0.69mi | 3/2.5 (+1) | 1,722 (+3%) | 4mo | $375,000 | $218 | 52 |
| 2634 Rosehaven Dr | 0.65mi | 3/2.0 (+1) | 1,570 (-6%) | 8mo | $415,000 | $264 | 48 |
| 27100 Stillbrook Dr | 0.63mi | 3/2.0 (+1) | 1,541 (-8%) | 18mo | $345,000 | $224 | 37 |
| 2609 Rosehaven Dr | 0.70mi | 3/2.0 (+1) | 1,854 (+11%) | 10mo | $389,000 | $210 | 36 |
| 2445 Silvermoss Dr | 0.66mi | 3/2.5 (+1) | 1,871 (+12%) | 15mo | $445,000 | $238 | 30 |
| 26939 Stillbrook Dr | 0.70mi | 3/2.5 (+1) | 1,871 (+12%) | 18mo | $416,000 | $222 | 26 |
Match score weights: distance 35% · size 25% · config 20% · recency 20%. Top-matched comps best support the ARV.
Projected returns pro-forma
-3.0% appreciation · 0.0% rent growth · sell at horizon
- IRR
- -36.8%
- Equity multiple
- -0.15×
- Total profit
- $-119,640
- Equity at exit
- $55,378
- IRR
- -75.1%
- Equity multiple
- -0.90×
- Total profit
- $-197,221
- Equity at exit
- $32,112
Cash invested: $103,994 (down + closing). Projections, not guarantees.
Landlord ↔ Tenant lean methodology
- Overall (STATE)
- 87 Strongly Landlord-Friendly
- State Florida
- 87 Strongly Landlord-Friendly · R+3
- County
- — inherits STATE
- City
- — inherits STATE
ZIP-level market 33544
- Home prices YoY
- -24.1%
- Rents YoY
- -2.3%
- Active inventory
- 187
- Price-to-rent
- 0.2×
Monthly cashflow live
- Estimated rent
- $2,194 high interval (Pro) →
- Mortgage (P&I)
- −$1,948
- Tax est. 1.5%
- −$464 /mo · $5,571/yr
- Insurance
- −$155
- HOA
- −$0
- Vacancy / Maint / Mgmt
- −$461
- Net cashflow
- $-833
Break-even live
UW: 25.0% down · 7.5% · 30yr · 1.5% tax · 5.0% vac · 8.0% maint · 8.0% mgmt
Financing live
Cash to close
- Down payment
- $92,852
- Closing costs
- $11,142
- Reserves months
- —
- Total cash needed
- —
Loan-product check · same deal, 3 products live
Conventional
25% down · 7.5% · 30yr
- Down + closing
- —
- Monthly P&I
- —
- Monthly cashflow
- —
- DSCR
- —
- Eligible?
- —
Personal DTI + credit; lowest rate.
DSCR
20% down · 8.5% · 30yr
- Down + closing
- —
- Monthly P&I
- —
- Monthly cashflow
- —
- DSCR
- —
- Eligible?
- —
No personal income docs; deal must DSCR.
Hard money
10% down · 12.0% · 12mo
- Down + closing
- —
- Monthly P&I
- —
- Monthly cashflow
- —
- DSCR
- —
- Eligible?
- —
Short-term bridge; refi at stabilization.
Rent comps 17 comps
| Address | Beds | Baths | Sqft | Rent | $/sqft | DOM | Units | Dist |
|---|---|---|---|---|---|---|---|---|
| 3312 Chapel Creek Cir Wesley Chapel, FL | 3.0 | 2.0 | 1760 | $2,500 | $1.42 | 14d | 1 | 0.36mi |
| 2954 Willowleaf Ln Wesley Chapel, FL | 2.0 | 2.5 | 1265 | $1,800 | $1.42 | 24d | 1 | 0.62mi |
| 2756 Birchcreek Dr Wesley Chapel, FL | 3.0 | 2.5 | 1513 | $2,000 | $1.32 | 14d | 1 | 0.66mi |
| 3613 Hatchbend Way Wesley Chapel, FL | 3.0 | 2.5 | 1722 | $2,360 | $1.37 | 21d | 1 | 0.67mi |
| 27028 Cool Stream Ln Wesley Chapel, FL | 3.0 | 2.0 | 1706 | $2,100 | $1.23 | 24d | 1 | 0.70mi |
| 2405 Silvermoss Dr Wesley Chapel, FL | 3.0 | 2.5 | 2070 | $2,600 | $1.26 | 17d | 1 | 0.74mi |
| 2401 Silvermoss Dr Wesley Chapel, FL | 3.0 | 2.5 | 1871 | $2,500 | $1.34 | 24d | 1 | 0.75mi |
| 2409 Spring Hollow Loop Wesley Chapel, FL | 3.0 | 2.0 | 1296 | $2,250 | $1.74 | 24d | 1 | 0.76mi |
| 26948 Juniper Bay Dr Wesley Chapel, FL | 3.0 | 2.5 | 1534 | $2,200 | $1.43 | 16d | 1 | 0.77mi |
| 26627 Castleview Way Wesley Chapel, FL | 3.0 | 2.5 | 1545 | $2,050 | $1.33 | 24d | 1 | 0.83mi |
| 26638 Castleview Way Wesley Chapel, FL | 3.0 | 2.5 | 1545 | $2,050 | $1.33 | 24d | 1 | 0.85mi |
| 26551 Castleview Way Wesley Chapel, FL | 3.0 | 2.5 | 1588 | $1,995 | $1.26 | 19d | 1 | 0.87mi |
| 2300 Guards St Wesley Chapel, FL | 2.0–3.0 | 1.0–2.0 | 1228 | $1,555 | $1.27 | 4d | 9 | 0.87mi |
| 26546 Castleview Way Wesley Chapel, FL | 3.0 | 2.5 | 1588 | $2,100 | $1.32 | 20d | 1 | 0.89mi |
| 3916 Silverlake Way Wesley Chapel, FL | 3.0 | 3.0 | 1534 | $2,200 | $1.43 | 24d | 1 | 0.96mi |
| 3943 Claybrook Dr Wesley Chapel, FL | 3.0 | 2.5 | 2048 | $2,249 | $1.10 | 14d | 1 | 1.01mi |
| 2990 Citron Gold Blvd Lutz, FL | 1.0–3.0 | 1.0–2.5 | 1115 | $2,255 | $2.02 | 1d | 17 | 1.47mi |
Listing history 6 events
-
2026-06-15days on market $5,000 Active 10 DOM
-
2026-06-13days on market $5,000 Active 8 DOM
-
2026-06-09days on market $5,000 Active 4 DOM
-
2026-06-08days on market $5,000 Active 3 DOM
-
2026-06-07remarks 299-char remark
-
2026-06-07$5,000 Active 2 DOM
ⓘ Source: listings_history table (triggers on properties + properties_extension) + one-shot
backfill from property_details.listing_events for pre-trigger history.
Climate risk First Street
- Flood 1/10 Low FEMA zone X (unshaded) · 0% chance over 30 yrs
- Wildfire 3/10 Moderate
- Heat 10/10 Extreme 7 d/yr ≥109°F today · 25 d/yr by 30 yrs out
- Wind 9/10 Extreme 99% chance of damaging wind over 30 yrs
- Air quality 2/10 Low 2 unhealthy d/yr today · 2 by 30 yrs out
Nearby sold comps map
Loading sold comps map…
Walkable amenities ~0.75 mi
Loading nearby amenities…
Taxation est. · year 1
- Rental income
- $26,334
- − Mortgage interest
- −$20,805
- − Property taxes
- −$5,571
- − Insurance
- −$1,857
- − Repairs & maintenance
- −$2,107
- − Management
- −$2,107
- − Depreciation
- −$10,805
- Taxable loss
- −$16,917
- Est. tax savings @ 24.0%
- +$4,060
- After-tax cash flow
- $-5,937/yr
For passive investors: Depreciation is non-cash, so a rental often shows a tax loss while cash-flowing — sheltering income. Rental losses are passive: they offset passive income freely, and up to $25,000/yr can offset ordinary (W-2) income if you actively participate and your MAGI is under $100k (phasing out to $0 by $150k); unused losses carry forward. On sale, claimed depreciation is recaptured at up to 25%, and gains may owe capital-gains tax (a 1031 exchange can defer both). Figures are a year-1 estimate at your 24.0% rate — not tax advice; consult a CPA.
Schools (NCES district)
- District
- Pasco
- NCES district ID
- 1201530
- Math proficiency
- 50% ▼ -10.00%
- Reading proficiency
- 52% ▼ -5.00%
- Median HH income
- $45,039
- Composite
- 43.14/100
- National rank
- #3074
- State rank
- #32 of 73 in FL
Livability — Wesley Chapel
- Score
- 79/100
- State rank
- #143
- US rank
- #2137
Category grades
Schools grade is shown separately in the Schools card above.
Census & demographics
- Census place
- Wesley Chapel, FL
- County
- Pasco County · 524,098 people
- City population
- 100,771
- Metro
- Tampa-St. Petersburg-Clearwater, FL
- Population (ZIP)
- 29,901
- Household income
- $104,573
- Rent vs Own
- Severe rent burden
- 378.0
Population outlook (Pasco County) Hauer SSP2
- Today (2025)
- 570,045 people
- By 2030
- 605,844 · +6.3%
- By 2040
- 674,806 · +18.4%
- By 2050
- 736,022 · +29.1%
- By 2075
- 862,900 · +51.4%
- By 2100
- 906,364 · +59.0%
Race, ethnicity, and origin ACS 2023
- Neighborhood character
- Diverse neighborhood (Simpson 0.62)
- Race & ethnicity
- White 56% Hispanic / Latino 24% Two or more races 20% Black 9% Asian 5%
- Hispanic origin (detail)
- Mexican 1% Puerto Rican 9% Cuban 6% Dominican 1%
- Common ancestry
- Romanian 2% Italian 2% Lithuanian 2%
- Foreign-born
- 15% · Canada, Jamaica, China
- Languages at home
- 73% English-only · Spanish 17% Other Indo-European 2% Arabic 2%
Political lean MEDSL · Pasco
- 2024 margin
- Strong R (+25.2) · D 36.9% · R 62.1% · Other 1.0%
- 2008→2024 swing
- -21.6pp toward R · 2008: -3.6pp · 2024: -25.2pp
- All cycles
- 2024: R+25.2 2020: R+20.1 2016: R+21.6 2012: R+6.7 2008: R+3.6
Not yet ingested
- Civics
- —
Market trends
- HPI YoY
- ▼ -84.76%
- Current HPI
- 266.5191
- Rent YoY
- ▼ -2.30%
- Metro
- Tampa-St. Petersburg-Clearwater, FL
- State GDP YoY
- ▲ 3.28%
- F500 in state
- 36
Industry mix (Fortune 500 HQ in FL)
| Industry | F500 HQs | Revenue |
|---|---|---|
| Industrial Technology | 2 | $29B |
|
||
| Insurance | 2 | $17B |
|
||
| Retail | 1 | $60B |
|
||
| Technology Distribution | 1 | $58B |
|
||
| Homebuilding | 1 | $35B |
|
||
| Technology Manufacturing | 1 | $35B |
|
||
Price history
-97.9% since first listed21 events — show timeline
- 2026-06-05 Listed $5,000 HAOR as distributed by MLS GRID
- 2025-09-16 Listing Removed — Stellar MLS as Distributed by MLS Grid
- 2025-07-11 Relisted — Stellar MLS as Distributed by MLS Grid
- 2025-07-01 Listing Removed — Stellar MLS as Distributed by MLS Grid
- 2025-05-21 Price Changed $369,000 Stellar MLS as Distributed by MLS Grid
- 2025-02-28 Price Changed $375,000 Stellar MLS as Distributed by MLS Grid
- 2025-02-18 Price Changed $389,900 Stellar MLS as Distributed by MLS Grid
- 2025-01-17 Listed $409,900 Stellar MLS as Distributed by MLS Grid
- 2024-12-31 Listing Removed — Stellar MLS as Distributed by MLS Grid
- 2024-09-23 Listed $430,000 Stellar MLS as Distributed by MLS Grid
- 2023-02-06 Sold (Public Records) $355,000 Public Records
- 2023-01-27 Sold (MLS) $355,000 Stellar MLS as Distributed by MLS Grid
- 2023-01-03 Pending — Stellar MLS as Distributed by MLS Grid
- 2022-12-08 Price Changed $365,000 Stellar MLS as Distributed by MLS Grid
- 2022-11-17 Price Changed $385,000 Stellar MLS as Distributed by MLS Grid
- 2022-11-09 Price Changed $400,000 Stellar MLS as Distributed by MLS Grid
- 2022-10-21 Listed $425,000 Stellar MLS as Distributed by MLS Grid
- 2013-10-07 Sold (Public Records) $219,900 Public Records
- 2011-09-17 Listed $210,000 Stellar MLS as Distributed by MLS Grid
- 2010-02-11 Listing Removed — Stellar MLS as Distributed by MLS Grid
- 2009-07-13 Listed $239,000 Stellar MLS as Distributed by MLS Grid
Property tax history
+9.8%/yrLatest (2025): $8,171 · -2.5% YoY. Source: county tax records.
Cash-flow waterfall
monthlySold comps — $/sqft
last 12 mo · ≤1 miLoading sold comps…