 Duplex
None · Henderson, NC
Flood risk 1/10 · Minimal
- FEMA flood zone
- X (unshaded)
- Chance of flooding over 30 yrs
- 0.0%
- Est. flood insurance / yr
- $507 – $1,088
Fire risk 2/10 · Minimal
- Est. fire insurance / yr
- $906 – $1,684
Heat risk 6/10 · Moderate
- Hot days now (above 104°F)
- 7 days/yr
- Hot days in 30 yrs
- 17 days/yr
Wind risk 6/10 · Moderate
- Chance of severe wind over 30 yrs
- 27.0%
Air-quality risk 1/10 · Minimal
- Unhealthy air days now
- 0 days/yr
- Unhealthy air days in 30 yrs
- 0 days/yr
Risk factors via First Street. Map © Google.
Why this score? — see what drove the F grade
The composite is a weighted blend of 9 inputs, each scored 0–100. Each bar is that input's sub-score; the figure is the points it added to the 100-point composite (weight × sub-score).
- ARV discount +7.5/15.0
- Cash flow +5.8/30.0
- Livability +2.9/5.0
- Rent growth +2.5/5.0
- Condition / age +2.5/5.0
- Schools +1.9/10.0
- 1% rule +0.2/10.0
- DSCR +0.2/10.0
- Appreciation +0.0/10.0
$315,000
🖨 Deal sheet 📄 Offer letter ✓ Due diligence
Multi-family units
County records classify this as Multi-Family (2-4 Unit). Listing-text estimate: 2 units. confirmed
Listing remarks
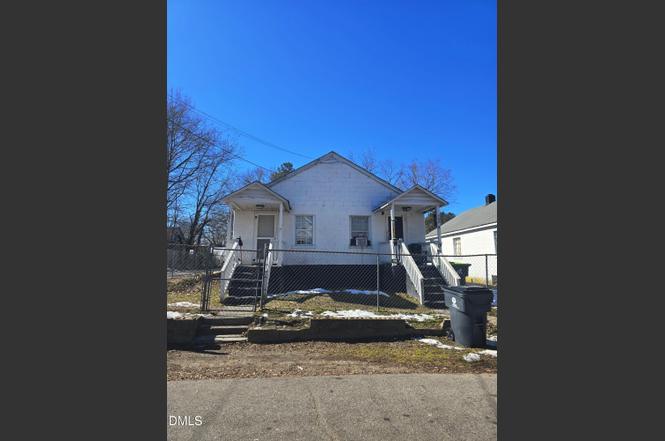
INVESTMENT PORTFOLIO - 3 DUPLEXES 301, 303, 305, 307 Pearl Street & 508, 510 Lone Street Henderson NC 27536 This investment porfolio includes three duplex properties! Situated within the city limits, these opportunities present a strong opportunity for investors seeking immediate cash flow with long-term growth potential in the Henderson rental market. A total of six rental units, all currently tenant-occupied on a month to month lease. With tenants already in place, the new owner would benefit from immediate income! With steady rental demand in Henderson and the advantage of multiple doors under one acquisition, this property is well-suited for buy-and-hold investors looking
Key facts
- 4,356 sq ft lot
- 4 parking spots
- Built 1951
Property features AI
Finance
- Other: Building area approximately 3,510 (total living area)
- Financial info: Three total units; Owner pays all utilities
- HOA & community: No association
Exterior
- Parking: Open parking with 4 spaces
- Utilities: Public water; Public sewer
- Home design: Duplex / multifamily property; One level
- Construction: Concrete construction
- Exterior features: Chain link fencing; Shingle roof; Lot approximately 0.1 acre (about 4,356 sq ft)
Interior
- Bedrooms: Six bedrooms total
- Flooring: Carpet; Laminate
- Bathrooms: Six full bathrooms
- Heating & cooling: Natural gas heating; Wall/window cooling units
- Interior features: Carpet and laminate flooring; Three separate buildings (multifamily); Concrete foundation
- Laundry & utility: Owner pays all utilities
Neighborhood map
What this means for you Summary
Snapshot
- This is a 2 × 3-bed/1.5-bath units multifamily listed at $315k.
Deal economics
- At list price, monthly cash flow is $-631 ($-8k/yr) — negative. Per door: $-315/mo.
- To cash-flow at today's rent, offer at most $204k (35.4% below list).
- To meet the 1% rule (rent ≥ 1% of price), the offer needs to be $165k (47.7% below list).
- Recommended offer: $165k (47.7% below list) — sets the bar for 1% rule.
Location & tenants
- Location reads 58/100 on livability (#583 in NC) — a working-class tenant base; expect higher turnover. Strengths: cost of living A+, health & safety A+, housing B; Watch: crime F, amenities F, commute F.
- Vance County Schools (rural): math 20% / reading 27% proficiency, ranked #166 of 178 in NC (top 93%) — low school quality limits family demand, transient renter base, plan for 1-2y turnover; 81% free/reduced lunch — lower-income household profile, screen leases tightly.
- Zoned schools: Pinkston Street Elementary (math 27% / reading 27%, grade F, #1,033 of 1,410 statewide, top 76%, 263 students, 99% FRL); Vance County Middle School (math 13% / reading 17%, grade F, #459 of 475 statewide, top 97%, 797 students, 100% FRL); Vance County High School (math 12% / reading 27%, grade F, #499 of 535 statewide, top 94%, 958 students, 100% FRL) — zoned schools average 99% FRL vs 81% district-wide (18 pts higher); higher-poverty schools than district average — tighter screening recommended.
- Market conditions: 113 active listings in the ZIP; 22 comparable units currently listed for rent nearby; rentals at typical pace (median 21d on market — plan ~3-4 weeks tenant-placement turnaround); lower-income renter base — watch delinquency; 73 units permitted in Vance County in 2024 (0 in 5+ unit buildings).
- At $1,649/mo this rent would consume 49% of the median local household income ($40k/yr) (locally 1110% of renters already pay >50% of income on rent) — very limited rent-growth headroom before tenants either downsize or default.
Forward outlook
- Local home prices are declining (-3.0%/yr); year-one equity from $2k of loan paydown is wiped out by about $9k of value loss. Plan a longer hold.
- Vance County population projected at -23% by 2050 — secular population decline; favor cash flow + early exit over multi-decade hold.
Negotiation context
- It's been on market 118 days — a 9% lower offer ($287k) is reasonable based on typical stale-listing flexibility.
Risks & watch-outs
- Watch-outs: built in 1951 — expect roof / HVAC / electrical / plumbing capex.
- Climate carrying-cost: major wind risk, 27% chance of damaging wind over 30y; extreme-heat days projected 7→17/yr by 2055 (HVAC capex compounding) — expect insurance premiums to compound above CPI over the hold.
Questions for the listing agent
- What do current leases actually rent for vs. the listed asking? Can we see a recent rent roll and the last 12 months of T-12 income?
- It's been on market 118 days. Have you received any prior offers? Is the seller open to a 48% concession, seller financing, or rate buy-down credit?
- Can we see the unit-by-unit rent roll, current vacancy, and any below-market leases? What's the average tenancy length?
- What capital expenditures (roof, boiler, parking lot, exteriors) have been made in the last 5 years, and what's planned in the next 2?
- Built in 1951 — when were the roof, HVAC, electrical panel, plumbing, and water heater last replaced?
- Why hasn't it sold? Are there any deal-killer items the seller is aware of (foundation, flood, title, zoning, code violations)?
- Is there a deadline driving the sale (1031 exchange, divorce, estate, relocation)? That informs how much negotiation room exists.
- Schools are F-rated, which usually means shorter tenancies and higher turnover. Who's the typical renter profile here, and what's been the actual vacancy rate?
- Crime grade is F in this area — have there been break-ins, vandalism, or insurance claims at this property in the last 3 years? What carrier currently insures it and at what premium?
- The area grade is low — what's the realistic commute time and amenity access for the typical tenant pool here? Any planned neighborhood developments (good or bad) we should know about?
- What's the average days-on-market for RENTAL listings here right now (not sales)? A rising rental-DOM trend means longer vacancies and softer asking-rent achievability than the comps imply.
- What's the recent tenant-quality profile in this submarket — average credit score on applications, eviction rate, late-payment / NSF rate, and stable-employment percentage? A property-management company in the area should have these aggregated.
- How much new apartment / multifamily construction is in the pipeline within 1–3 miles? Heavy new supply (>2% of stock underway) typically softens rents 12–24 months out; light construction supports rent growth.
Investment metrics
- 1% rule
- 0.52% ✗
- Cap rate
- 3.89%
- Cash-on-cash
- -8.58%
- DSCR
- 0.62
- GRM
- 15.9
CMA / ARV
No comps found within radius.
Projected returns pro-forma
-3.0% appreciation · 3.0% rent growth · sell at horizon
- IRR
- -31.5%
- Equity multiple
- -0.04×
- Total profit
- $-91,351
- Equity at exit
- $46,968
- IRR
- -35.8%
- Equity multiple
- -0.49×
- Total profit
- $-131,795
- Equity at exit
- $27,235
Cash invested: $88,200 (down + closing). Projections, not guarantees.
Landlord ↔ Tenant lean methodology
- Overall (STATE)
- 85 Strongly Landlord-Friendly
- State North Carolina
- 85 Strongly Landlord-Friendly · R+3
- County
- — inherits STATE
- City
- — inherits STATE
ZIP-level market 27536
- Active inventory
- 113
- Price-to-rent
- 31.8×
Monthly cashflow live
- Estimated rent
- $1,649 high interval (Pro) →
- Mortgage (P&I)
- −$1,652
- Tax from tax record
- −$150 /mo · $1,806/yr
- Insurance
- −$131
- HOA
- −$0
- Vacancy / Maint / Mgmt
- −$346
- Net cashflow
- $-631
Break-even live
2-unit breakdown (identical units grouped — click to expand)
| Units | Beds | Baths | Est. rent |
|---|---|---|---|
| 2× units | 3 | 1.5 | $1,648 |
| #1 | 3 | 1.5 | $824 |
| #2 | 3 | 1.5 | $824 |
| Total (2 units) | $1,649 | ||
UW: 25.0% down · 7.5% · 30yr · 1.5% tax · 5.0% vac · 8.0% maint · 8.0% mgmt
Financing live
Cash to close
- Down payment
- $78,750
- Closing costs
- $9,450
- Reserves months
- —
- Total cash needed
- —
Loan-product check · same deal, 3 products live
Conventional
25% down · 7.5% · 30yr
- Down + closing
- —
- Monthly P&I
- —
- Monthly cashflow
- —
- DSCR
- —
- Eligible?
- —
Personal DTI + credit; lowest rate.
DSCR
20% down · 8.5% · 30yr
- Down + closing
- —
- Monthly P&I
- —
- Monthly cashflow
- —
- DSCR
- —
- Eligible?
- —
No personal income docs; deal must DSCR.
Hard money
10% down · 12.0% · 12mo
- Down + closing
- —
- Monthly P&I
- —
- Monthly cashflow
- —
- DSCR
- —
- Eligible?
- —
Short-term bridge; refi at stabilization.
Rent comps 22 comps
| Address | Beds | Baths | Sqft | Rent | $/sqft | DOM | Units | Dist |
|---|---|---|---|---|---|---|---|---|
| 904 Burr St Henderson, NC | 2.0 | 1.0 | 720 | $725 | $1.01 | 14d | 1 | 0.46mi |
| 433 Norvell St Henderson, NC | 2.0 | 1.5 | 1216 | $1,075 | $0.88 | 23d | 1 | 0.47mi |
| 976 Burr St Henderson, NC | 2.0 | 1.0 | 750 | $745 | $0.99 | 14d | 1 | 0.48mi |
| 980 Burr St Henderson, NC | 2.0 | 1.0 | 750 | $745 | $0.99 | 14d | 1 | 0.49mi |
| 865 Lamb St Henderson, NC | 2.0 | 1.0 | 926 | $695 | $0.75 | 23d | 1 | 0.51mi |
| 909 Lamb St Henderson, NC | 2.0 | 1.0 | 1083 | $995 | $0.92 | 23d | 1 | 0.53mi |
| 758 David St Henderson, NC | 2.0 | 1.0 | 1020 | $775 | $0.76 | 20d | 1 | 0.55mi |
| 908 David St Henderson, NC | 2.0 | 1.0 | 880 | $775 | $0.88 | 12d | 1 | 0.56mi |
| 726 E Andrews Ave Henderson, NC | 3.0 | 2.0 | 1068 | $795 | $0.74 | 23d | 1 | 0.67mi |
| 105 Holly Ct Henderson, NC | 2.0 | 1.0 | 800 | $795 | $0.99 | 20d | 1 | 0.67mi |
| 543 Horner St Henderson, NC | 2.0 | 1.0 | 700 | $695 | $0.99 | 20d | 1 | 0.70mi |
| 1023 Hughes St Henderson, NC | 2.0 | 1.0 | 845 | $765 | $0.91 | 4d | 1 | 0.73mi |
| 623 Farrar Ave Henderson, NC | 2.0 | 1.0 | 728 | $695 | $0.95 | 23d | 1 | 0.75mi |
| 1749 Old Norlina Rd Henderson, NC | 3.0 | 1.0 | 928 | $895 | $0.96 | 4d | 1 | 0.92mi |
| 434 Owen St Henderson, NC | 3.0 | 1.5 | 1154 | $795 | $0.69 | 16d | 1 | 0.96mi |
| 943 Patton Cir Henderson, NC | 3.0 | 2.0 | 1200 | $1,499 | $1.25 | 21d | 1 | 0.98mi |
| 913 Lehman St Henderson, NC | 3.0 | 1.0 | 966 | $795 | $0.82 | 23d | 1 | 1.06mi |
| 926 Gay St Henderson, NC | 2.0 | 1.0 | 847 | $825 | $0.97 | 23d | 1 | 1.07mi |
| 1027 Maple St Unit 1029 Henderson, NC | 2.0 | 1.0 | 800 | $775 | $0.97 | 21d | 1 | 1.09mi |
| 1216 2nd St Henderson, NC | 2.0 | 1.0 | 796 | $995 | $1.25 | 23d | 1 | 1.13mi |
| 210 Corbitt Rd Unit 224 Henderson, NC | 2.0 | 1.5 | 1148 | $1,175 | $1.02 | 23d | 1 | 1.20mi |
| 1637 Berry Ave Henderson, NC | 3.0 | 2.5 | 1396 | $1,850 | $1.33 | 12d | 1 | 1.28mi |
Listing history 15 events
-
2026-06-18days on market $315,000 Active 118 DOM
-
2026-06-17days on market $315,000 Active 117 DOM
-
2026-06-16days on market $315,000 Active 116 DOM
-
2026-06-15days on market $315,000 Active 115 DOM
-
2026-06-13days on market $315,000 Active 113 DOM
-
2026-06-09days on market $315,000 Active 109 DOM
-
2026-06-08days on market $315,000 Active 108 DOM
-
2026-06-07days on market $315,000 Active 107 DOM
-
2026-06-03days on market $315,000 Active 103 DOM
-
2026-06-02days on market $315,000 Active 102 DOM
-
2026-06-01days on market $315,000 Active 101 DOM
-
2026-05-31days on market $315,000 Active 100 DOM
-
2026-05-04price $315,000
-
2026-03-08price $325,000
-
2026-02-20$345,000 Active
ⓘ Source: listings_history table (triggers on properties + properties_extension) + one-shot
backfill from property_details.listing_events for pre-trigger history.
Tax reassessment forecast NC · Resets to sale price
- Current annual tax
- $1,806 · $150/mo
- Projected year-2 tax
- $2,583 · $215/mo
- Expected delta
- +$777/yr (+$65/mo · 43.0%)
ⓘ Screening estimate from a state-policy table — verify with the county assessor before closing.
Climate risk First Street
- Flood 1/10 Low FEMA zone X (unshaded) · 0% chance over 30 yrs
- Wildfire 2/10 Low
- Heat 6/10 Major 7 d/yr ≥104°F today · 17 d/yr by 30 yrs out
- Wind 6/10 Major 27% chance of damaging wind over 30 yrs
- Air quality 1/10 Low 0 unhealthy d/yr today · 0 by 30 yrs out
Nearby sold comps map
Loading sold comps map…
Walkable amenities ~0.75 mi
Loading nearby amenities…
Taxation est. · year 1
- Rental income
- $19,788
- − Mortgage interest
- −$17,645
- − Property taxes
- −$1,806
- − Insurance
- −$1,575
- − Repairs & maintenance
- −$1,583
- − Management
- −$1,583
- − Depreciation
- −$9,164
- Taxable loss
- −$13,567
- Est. tax savings @ 24.0%
- +$3,256
- After-tax cash flow
- $-4,315/yr
For passive investors: Depreciation is non-cash, so a rental often shows a tax loss while cash-flowing — sheltering income. Rental losses are passive: they offset passive income freely, and up to $25,000/yr can offset ordinary (W-2) income if you actively participate and your MAGI is under $100k (phasing out to $0 by $150k); unused losses carry forward. On sale, claimed depreciation is recaptured at up to 25%, and gains may owe capital-gains tax (a 1031 exchange can defer both). Figures are a year-1 estimate at your 24.0% rate — not tax advice; consult a CPA.
Schools (NCES district)
- District
- Vance County Schools
- NCES district ID
- 3704650
- Math proficiency
- 20% ▼ -7.00%
- Reading proficiency
- 27% ▼ -5.00%
- Median HH income
- $34,323
- Composite
- 19.29/100
- National rank
- #8801
- State rank
- #166 of 178 in NC
Livability — Henderson
- Score
- 58/100
- State rank
- #583
- US rank
- #21468
Category grades
Schools grade is shown separately in the Schools card above.
Census & demographics
- Census place
- Henderson, NC
- County
- Vance County · 15,298 people
- City population
- 15,298
- Metro
- Henderson, NC
- Population (ZIP)
- 15,298
- Household income
- $39,985
- Rent vs Own
- Severe rent burden
- 1110.0
Population outlook (Vance County) Hauer SSP2
- Today (2025)
- 41,985 people
- By 2030
- 40,286 · -4.0%
- By 2040
- 36,372 · -13.4%
- By 2050
- 32,466 · -22.7%
- By 2075
- 24,229 · -42.3%
- By 2100
- 17,784 · -57.6%
Race, ethnicity, and origin ACS 2023
- Neighborhood character
- Diverse neighborhood (Simpson 0.56)
- Race & ethnicity
- Black 60% White 26% Hispanic / Latino 12% Two or more races 5%
- Hispanic origin (detail)
- Mexican 9%
- Common ancestry
- Serbian 1% Italian 1% Iranian 1%
- Foreign-born
- 6% · Canada
- Languages at home
- 91% English-only · Spanish 6% Arabic 1% French/Haitian/Cajun 1%
Political lean MEDSL · Vance
- 2024 margin
- D (+13.3) · D 56.3% · R 42.9%
- 2008→2024 swing
- -13.3pp toward R · 2008: 26.6pp · 2024: 13.3pp
- All cycles
- 2024: D+13.3 2020: D+19.2 2016: D+24.6 2012: D+28.3 2008: D+26.6
Not yet ingested
- Civics
- —
Market trends
- HPI YoY
- ▼ -122.23%
- Current HPI
- 198.8762
- Rent YoY
- —
- Metro
- Henderson, NC
- State GDP YoY
- ▲ 3.28%
- F500 in state
- 26
Industry mix (Fortune 500 HQ in NC)
| Industry | F500 HQs | Revenue |
|---|---|---|
| Financial Services | 2 | $213B |
|
||
| Retail | 2 | $95B |
|
||
| Industrial Conglomerate | 1 | $38B |
|
||
| Metals / Steel | 1 | $35B |
|
||
| Utilities | 1 | $30B |
|
||
| Industrial Machinery | 1 | $19B |
|
||
Price history
-8.7% since first listed3 events — show timeline
- 2026-05-04 Price Changed $315,000 TMLS
- 2026-03-08 Price Changed $325,000 TMLS
- 2026-02-20 Listed $345,000 TMLS
Property tax history
+6.9%/yrLatest (2025): $1,806 · -21.7% YoY. Source: county tax records.
Cash-flow waterfall
monthlySold comps — $/sqft
last 12 mo · ≤1 miLoading sold comps…