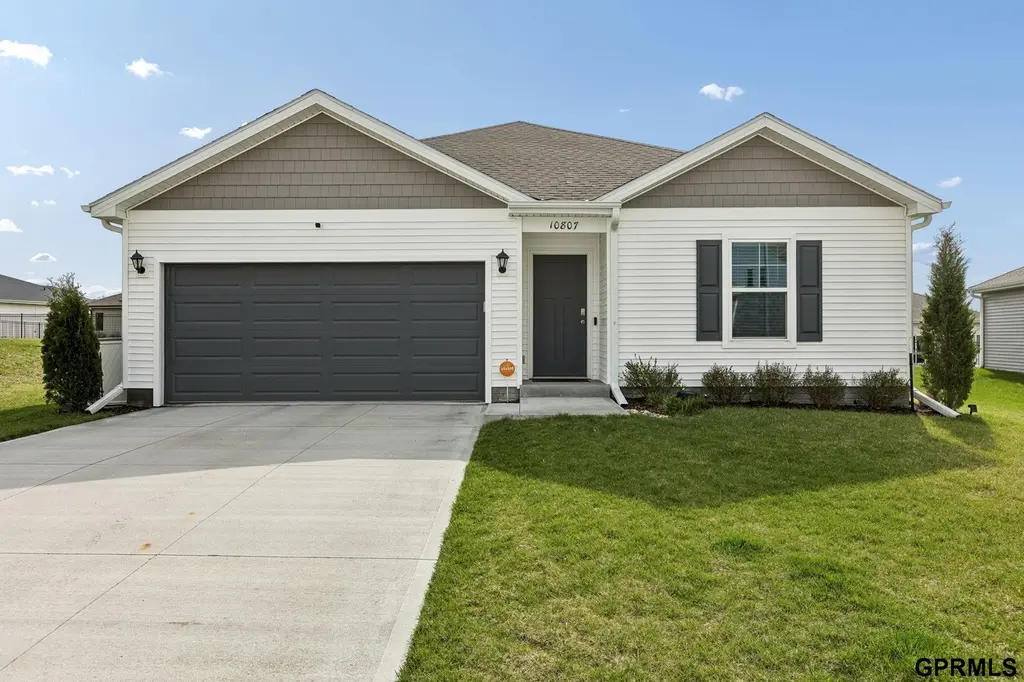
10807 S 177th St · Gretna, NE
Flood risk 1/10 · Minimal
- FEMA flood zone
- X (unshaded)
- Chance of flooding over 30 yrs
- 0.0%
- Est. flood insurance / yr
- $473 – $860
Fire risk 1/10 · Minimal
- Est. fire insurance / yr
- $1,161 – $2,155
Heat risk 3/10 · Minor
- Hot days now (above 103°F)
- 7 days/yr
- Hot days in 30 yrs
- 16 days/yr
Wind risk 2/10 · Minimal
- Chance of severe wind over 30 yrs
- —
Air-quality risk 1/10 · Minimal
- Unhealthy air days now
- 0 days/yr
- Unhealthy air days in 30 yrs
- 0 days/yr
Risk factors via First Street. Map © Google.
Why this score? — see what drove the D grade
The composite is a weighted blend of 9 inputs, each scored 0–100. Each bar is that input's sub-score; the figure is the points it added to the 100-point composite (weight × sub-score).
- ARV discount +10.5/15.0
- Cash flow +8.1/30.0
- Schools +5.8/10.0
- Livability +4.1/5.0
- Condition / age +4.0/5.0
- Rent growth +3.5/5.0
- 1% rule +3.3/10.0
- DSCR +2.2/10.0
- Appreciation +0.0/10.0
$320,000
🖨 Deal sheet (PDF) 📄 Offer letter ✓ Due diligence
Listing remarks
Say hello to this 4 bed, 2 bath, 2 car ranch on slab home in desirable Tiburon Ridge North! Why wait to build when this move-in ready home already includes window blinds? The open-concept layout features a cozy fireplace that flows seamlessly into the dining area, perfect for everyday living and entertaining. The kitchen offers a spacious island ideal for gathering. The primary suite boasts a bright, airy feel, complete with a walk-in closet and ¾ bath featuring double sinks and a shower. With three other bedrooms and a full bath, there is space for an office, flex room, or playroom! Step outside to a fully fenced backyard, perfect for relaxing or hosting guests, with landscaping tha
Key facts
- Spacious island
- Walk-in closet
- Landscaping
Tags
Property features AI
Finance
- HOA & community: Homeowners association present; fees paid annually
Exterior
- Parking: Attached 2-car garage; Two covered parking spaces
- Utilities: Public water; Public sewer
- Home design: Single-family residential home; Not new / not a model; One story (main floor living); Composition roof
- Construction: Vinyl siding; Concrete perimeter and slab foundation; Built in 2023
- Exterior features: Patio; Lot is subdivided and about 0.215 acre (lot dimensions approx. 47 x 138.4 x 88.8 x 119.9)
Interior
- Kitchen: Range; Refrigerator; Dishwasher; Microwave; Disposal
- Bedrooms: Master bedroom on the main floor (approx. 13.1 x 12.5); Additional bedrooms on the main floor (bedroom 2 approx. 11.3 x 10.1; bedroom 3 approx. 11.3 x 10.1; bedroom 4 approx. 10.4 x 9.8); Great room located on the main floor
- Bathrooms: Two bathrooms total: one full bath and one three-quarter bath, both on the main level
- Heating & cooling: Natural gas forced air heating; Central air conditioning
- Interior features: Electric fireplace (1); Fireplace
- Laundry & utility: Washer; Dryer
Neighborhood map
What this means for you Summary
Snapshot
- This is a 4-bed/2.0-bath single-family listed at $320k. Condition is rated good.
Deal economics
- At list price, monthly cash flow is $-307 ($-4k/yr) — negative.
- To cash-flow at today's rent, offer at most $266k (17.0% below list).
- To meet the 1% rule (rent ≥ 1% of price), the offer needs to be $264k (17.5% below list).
- Recommended offer: $264k (17.5% below list) — sets the bar for 1% rule.
- Cap rate 5.1% vs local median 2.6% in Gretna — top-decile yield for the area; either an underpriced asset or a hidden risk that comps aren't pricing in. Stress-test before assuming the spread holds.
Location & tenants
- Location reads 82/100 on livability (#13 in NE, #1,227 nationally) — a professional / high-income tenant draw. Strengths: crime A+, cost of living A+, housing A+; Watch: amenities F, commute F.
- Gretna Public Schools (suburban): math 64% / reading 64% proficiency, ranked #6 of 111 in NE (top 5%) — acceptable for families but not a draw, mixed tenant base, ~2y average lease; only 5% free/reduced lunch — higher-income household profile.
- Zoned schools: Palisades Elementary School (math 79% / reading 74%, grade A, #17 of 502 statewide, top 3%, 490 students, 6% FRL); Aspen Creek Middle School (math 65% / reading 63%, grade B+, #12 of 128 statewide, top 9%, 777 students, 9% FRL); Gretna High School (math 63% / reading 64%, grade B-, #37 of 261 statewide, top 14%, 1,729 students, 11% FRL) — zoned schools at 9% FRL track the district average.
- Market conditions: Rents rising fast (+4.1%/yr); 255 active listings in the ZIP; 4 comparable units currently listed for rent nearby; rentals leasing fast (median 5d on market — plan ~1-2 weeks tenant-placement turnaround); high-income renter base; 1,612 units permitted in Sarpy County in 2024 (364 in 5+ unit buildings).
Forward outlook
- Local home prices are declining (-3.0%/yr); year-one equity from $2k of loan paydown is wiped out by about $10k of value loss. Plan a longer hold.
- Sarpy County population projected at +41% by 2050 — long-run rental-demand tailwind backs the buy-and-hold thesis.
Negotiation context
- Only 4 days on market — expect competitive offers; lowballing is unlikely to land.
- 4 sale attempts since 3y ago with the ask held roughly flat each time — persistent listings suggest the price (not the market) is what's stuck; bring a comps-based counter.
Questions for the listing agent
- What do current leases actually rent for vs. the listed asking? Can we see a recent rent roll and the last 12 months of T-12 income?
- Is there a deadline driving the sale (1031 exchange, divorce, estate, relocation)? That informs how much negotiation room exists.
- Schools are A-rated — typically a magnet for longer-tenancy family renters. What's the average tenant stay here, and is there a school-zone premium baked into asking?
- The area grade is low — what's the realistic commute time and amenity access for the typical tenant pool here? Any planned neighborhood developments (good or bad) we should know about?
- What's the average days-on-market for RENTAL listings here right now (not sales)? A rising rental-DOM trend means longer vacancies and softer asking-rent achievability than the comps imply.
- What's the recent tenant-quality profile in this submarket — average credit score on applications, eviction rate, late-payment / NSF rate, and stable-employment percentage? A property-management company in the area should have these aggregated.
- How much new for-sale + rental construction is in the pipeline within 1–3 miles? Heavy new supply typically softens prices + rents 12–24 months out; constrained supply supports both.
Investment metrics
- 1% rule
- 0.83% ✗
- Cap rate
- 5.14%
- Cash-on-cash
- -4.12%
- DSCR
- 0.82
- GRM
- 10.1
CMA / ARV
- ARV (median comp)
- $342,833
- List price
- $320,000
- Delta
- -3.77%
- Verdict
- FAIR
- Comps
- 20 within 1.0 mi
Show comp detail 7 sales within ~0.75 mi
| Address | Dist | Beds/Ba | Sqft | Sold | Price | $/sf | Match |
|---|---|---|---|---|---|---|---|
| 10815 S 178th St | 0.06mi | 4/2.0 | 1,497 (+0%) | 2mo | $319,500 | $213 | 95 |
| 10819 S 178th St | 0.07mi | 4/2.0 | 1,497 (+0%) | 9mo | $310,000 | $207 | 89 |
| 17712 Hampton Dr | 0.05mi | 4/2.0 | 1,497 (+0%) | 11mo | $322,000 | $215 | 88 |
| 17806 Hampton Dr | 0.09mi | 4/2.0 | 1,497 (+0%) | 23mo | $322,990 | $216 | 76 |
| 10802 S 178th St | 0.08mi | 3/2.5 (-1) | 1,442 (-3%) | 11mo | $336,000 | $233 | 74 |
| 17810 Hampton Dr | 0.10mi | 3/2.5 (-1) | 1,442 (-3%) | 24mo | $339,990 | $236 | 63 |
| 10113 S 181 St | 0.62mi | 3/2.5 (-1) | 1,698 (+14%) | 14mo | $508,000 | $299 | 29 |
Match score weights: distance 35% · size 25% · config 20% · recency 20%. Top-matched comps best support the ARV.
Projected returns pro-forma
-3.0% appreciation · 4.12% rent growth · sell at horizon
- IRR
- -21.8%
- Equity multiple
- 0.24×
- Total profit
- $-68,274
- Equity at exit
- $47,713
- IRR
- -12.9%
- Equity multiple
- 0.20×
- Total profit
- $-71,419
- Equity at exit
- $27,668
Cash invested: $89,600 (down + closing). Projections, not guarantees.
Landlord ↔ Tenant lean methodology
- Overall (STATE)
- 83 Strongly Landlord-Friendly
- State Nebraska
- 83 Strongly Landlord-Friendly · R+13
- County
- — inherits STATE
- City
- — inherits STATE
ZIP-level market 68136
- Home prices YoY
- -5.2%
- Rents YoY
- 4.1%
- Active inventory
- 255
- Price-to-rent
- 10.1×
Monthly cashflow live
- Estimated rent
- $2,640 medium interval (Pro) →
- Mortgage (P&I)
- −$1,678
- Tax from tax record
- −$582 /mo · $6,981/yr
- Insurance
- −$133
- HOA
- −$0
- Vacancy / Maint / Mgmt
- −$554
- Net cashflow
- $-307
Break-even live
Sensitivity live
| Price | -10% $-126 | -5% $-217 | +0% $-307 | +5% $-398 | +10% $-489 |
|---|---|---|---|---|---|
| Rent | -10% $-516 | -5% $-412 | +0% $-307 | +5% $-203 | +10% $-99 |
| Rate | -1.0pp $-146 | -0.5pp $-226 | base $-307 | +0.5pp $-390 | +1.0pp $-475 |
UW: 25.0% down · 7.5% · 30yr · 1.5% tax · 5.0% vac · 8.0% maint · 8.0% mgmt
Financing live
Cash to close
- Down payment
- $80,000
- Closing costs
- $9,600
- Reserves months
- —
- Total cash needed
- —
Loan-product check · same deal, 3 products live
Conventional
25% down · 7.5% · 30yr
- Down + closing
- —
- Monthly P&I
- —
- Monthly cashflow
- —
- DSCR
- —
- Eligible?
- —
Personal DTI + credit; lowest rate.
DSCR
20% down · 8.5% · 30yr
- Down + closing
- —
- Monthly P&I
- —
- Monthly cashflow
- —
- DSCR
- —
- Eligible?
- —
No personal income docs; deal must DSCR.
Hard money
10% down · 12.0% · 12mo
- Down + closing
- —
- Monthly P&I
- —
- Monthly cashflow
- —
- DSCR
- —
- Eligible?
- —
Short-term bridge; refi at stabilization.
Rent comps 4 comps
| Address | Beds | Baths | Sqft | Rent | $/sqft | DOM | Units | Dist |
|---|---|---|---|---|---|---|---|---|
| 10803 S 177th St Omaha, NE | 4.0 | 2.0 | 1493 | $2,980 | $2.00 | 25d | 1 | 0.04mi |
| 17801 Cypress Dr Omaha, NE | 1.0–3.0 | 1.0–2.0 | 922 | $2,039 | $2.21 | 4d | 12 | 0.11mi |
| 18689 Oakmont Dr Omaha, NE | 3.0 | 1.0–2.0 | 914 | $2,065 | $2.26 | 3d | 52 | 0.85mi |
| 16751 Morgan Ave Gretna, NE | 3.0 | 1.0–2.0 | 1172 | $2,608 | $2.22 | 4d | 14 | 0.91mi |
Listing history 15 events
-
2026-06-07statusdays on market $320,000 Pending 4 DOM
-
2026-06-03days on market $320,000 New 2 DOM
-
2026-06-02pricestatusdays on market $320,000 New 1 DOM
-
2026-06-01days on market $329,900 Active 17 DOM
-
2026-05-31days on market $329,900 Active 16 DOM
-
2026-05-15$329,900 New 799-char remark
-
2026-05-15historical
-
2026-03-20$339,900 New
-
2023-05-30soldstatus $324,990 Sold
-
2023-04-10status Pending
-
2023-04-06price $321,990
-
2023-02-28price $324,990
-
2023-02-25price $322,990
-
2023-02-20price $317,990
-
2023-01-18$314,990 New
ⓘ Source: listings_history table (triggers on properties + properties_extension) + one-shot
backfill from property_details.listing_events for pre-trigger history.
Tax reassessment forecast NE · Resets to sale price
- Current annual tax
- $6,981 · $582/mo
- Projected year-2 tax
- $6,981 · $582/mo
- Expected delta
- $0/yr ($0/mo · 0.0%)
ⓘ Screening estimate from a state-policy table — verify with the county assessor before closing.
Climate risk First Street
- Flood 1/10 Low FEMA zone X (unshaded) · 0% chance over 30 yrs
- Wildfire 1/10 Low
- Heat 3/10 Moderate 7 d/yr ≥103°F today · 16 d/yr by 30 yrs out
- Wind 2/10 Low
- Air quality 1/10 Low 0 unhealthy d/yr today · 0 by 30 yrs out
Nearby sold comps map
Loading sold comps map…
Walkable amenities ~0.75 mi
Loading nearby amenities…
Taxation est. · year 1
- Rental income
- $31,683
- − Mortgage interest
- −$17,925
- − Property taxes
- −$6,981
- − Insurance
- −$1,600
- − Repairs & maintenance
- −$2,535
- − Management
- −$2,535
- − Depreciation
- −$9,309
- Taxable loss
- −$9,202
- Est. tax savings @ 24.0%
- +$2,208
- After-tax cash flow
- $-1,481/yr
For passive investors: Depreciation is non-cash, so a rental often shows a tax loss while cash-flowing — sheltering income. Rental losses are passive: they offset passive income freely, and up to $25,000/yr can offset ordinary (W-2) income if you actively participate and your MAGI is under $100k (phasing out to $0 by $150k); unused losses carry forward. On sale, claimed depreciation is recaptured at up to 25%, and gains may owe capital-gains tax (a 1031 exchange can defer both). Figures are a year-1 estimate at your 24.0% rate — not tax advice; consult a CPA.
Condition & rehab AI · 12 photos
This move-in ready home in Tiburon Ridge North features a good condition with modern appliances and fresh paint. It offers a good investment opportunity with minor updates to enhance its curb appeal and value.
Value-add opportunities
- Both Painting exterior and interior walls — Fresh paint enhances curb appeal and interior aesthetics
- Both Landscaping improvements — Enhances curb appeal and adds value
- Both Replace window blinds — Improves home's curb appeal and functionality
Renovation cost estimate screening
Value-add ROI direction
- Both Painting exterior and interior walls — Fresh paint enhances curb appeal and interior aesthetics ↑
- Both Landscaping improvements — Enhances curb appeal and adds value ↑
- Both Replace window blinds — Improves home's curb appeal and functionality ↑
ⓘ Cost ranges are severity-bucket heuristics (US national rule-of-thumb). Get contractor quotes + a written scope before underwriting a rehab budget.
Schools (NCES district)
- District
- Gretna Public Schools
- NCES district ID
- 3171220
- Math proficiency
- 64% ▼ -10.00%
- Reading proficiency
- 64% ▼ -4.00%
- Median HH income
- $89,845
- Composite
- 58.21/100
- National rank
- #1023
- State rank
- #6 of 111 in NE
Livability — Gretna
- Score
- 82/100
- State rank
- #13
- US rank
- #1227
Category grades
Schools grade is shown separately in the Schools card above.
Census & demographics
- County
- Sarpy County · 161,202 people
- City population
- 17,529
- Metro
- Omaha-Council Bluffs, NE-IA
- Population (ZIP)
- 22,163
- Household income
- $133,472
- Rent vs Own
- Severe rent burden
- 166.0
Population outlook (Sarpy County) Hauer SSP2
- Today (2025)
- 211,769 people
- By 2030
- 229,365 · +8.3%
- By 2040
- 264,122 · +24.7%
- By 2050
- 298,087 · +40.8%
- By 2075
- 381,667 · +80.2%
- By 2100
- 448,180 · +111.6%
Race, ethnicity, and origin ACS 2023
- Neighborhood character
- Predominantly White (86%)
- Race & ethnicity
- White 86% Asian 6% Hispanic / Latino 5% Two or more races 3% Black 2%
- Common ancestry
- Romanian 5% Portuguese 2% Italian 2%
- Foreign-born
- 7% · Vietnam, Canada, China
- Languages at home
- 91% English-only · Vietnamese 3% Spanish 3% Other Asian/Pacific 2%
Political lean MEDSL · Sarpy
- 2024 margin
- R (+11.7) · D 43.5% · R 55.2% · Other 1.3%
- 2008→2024 swing
- +4.2pp toward D · 2008: -15.9pp · 2024: -11.7pp
- All cycles
- 2024: R+11.7 2020: R+11.2 2016: R+21.8 2012: R+23.6 2008: R+15.9
Not yet ingested
- Civics
- —
Market trends
- HPI YoY
- ▼ -12.33%
- Current HPI
- 226.8096
- Rent YoY
- ▲ 4.12%
- Metro
- Omaha-Council Bluffs, NE-IA
- State GDP YoY
- ▲ 0.68%
- F500 in state
- 2
Industry mix (Fortune 500 HQ in NE)
| Industry | F500 HQs | Revenue |
|---|---|---|
| Conglomerate | 1 | $371B |
|
||
Price history
+1.6% since first listed13 events — show timeline
- 2026-06-05 Pending — GPRMLS
- 2026-06-01 Listing Removed — GPRMLS
- 2026-06-01 Listed $320,000 GPRMLS
- 2026-05-15 Listing Removed — GPRMLS
- 2026-05-15 Listed $329,900 GPRMLS
- 2026-03-20 Listed $339,900 GPRMLS
- 2023-05-30 Sold (MLS) $324,990 GPRMLS
- 2023-04-10 Pending — GPRMLS
- 2023-04-06 Price Changed $321,990 GPRMLS
- 2023-02-28 Price Changed $324,990 GPRMLS
- 2023-02-25 Price Changed $322,990 GPRMLS
- 2023-02-20 Price Changed $317,990 GPRMLS
- 2023-01-18 Listed $314,990 GPRMLS
Property tax history
+83.3%/yrLatest (2025): $6,981 · -8.4% YoY. Source: county tax records.
Cash-flow waterfall
monthlySold comps — $/sqft
last 12 mo · ≤1 miLoading sold comps…