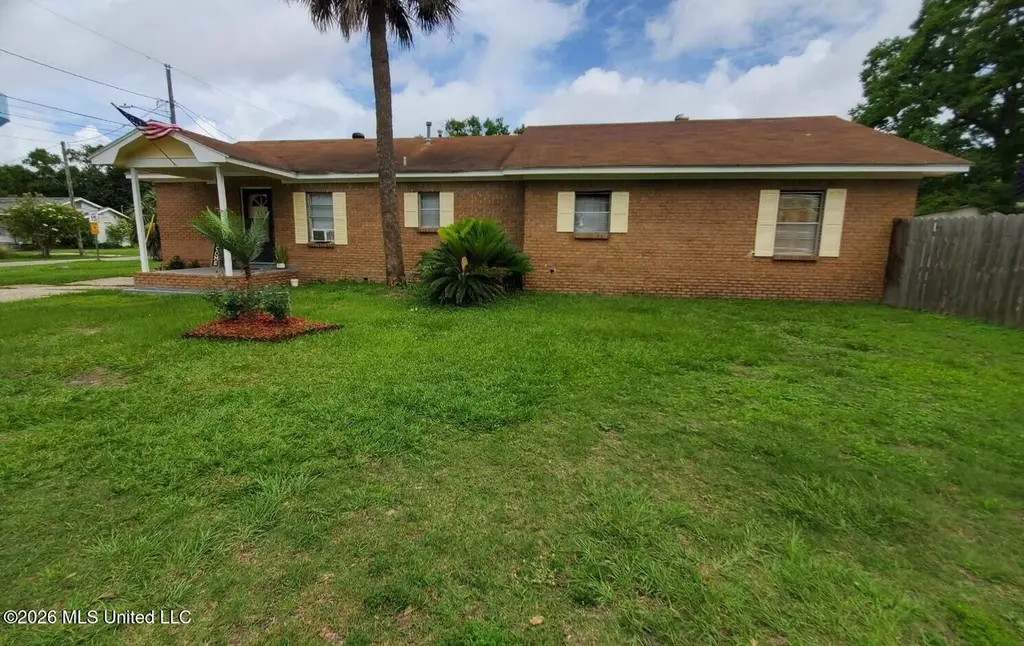
168 Dahlia St · Biloxi, MS
Flood risk 1/10 · Minimal
- FEMA flood zone
- X (shaded)
- Chance of flooding over 30 yrs
- 0.0%
- Est. flood insurance / yr
- $507 – $1,088
Fire risk 2/10 · Minimal
- Est. fire insurance / yr
- $1,241 – $2,305
Heat risk 10/10 · Severe
- Hot days now (above 105°F)
- 7 days/yr
- Hot days in 30 yrs
- 23 days/yr
Wind risk 9/10 · Severe
- Chance of severe wind over 30 yrs
- 99.0%
Air-quality risk 3/10 · Minor
- Unhealthy air days now
- 2 days/yr
- Unhealthy air days in 30 yrs
- 3 days/yr
Risk factors via First Street. Map © Google.
Why this score? — see what drove the B+ grade
The composite is a weighted blend of 9 inputs, each scored 0–100. Each bar is that input's sub-score; the figure is the points it added to the 100-point composite (weight × sub-score).
- Cash flow +30.0/30.0
- ARV discount +15.0/15.0
- DSCR +10.0/10.0
- 1% rule +8.6/10.0
- Schools +4.5/10.0
- Livability +4.0/5.0
- Rent growth +2.5/5.0
- Condition / age +2.5/5.0
- Appreciation +0.0/10.0
$145,000
🖨 Deal sheet 📄 Offer letter ✓ Due diligence
Listing remarks
Charming 3-bedroom, 1-bath brick home located in the heart of Biloxi! This single-story property features a spacious layout with an eat-in kitchen, tile flooring, updated countertops, and a covered front porch. The home offers central heat and air, natural gas, and a private driveway with ample parking. Situated on a level city lot with a large yard, this property is conveniently located near shopping, dining, schools, entertainment, and the Mississippi Gulf Coast beaches. Great opportunity for an owner-occupant or investor looking for a move-in ready property with strong rental potential.
Key facts
- Covered front porch
- Central heat and air
- Eat-in kitchen
Tags
Property features AI
Finance
- Other: Lot is a city, level, rectangular lot (approximately 0.17 acre)
Exterior
- Parking: 2 parking spaces; Driveway and on-site parking
- Utilities: Public water; Public sewer (connected); Electricity available; Natural gas available; Cable available
- Home design: Single-family residence (house); One story; Move-in ready
- Construction: Brick veneer exterior; Shingle roof; Slab foundation; Built (year from public records)
- Exterior features: Front porch; Brick patio/porch details; Private yard; Rain gutters
Interior
- Kitchen: Dishwasher; Free-standing gas range; Refrigerator; Eat-in layout
- Bedrooms: Includes at least one bedroom
- Flooring: Tile
- Bathrooms: 2 full bathrooms
- Heating & cooling: Central heating (forced air); Central air conditioning
- Interior features: Ceiling fans; Eat-in kitchen; Soaking tub; Total of 5 rooms
- Laundry & utility: Dryer
Neighborhood map
What this means for you Summary
Snapshot
- This is a 3-bed/1.0-bath single-family listed at $145k.
Deal economics
- At list price, monthly cash flow is $637 ($8k/yr) — positive.
- The deal already cash-flows at list — no discount required.
- Meets the 1% rule at list price ($2k rent vs $145k).
- Recommended offer: $143k (1.5% below list) — sets the bar for market timing.
- Cap rate 11.6% vs local median 3.5% in Biloxi — top-decile yield for the area; either an underpriced asset or a hidden risk that comps aren't pricing in. Stress-test before assuming the spread holds.
Location & tenants
- Location reads 79/100 on livability (#6 in MS, #2,141 nationally) — a middle-class / working-renter tenant base. Strengths: crime A+, cost of living A+, housing A+; Watch: commute D+, amenities F, employment D-.
- Biloxi Public School District (urban): math 60% / reading 48% proficiency, ranked #7 of 130 in MS (top 5%) — acceptable for families but not a draw, mixed tenant base, ~2y average lease.
- Zoned schools: Biloxi Junior High (math 60% / reading 43%, grade C, #27 of 179 statewide, top 16%, 881 students, 100% FRL); Biloxi High School (math 65% / reading 53%, grade C+, #7 of 197 statewide, top 3%, 1,728 students, 100% FRL) — zoned schools average 100% FRL vs 59% district-wide (40 pts higher); higher-poverty schools than district average — tighter screening recommended.
- Market conditions: Rents flat; 201 active listings in the ZIP; 16 comparable units currently listed for rent nearby; rentals at typical pace (median 21d on market — plan ~3-4 weeks tenant-placement turnaround); 2,194 units permitted in Harrison County in 2024 (0 in 5+ unit buildings).
- This rent runs 44% of the median local income ($54k/yr) — at the standard rent-burdened threshold; future hikes will face affordability resistance.
Forward outlook
- Local home prices are declining (-3.0%/yr); year-one equity from $1k of loan paydown is wiped out by about $4k of value loss. Plan a longer hold.
- Harrison County population projected at +27% by 2050 — long-run rental-demand tailwind backs the buy-and-hold thesis.
- At projected returns (-3.0% appreciation + 0.1% rent growth), your $41k cash investment doubles in ~9 years — after that, you're playing with house money.
Negotiation context
- It's been on market 17 days — a 2% lower offer ($143k) is reasonable based on typical stale-listing flexibility.
Risks & watch-outs
- Watch-outs: built in 1952 — expect roof / HVAC / electrical / plumbing capex.
- Climate carrying-cost: severe wind risk, 99% chance of damaging wind over 30y; extreme-heat days projected 7→23/yr by 2055 (HVAC capex compounding) — expect insurance premiums to compound above CPI over the hold.
Questions for the listing agent
- Built in 1952 — when were the roof, HVAC, electrical panel, plumbing, and water heater last replaced?
- Is there a deadline driving the sale (1031 exchange, divorce, estate, relocation)? That informs how much negotiation room exists.
- What's the average days-on-market for RENTAL listings here right now (not sales)? A rising rental-DOM trend means longer vacancies and softer asking-rent achievability than the comps imply.
- What's the recent tenant-quality profile in this submarket — average credit score on applications, eviction rate, late-payment / NSF rate, and stable-employment percentage? A property-management company in the area should have these aggregated.
- How much new for-sale + rental construction is in the pipeline within 1–3 miles? Heavy new supply typically softens prices + rents 12–24 months out; constrained supply supports both.
Investment metrics
- 1% rule
- 1.36% ✓
- Cap rate
- 11.56%
- Cash-on-cash
- 18.83%
- DSCR
- 1.84
- GRM
- 6.1
CMA / ARV
- ARV (on-the-fly)
- $188,032
- Comps found
- 6
Show comp detail 6 sales within ~0.75 mi
| Address | Dist | Beds/Ba | Sqft | Sold | Price | $/sf | Match |
|---|---|---|---|---|---|---|---|
| 333 Tanglewood Dr | 0.72mi | 3/2.0 | 1,688 (+1%) | 17mo | $169,900 | $101 | 46 |
| 313 Hiller Dr | 0.72mi | 4/1.5 (+1) | 1,576 (-5%) | 6mo | $178,000 | $113 | 45 |
| 2131 Dwayne Dr | 0.75mi | 3/1.5 | 1,745 (+5%) | 15mo | $224,900 | $129 | 43 |
| 335 Jim Money Rd | 0.65mi | 3/2.0 | 1,767 (+6%) | 16mo | $249,000 | $141 | 42 |
| 345 Jim Money Rd | 0.70mi | 3/1.0 | 1,724 (+4%) | 23mo | $165,000 | $96 | 42 |
| 2035 South Dr | 0.61mi | 2/2.0 (-1) | 1,570 (-6%) | 24mo | $159,000 | $101 | 33 |
Match score weights: distance 35% · size 25% · config 20% · recency 20%. Top-matched comps best support the ARV.
Projected returns pro-forma
-3.0% appreciation · 0.05% rent growth · sell at horizon
- IRR
- 7.4%
- Equity multiple
- 1.28×
- Total profit
- $11,367
- Equity at exit
- $21,620
- IRR
- 14.1%
- Equity multiple
- 1.99×
- Total profit
- $40,060
- Equity at exit
- $12,537
Cash invested: $40,600 (down + closing). Projections, not guarantees.
Landlord ↔ Tenant lean methodology
- Overall (STATE)
- 90 Strongly Landlord-Friendly
- State Mississippi
- 90 Strongly Landlord-Friendly · R+11
- County
- — inherits STATE
- City
- — inherits STATE
ZIP-level market 39531
- Home prices YoY
- -13.0%
- Rents YoY
- 0.1%
- Active inventory
- 201
- Price-to-rent
- 6.1×
Monthly cashflow live
- Estimated rent
- $1,972 high interval (Pro) →
- Mortgage (P&I)
- −$760
- Tax from tax record
- −$100 /mo · $1,202/yr
- Insurance
- −$60
- HOA
- −$0
- Vacancy / Maint / Mgmt
- −$414
- Net cashflow
- $637
Break-even live
UW: 25.0% down · 7.5% · 30yr · 1.5% tax · 5.0% vac · 8.0% maint · 8.0% mgmt
Financing live
Cash to close
- Down payment
- $36,250
- Closing costs
- $4,350
- Reserves months
- —
- Total cash needed
- —
Loan-product check · same deal, 3 products live
Conventional
25% down · 7.5% · 30yr
- Down + closing
- —
- Monthly P&I
- —
- Monthly cashflow
- —
- DSCR
- —
- Eligible?
- —
Personal DTI + credit; lowest rate.
DSCR
20% down · 8.5% · 30yr
- Down + closing
- —
- Monthly P&I
- —
- Monthly cashflow
- —
- DSCR
- —
- Eligible?
- —
No personal income docs; deal must DSCR.
Hard money
10% down · 12.0% · 12mo
- Down + closing
- —
- Monthly P&I
- —
- Monthly cashflow
- —
- DSCR
- —
- Eligible?
- —
Short-term bridge; refi at stabilization.
Rent comps 16 comps
| Address | Beds | Baths | Sqft | Rent | $/sqft | DOM | Units | Dist |
|---|---|---|---|---|---|---|---|---|
| 2046 Beach Blvd Biloxi, MS | 2.0 | 2.0 | 1152 | $2,200 | $1.91 | 21d | 1 | 0.13mi |
| 2060 Beach Blvd #604 Biloxi, MS | 2.0 | 2.0 | 1670 | $2,849 | $1.71 | 13d | 1 | 0.24mi |
| 310 Abbey Ct Biloxi, MS | 2.0–3.0 | 1.0–2.0 | 1062 | $1,275 | $1.20 | 21d | 17 | 0.60mi |
| 2611 Heidi LN Biloxi, MS | 3.0 | 2.5 | 1550 | $1,775 | $1.15 | 21d | 1 | 0.71mi |
| 340 Hiller Dr Biloxi, MS | 3.0 | 2.0 | 1447 | $1,749 | $1.21 | 21d | 1 | 0.74mi |
| 1805 Irish Hill Dr #4 Biloxi, MS | 3.0 | 2.0 | 1600 | $2,400 | $1.50 | 43d | 1 | 0.85mi |
| 2436 Beach Blvd Biloxi, MS | 3.0 | 2.0 | 1260 | $975 | $0.77 | 44d | 1 | 1.11mi |
| 2387 Trafalgar Dr Biloxi, MS | 3.0 | 2.0 | 1375 | $1,700 | $1.24 | 21d | 1 | 1.12mi |
| 1713 Stevens St Unit A Biloxi, MS | 3.0 | 2.0 | 1100 | $1,300 | $1.18 | 21d | 1 | 1.24mi |
| 390 Bertucci Blvd Biloxi, MS | 3.0 | 2.0 | 1358 | $1,800 | $1.33 | 43d | 1 | 1.28mi |
| 2386 Merlin Cv Biloxi, MS | 3.0 | 2.0 | 1500 | $1,600 | $1.07 | 13d | 1 | 1.32mi |
| 270 Rodenberg Ave Biloxi, MS | 3.0 | 2.0 | 1180 | $1,100 | $0.93 | 43d | 1 | 1.34mi |
| 1737 James Buchanan Dr Biloxi, MS | 3.0 | 2.0 | 1328 | $1,650 | $1.24 | 43d | 1 | 1.34mi |
| 258 Stennis Dr Biloxi, MS | 2.0 | 1.0–2.0 | 1040 | $1,245 | $1.20 | 13d | 1 | 1.37mi |
| 151 Grande View Dr Biloxi, MS | 1.0–3.0 | 1.0–2.0 | 1268 | $1,889 | $1.49 | 13d | 23 | 1.44mi |
| 187 Bilmarsan Dr Biloxi, MS | 3.0 | 2.0 | 1850 | $2,670 | $1.44 | 43d | 1 | 1.47mi |
Listing history 10 events
-
2026-06-09days on market $145,000 Active 17 DOM
-
2026-06-08days on market $145,000 Active 16 DOM
-
2026-06-07days on market $145,000 Active 15 DOM
-
2026-06-05days on market $145,000 Active 12 DOM
-
2026-06-03pricedays on market $145,000 Active 11 DOM
-
2026-06-02days on market $149,000 Active 10 DOM
-
2026-06-01days on market $149,000 Active 9 DOM
-
2026-05-31days on market $149,000 Active 8 DOM
-
2026-05-30days on market $149,000 Active 7 DOM
-
2026-05-23$149,000 Active
ⓘ Source: listings_history table (triggers on properties + properties_extension) + one-shot
backfill from property_details.listing_events for pre-trigger history.
Tax reassessment forecast MS · Resets to sale price
- Current annual tax
- $1,202 · $100/mo
- Projected year-2 tax
- $1,202 · $100/mo
- Expected delta
- $0/yr ($0/mo · 0.0%)
ⓘ Screening estimate from a state-policy table — verify with the county assessor before closing.
Climate risk First Street
- Flood 1/10 Low FEMA zone X (shaded) · 0% chance over 30 yrs
- Wildfire 2/10 Low
- Heat 10/10 Extreme 7 d/yr ≥105°F today · 23 d/yr by 30 yrs out
- Wind 9/10 Extreme 99% chance of damaging wind over 30 yrs
- Air quality 3/10 Moderate 2 unhealthy d/yr today · 3 by 30 yrs out
Nearby sold comps map
Loading sold comps map…
Walkable amenities ~0.75 mi
Loading nearby amenities…
Taxation est. · year 1
- Rental income
- $23,665
- − Mortgage interest
- −$8,122
- − Property taxes
- −$1,202
- − Insurance
- −$725
- − Repairs & maintenance
- −$1,893
- − Management
- −$1,893
- − Depreciation
- −$4,218
- Taxable income
- $5,611
- Est. tax owed @ 24.0%
- −$1,347
- After-tax cash flow
- $6,297/yr
For passive investors: Depreciation is non-cash, so a rental often shows a tax loss while cash-flowing — sheltering income. Rental losses are passive: they offset passive income freely, and up to $25,000/yr can offset ordinary (W-2) income if you actively participate and your MAGI is under $100k (phasing out to $0 by $150k); unused losses carry forward. On sale, claimed depreciation is recaptured at up to 25%, and gains may owe capital-gains tax (a 1031 exchange can defer both). Figures are a year-1 estimate at your 24.0% rate — not tax advice; consult a CPA.
Schools (NCES district)
- District
- Biloxi Public School District
- NCES district ID
- 2800630
- Math proficiency
- 60% ▼ -7.00%
- Reading proficiency
- 48% ▼ -3.00%
- Median HH income
- $40,608
- Composite
- 45.26/100
- National rank
- #2657
- State rank
- #7 of 130 in MS
Livability — Biloxi
- Score
- 79/100
- State rank
- #6
- US rank
- #2141
Category grades
Schools grade is shown separately in the Schools card above.
Census & demographics
- Census place
- Biloxi, MS
- County
- Harrison County · 178,171 people
- City population
- 63,281
- Metro
- Gulfport-Biloxi, MS
- Population (ZIP)
- 18,918
- Household income
- $54,218
- Rent vs Own
- Severe rent burden
- 1110.0
Population outlook (Harrison County) Hauer SSP2
- Today (2025)
- 228,444 people
- By 2030
- 241,942 · +5.9%
- By 2040
- 267,531 · +17.1%
- By 2050
- 291,062 · +27.4%
- By 2075
- 346,711 · +51.8%
- By 2100
- 378,165 · +65.5%
Race, ethnicity, and origin ACS 2023
- Neighborhood character
- Diverse neighborhood (Simpson 0.60)
- Race & ethnicity
- White 60% Black 18% Two or more races 12% Hispanic / Latino 11% Asian 2%
- Hispanic origin (detail)
- Mexican 5%
- Common ancestry
- Lithuanian 6% Slovak 2% Serbian 1%
- Foreign-born
- 8% · Canada, Vietnam
- Languages at home
- 89% English-only · Spanish 6% Arabic 1% Other Indo-European 1%
Political lean MEDSL · Harrison
- 2024 margin
- Strong R (+28.9) · D 35.0% · R 63.9% · Other 1.1%
- 2008→2024 swing
- -2.9pp toward R · 2008: -26.0pp · 2024: -28.9pp
- All cycles
- 2024: R+28.9 2020: R+25.2 2016: R+30.7 2012: R+26.6 2008: R+26.0
Not yet ingested
- Civics
- —
Market trends
- HPI YoY
- ▼ -28.97%
- Current HPI
- 193.4018
- Rent YoY
- ▬ 0.05%
- Metro
- Gulfport-Biloxi, MS
- State GDP YoY
- —
- F500 in state
- 0
Price history
1 event — show timeline
- 2026-05-23 Listed $149,000 MLSU
Property tax history
+10.1%/yrLatest (2025): $1,202 · +5.3% YoY. Source: county tax records.
Cash-flow waterfall
monthlySold comps — $/sqft
last 12 mo · ≤1 miLoading sold comps…