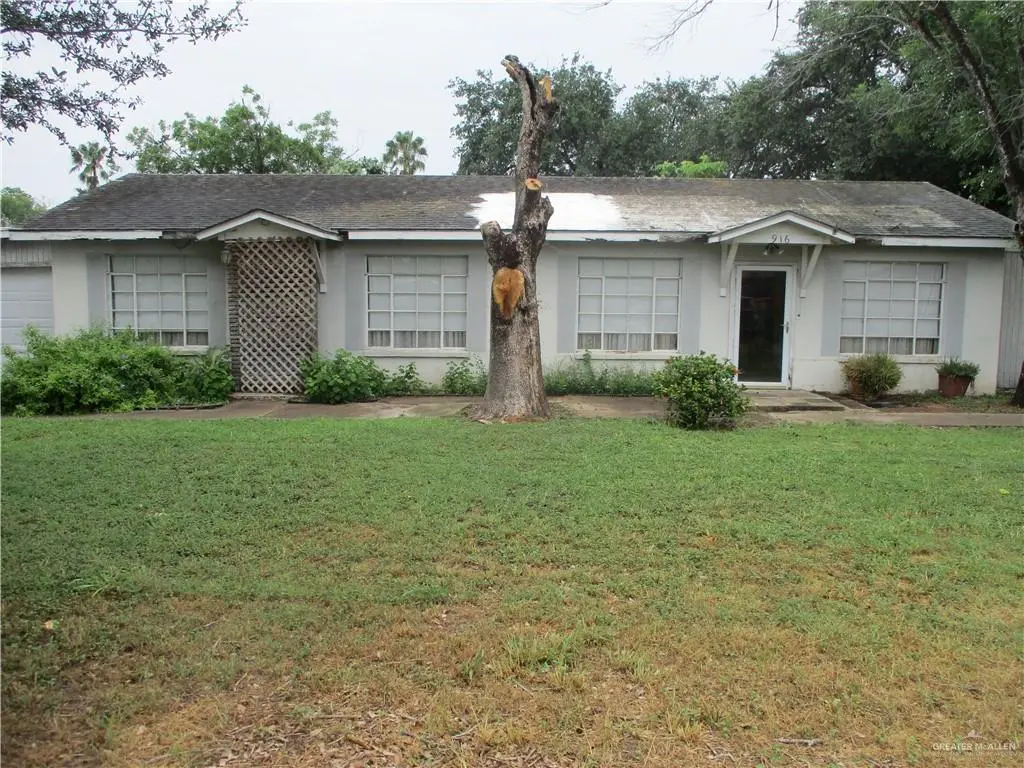
916 S 6th Ave · Edinburg, TX
Flood risk 1/10 · Minimal
- FEMA flood zone
- X
- Chance of flooding over 30 yrs
- 0.0%
- Est. flood insurance / yr
- $507 – $1,088
Fire risk 1/10 · Minimal
- Est. fire insurance / yr
- $1,222 – $2,270
Heat risk 9/10 · Severe
- Hot days now (above 111°F)
- 7 days/yr
- Hot days in 30 yrs
- 22 days/yr
Wind risk 8/10 · Major
- Chance of severe wind over 30 yrs
- 99.0%
Air-quality risk 2/10 · Minimal
- Unhealthy air days now
- 0 days/yr
- Unhealthy air days in 30 yrs
- 1 days/yr
Risk factors via First Street. Map © Google.
Why this score? — see what drove the D- grade
The composite is a weighted blend of 9 inputs, each scored 0–100. Each bar is that input's sub-score; the figure is the points it added to the 100-point composite (weight × sub-score).
- ARV discount +14.7/15.0
- Cash flow +6.8/30.0
- Livability +3.2/5.0
- 1% rule +3.0/10.0
- Condition / age +2.5/5.0
- Rent growth +2.4/5.0
- Schools +2.2/10.0
- DSCR +1.1/10.0
- Appreciation +0.0/10.0
$159,500
🖨 Deal sheet (PDF) 📄 Offer letter ✓ Due diligence
Listing remarks
House sits on two lots selling as is. Needs roof and many other repairs. Perfect for someone who wants to remodel an older home. Centrally located close to schools and UTRGV. Large backyard with a shed. This is an estate sale and is being sold as is because of the amount of updates that it needs.
Key facts
- Two lots
- Close to schools
- Shed
Tags
Property features AI
Finance
- Other: Lot approximately 12,702 sq. ft. (0.2916 acre)
- HOA & community: No homeowners association
Exterior
- Parking: Attached garage facing front; 2 covered parking spaces (2 garage spaces total)
- Security: Smoke detector(s)
- Utilities: Public water; City sewer; Cable available; Electric service
- Home design: Block and stucco construction; Composition shingle and metal roof; Slab foundation
- Construction: Block construction with stucco finish; Composition shingle and metal roof; Slab foundation
- Exterior features: Mature trees; Workshop; Alley access; Paved road
Interior
- Kitchen: Smooth electric cooktop; Electric water heater
- Flooring: Carpet; Tile
- Bathrooms: 2 full bathrooms
- Heating & cooling: Central heating (electric); Central air (electric)
- Interior features: Laminate countertops; Ceiling fan(s); Office/Study; No window coverings
- Laundry & utility: Laundry area with washer/dryer connections
Neighborhood map
What this means for you Summary
Snapshot
- This is a 3-bed/2.0-bath single-family listed at $160k.
Deal economics
- At list price, monthly cash flow is $-245 ($-3k/yr) — negative.
- To cash-flow at today's rent, offer at most $116k (27.1% below list).
- To meet the 1% rule (rent ≥ 1% of price), the offer needs to be $128k (20.0% below list).
- Recommended offer: $116k (27.1% below list) — sets the bar for cash-flow.
- Cap rate 4.4% vs local median 2.4% in Edinburg — top-decile yield for the area; either an underpriced asset or a hidden risk that comps aren't pricing in. Stress-test before assuming the spread holds.
Location & tenants
- Location reads 64/100 on livability (#784 in TX) — a middle-class / working-renter tenant base. Strengths: cost of living A+, housing A+; Watch: employment D, amenities F, commute F.
- Edinburg CISD (urban): math 20% / reading 34% proficiency, ranked #699 of 826 in TX (top 85%) — low school quality limits family demand, transient renter base, plan for 1-2y turnover; 62% free/reduced lunch — lower-income household profile, screen leases tightly.
- Zoned schools: Lee El (math 27% / reading 32%, grade F, #2,525 of 4,322 statewide, top 62%, 449 students, 96% FRL); South Middle (math 23% / reading 46%, grade F, #858 of 1,662 statewide, top 54%, 1,309 students, 66% FRL); Robert R Vela H S (math 27% / reading 48%, grade F, #888 of 1,632 statewide, top 55%, 2,189 students, 62% FRL).
- Market conditions: Rents soft (-0.5%/yr); 411 active listings in the ZIP; 28 comparable units currently listed for rent nearby; rentals lingering (median 46d on market — plan ~5-8 weeks vacancy on turnover, expect pricing pressure); 71% of comp listings sitting > 30 days — soft ceiling on asking rent; 7,378 units permitted in Hidalgo County in 2024 (641 in 5+ unit buildings).
Forward outlook
- Local home prices are declining (-3.0%/yr); year-one equity from $1k of loan paydown is wiped out by about $5k of value loss. Plan a longer hold.
- Hidalgo County population projected at +28% by 2050 — long-run rental-demand tailwind backs the buy-and-hold thesis.
Negotiation context
- Only 3 days on market — expect competitive offers; lowballing is unlikely to land.
Risks & watch-outs
- Watch-outs: property tax is 2.6% of price.
- Climate carrying-cost: severe wind risk, 99% chance of damaging wind over 30y; extreme-heat days projected 7→22/yr by 2055 (HVAC capex compounding) — expect insurance premiums to compound above CPI over the hold.
Questions for the listing agent
- What do current leases actually rent for vs. the listed asking? Can we see a recent rent roll and the last 12 months of T-12 income?
- Property tax is high relative to price — has the assessment been appealed recently, and will the sale trigger a re-assessment?
- Is there a deadline driving the sale (1031 exchange, divorce, estate, relocation)? That informs how much negotiation room exists.
- Schools are D-rated, which usually means shorter tenancies and higher turnover. Who's the typical renter profile here, and what's been the actual vacancy rate?
- The area grade is low — what's the realistic commute time and amenity access for the typical tenant pool here? Any planned neighborhood developments (good or bad) we should know about?
- What's the average days-on-market for RENTAL listings here right now (not sales)? A rising rental-DOM trend means longer vacancies and softer asking-rent achievability than the comps imply.
- What's the recent tenant-quality profile in this submarket — average credit score on applications, eviction rate, late-payment / NSF rate, and stable-employment percentage? A property-management company in the area should have these aggregated.
- How much new for-sale + rental construction is in the pipeline within 1–3 miles? Heavy new supply typically softens prices + rents 12–24 months out; constrained supply supports both.
Investment metrics
- 1% rule
- 0.80% ✗
- Cap rate
- 4.45%
- Cash-on-cash
- -6.58%
- DSCR
- 0.71
- GRM
- 10.4
CMA / ARV
- ARV (on-the-fly)
- $189,952
- Comps found
- 12
Show comp detail 12 sales within ~0.75 mi
| Address | Dist | Beds/Ba | Sqft | Sold | Price | $/sf | Match |
|---|---|---|---|---|---|---|---|
| 916 S 8th Ave | 0.14mi | 2/2.0 (-1) | 1,634 (-4%) | 7mo | $149,500 | $91 | 76 |
| 1100 S 2nd Ave | 0.29mi | 3/2.0 | 1,656 (-2%) | 8mo | $175,000 | $106 | 76 |
| 808 S 2nd Ave | 0.28mi | 3/2.0 | 1,591 (-6%) | 4mo | $199,900 | $126 | 73 |
| 1501 Cynthia St | 0.49mi | 3/2.0 | 1,774 (+5%) | 2mo | $150,000 | $85 | 68 |
| 902 Hidden Forest Dr | 0.43mi | 3/2.0 | 1,764 (+4%) | 8mo | $240,000 | $136 | 66 |
| 505 W Samano St | 0.18mi | 3/2.0 | 1,509 (-11%) | 12mo | $174,000 | $115 | 63 |
| 418 W Samano St | 0.17mi | 4/2.0 (+1) | 1,535 (-10%) | 11mo | $155,000 | $101 | 62 |
| 318 E Samano St | 0.54mi | 3/2.5 | 1,787 (+5%) | 4mo | $155,000 | $87 | 60 |
| 1514 S 13th Ave | 0.64mi | 3/2.0 | 1,659 (-2%) | 9mo | $179,000 | $108 | 59 |
| 1008 S 3rd St | 0.25mi | 4/2.0 (+1) | 1,470 (-13%) | 6mo | $164,800 | $112 | 56 |
| 1015 Fairway Dr | 0.55mi | 3/2.0 | 1,828 (+8%) | 11mo | $312,000 | $171 | 52 |
| 922 S 12th Ave | 0.43mi | 3/2.0 | 1,480 (-13%) | 9mo | $184,999 | $125 | 51 |
Match score weights: distance 35% · size 25% · config 20% · recency 20%. Top-matched comps best support the ARV.
Projected returns pro-forma
-3.0% appreciation · 0.0% rent growth · sell at horizon
- IRR
- -31.6%
- Equity multiple
- -0.01×
- Total profit
- $-45,080
- Equity at exit
- $23,782
- IRR
- -60.7%
- Equity multiple
- -0.64×
- Total profit
- $-73,348
- Equity at exit
- $13,791
Cash invested: $44,660 (down + closing). Projections, not guarantees.
Landlord ↔ Tenant lean methodology
- Overall (STATE)
- 87 Strongly Landlord-Friendly
- State Texas
- 87 Strongly Landlord-Friendly · R+5
- County
- — inherits STATE
- City
- — inherits STATE
ZIP-level market 78539
- Home prices YoY
- -19.6%
- Rents YoY
- -0.5%
- Active inventory
- 411
- Price-to-rent
- 10.4×
Monthly cashflow live
- Estimated rent
- $1,276 high interval (Pro) →
- Mortgage (P&I)
- −$836
- Tax from tax record
- −$350 /mo · $4,204/yr
- Insurance
- −$66
- HOA
- −$0
- Vacancy / Maint / Mgmt
- −$268
- Net cashflow
- $-245
Break-even live
Sensitivity live
| Price | -10% $-155 | -5% $-200 | +0% $-245 | +5% $-290 | +10% $-335 |
|---|---|---|---|---|---|
| Rent | -10% $-346 | -5% $-295 | +0% $-245 | +5% $-195 | +10% $-144 |
| Rate | -1.0pp $-165 | -0.5pp $-204 | base $-245 | +0.5pp $-286 | +1.0pp $-328 |
UW: 25.0% down · 7.5% · 30yr · 1.5% tax · 5.0% vac · 8.0% maint · 8.0% mgmt
Financing live
Cash to close
- Down payment
- $39,875
- Closing costs
- $4,785
- Reserves months
- —
- Total cash needed
- —
Loan-product check · same deal, 3 products live
Conventional
25% down · 7.5% · 30yr
- Down + closing
- —
- Monthly P&I
- —
- Monthly cashflow
- —
- DSCR
- —
- Eligible?
- —
Personal DTI + credit; lowest rate.
DSCR
20% down · 8.5% · 30yr
- Down + closing
- —
- Monthly P&I
- —
- Monthly cashflow
- —
- DSCR
- —
- Eligible?
- —
No personal income docs; deal must DSCR.
Hard money
10% down · 12.0% · 12mo
- Down + closing
- —
- Monthly P&I
- —
- Monthly cashflow
- —
- DSCR
- —
- Eligible?
- —
Short-term bridge; refi at stabilization.
Rent comps 28 comps
| Address | Beds | Baths | Sqft | Rent | $/sqft | DOM | Units | Dist |
|---|---|---|---|---|---|---|---|---|
| 902 Hidden Forest Dr Edinburg, TX | 3.0 | 2.0 | 1764 | $1,800 | $1.02 | 45d | 1 | 0.45mi |
| 2314 W Stubbs St Unit A Edinburg, TX | 2.0 | 2.0 | 1069 | $875 | $0.82 | 45d | 1 | 0.56mi |
| 1415 W Freddy Gonzalez Dr Edinburg, TX | 1.0–3.0 | 1.0–2.0 | 806 | $975 | $1.21 | 25d | 1 | 0.60mi |
| 1802 W Samano St Edinburg, TX | 1.0–3.0 | 1.0–2.0 | 828 | $975 | $1.18 | 45d | 1 | 0.88mi |
| 811 S 19th Ave Edinburg, TX | 3.0 | 2.0 | 1102 | $1,500 | $1.36 | 45d | 1 | 0.88mi |
| 1005 Saltillo St Edinburg, TX | 4.0 | 1.0 | 1368 | $1,400 | $1.02 | 25d | 1 | 0.89mi |
| 2218 S Tourist Dr Unit J Edinburg, TX | 2.0 | 2.5 | 1172 | $850 | $0.73 | 23d | 1 | 0.92mi |
| 1521 W McIntyre St Unit 4 Edinburg, TX | 3.0 | 2.0 | 1300 | $1,095 | $0.84 | 25d | 1 | 0.98mi |
| 2316 Pin Oak Rd Edinburg, TX | 4.0 | 2.0 | 1769 | $1,700 | $0.96 | 45d | 1 | 1.05mi |
| 206 N Montevideo Ave Unit 7 Edinburg, TX | 2.0 | 1.5 | 1153 | $800 | $0.69 | 45d | 1 | 1.07mi |
| 2012 Pin Oak Rd Edinburg, TX | 3.0 | 2.0 | 1300 | $1,600 | $1.23 | 45d | 1 | 1.08mi |
| 2501 Camino Real Viejo Mercedes, TX | 4.0 | 2.0 | 2048 | $1,400 | $0.68 | 45d | 1 | 1.11mi |
| 1902 Charles Cir Edinburg, TX | 2.0 | 1.0 | 1097 | $980 | $0.89 | 45d | 1 | 1.13mi |
| 420 W Chavez St Unit 4 Edinburg, TX | 3.0 | 2.0 | 1100 | $1,250 | $1.14 | 45d | 1 | 1.17mi |
| 2714 Blue Ridge Dr Edinburg, TX | 3.0 | 2.0 | 1966 | $1,750 | $0.89 | 16d | 1 | 1.18mi |
| 604 E Schunior St Edinburg, TX | 3.0 | 2.0 | 1100 | $1,150 | $1.05 | 45d | 1 | 1.24mi |
| 905 N Sugar Rd Edinburg, TX | 2.0 | 2.0 | 1050 | $895 | $0.85 | 45d | 1 | 1.34mi |
| 204 Teak Dr Unit 3 Edinburg, TX | 2.0 | 2.0 | 1050 | $1,000 | $0.95 | 45d | 1 | 1.36mi |
| 204 Teak Dr Unit 1 Edinburg, TX | 2.0 | 2.0 | 1050 | $900 | $0.86 | 25d | 1 | 1.36mi |
| 106 Teak Dr Unit 4 Edinburg, TX | 2.0 | 2.0 | 1100 | $1,100 | $1.00 | 16d | 1 | 1.38mi |
| 106 Teak Dr Unit 3 Edinburg, TX | 2.0 | 2.0 | 1100 | $1,100 | $1.00 | 45d | 1 | 1.38mi |
| 1211 White Oak Dr Unit 4 Edinburg, TX | 3.0 | 2.0 | 1150 | $1,050 | $0.91 | 25d | 1 | 1.40mi |
| 1211 White Oak Dr Unit 3 Edinburg, TX | 2.0 | 2.0 | 1050 | $1,050 | $1.00 | 45d | 1 | 1.40mi |
| 1212 White Oak Dr Unit 2 Edinburg, TX | 3.0 | 2.0 | 1250 | $1,100 | $0.88 | 45d | 1 | 1.41mi |
| 1210 Upas Dr Unit 3 Edinburg, TX | 3.0 | 2.0 | 1130 | $1,150 | $1.02 | 45d | 1 | 1.43mi |
| 3118 Vera Ave Edinburg, TX | 3.0 | 2.0 | 1553 | $1,800 | $1.16 | 45d | 1 | 1.44mi |
| 303 Baltic Ave #4 Edinburg, TX | 2.0 | 2.0 | 1280 | $925 | $0.72 | 45d | 1 | 1.45mi |
| 1221 Upas Dr Unit 3 Edinburg, TX | 3.0 | 3.0 | 1300 | $1,300 | $1.00 | 45d | 1 | 1.47mi |
Listing history 3 events
-
2026-06-21days on market $159,500 Active 3 DOM
-
2026-06-18remarks 297-char remark
-
2026-06-18$159,500 Active 1 DOM
ⓘ Source: listings_history table (triggers on properties + properties_extension) + one-shot
backfill from property_details.listing_events for pre-trigger history.
Tax reassessment forecast TX · Resets to sale price
- Current annual tax
- $4,204 · $350/mo
- Projected year-2 tax
- $4,204 · $350/mo
- Expected delta
- $0/yr ($0/mo · 0.0%)
ⓘ Screening estimate from a state-policy table — verify with the county assessor before closing.
Climate risk First Street
- Flood 1/10 Low FEMA zone X · 0% chance over 30 yrs
- Wildfire 1/10 Low
- Heat 9/10 Extreme 7 d/yr ≥111°F today · 22 d/yr by 30 yrs out
- Wind 8/10 Severe 99% chance of damaging wind over 30 yrs
- Air quality 2/10 Low 0 unhealthy d/yr today · 1 by 30 yrs out
Nearby sold comps map
Loading sold comps map…
Walkable amenities ~0.75 mi
Loading nearby amenities…
Taxation est. · year 1
- Rental income
- $15,314
- − Mortgage interest
- −$8,934
- − Property taxes
- −$4,204
- − Insurance
- −$798
- − Repairs & maintenance
- −$1,225
- − Management
- −$1,225
- − Depreciation
- −$4,640
- Taxable loss
- −$5,712
- Est. tax savings @ 24.0%
- +$1,371
- After-tax cash flow
- $-1,570/yr
For passive investors: Depreciation is non-cash, so a rental often shows a tax loss while cash-flowing — sheltering income. Rental losses are passive: they offset passive income freely, and up to $25,000/yr can offset ordinary (W-2) income if you actively participate and your MAGI is under $100k (phasing out to $0 by $150k); unused losses carry forward. On sale, claimed depreciation is recaptured at up to 25%, and gains may owe capital-gains tax (a 1031 exchange can defer both). Figures are a year-1 estimate at your 24.0% rate — not tax advice; consult a CPA.
Schools (NCES district)
- District
- Edinburg CISD
- NCES district ID
- 4818180
- Math proficiency
- 20% ▼ -34.00%
- Reading proficiency
- 34% ▼ -11.00%
- Median HH income
- $36,985
- Composite
- 22.42/100
- National rank
- #8114
- State rank
- #699 of 826 in TX
Livability — Edinburg
- Score
- 64/100
- State rank
- #784
- US rank
- #14319
Category grades
Schools grade is shown separately in the Schools card above.
Census & demographics
- Census place
- Edinburg, TX
- County
- Hidalgo County · 623,128 people
- City population
- 178,279
- Metro
- McAllen-Edinburg-Mission, TX
- Population (ZIP)
- 37,168
- Household income
- $66,967
- Rent vs Own
- Severe rent burden
- 1525.0
Population outlook (Hidalgo County) Hauer SSP2
- Today (2025)
- 955,232 people
- By 2030
- 1,009,774 · +5.7%
- By 2040
- 1,120,332 · +17.3%
- By 2050
- 1,225,036 · +28.2%
- By 2075
- 1,439,189 · +50.7%
- By 2100
- 1,533,429 · +60.5%
Race, ethnicity, and origin ACS 2023
- Neighborhood character
- Predominantly Hispanic (85%)
- Race & ethnicity
- Hispanic / Latino 85% Two or more races 45% White 10% Asian 4%
- Hispanic origin (detail)
- Mexican 77% Puerto Rican 1%
- Common ancestry
- Lithuanian 1% Italian 1% Romanian 1%
- Foreign-born
- 19% · Canada
- Languages at home
- 32% English-only · Spanish 64% Tagalog/Filipino 2% Other Asian/Pacific 1%
Political lean MEDSL · Hidalgo
- 2024 margin
- Toss-up / Even · D 48.1% · R 51.0%
- 2008→2024 swing
- -41.6pp toward R · 2008: 38.7pp · 2024: -2.9pp
- All cycles
- 2024: R+2.9 2020: D+17.1 2016: D+40.5 2012: D+41.8 2008: D+38.7
Not yet ingested
- Civics
- —
Market trends
- HPI YoY
- ▼ -51.52%
- Current HPI
- 211.4723
- Rent YoY
- ▼ -0.52%
- Metro
- McAllen-Edinburg-Mission, TX
- State GDP YoY
- ▲ 3.95%
- F500 in state
- 110
Industry mix (Fortune 500 HQ in TX)
| Industry | F500 HQs | Revenue |
|---|---|---|
| Energy | 16 | $1,198B |
|
||
| Technology | 5 | $198B |
|
||
| Engineering / Construction | 4 | $72B |
|
||
| Energy Services | 3 | $60B |
|
||
| Utilities | 3 | $41B |
|
||
| Healthcare | 2 | $330B |
|
||
Price history
2 events — show timeline
- 2026-06-18 Listed $159,500 MCALLENMLS
- 2026-04-17 Sold (Public Records) — Public Records
Property tax history
+5.2%/yrLatest (2025): $4,204 · +19.5% YoY. Source: county tax records.
Cash-flow waterfall
monthlySold comps — $/sqft
last 12 mo · ≤1 miLoading sold comps…