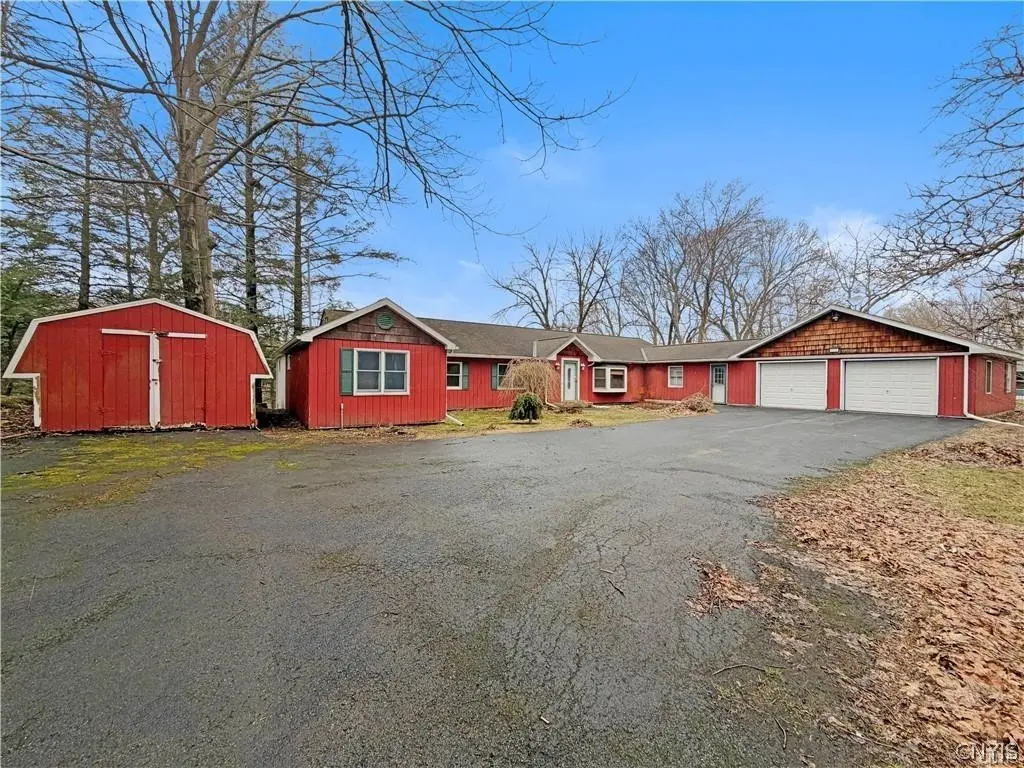
3247 County Route 57 · Minetto, NY
Flood risk 1/10 · Minimal
- FEMA flood zone
- X (unshaded)
- Chance of flooding over 30 yrs
- 0.0%
- Est. flood insurance / yr
- $473 – $860
Fire risk 1/10 · Minimal
- Est. fire insurance / yr
- $691 – $1,283
Heat risk 2/10 · Minimal
- Hot days now (above 94°F)
- 7 days/yr
- Hot days in 30 yrs
- 16 days/yr
Wind risk 1/10 · Minimal
- Chance of severe wind over 30 yrs
- 1.0%
Air-quality risk 2/10 · Minimal
- Unhealthy air days now
- 1 days/yr
- Unhealthy air days in 30 yrs
- 1 days/yr
Risk factors via First Street. Map © Google.
Why this score? — see what drove the C grade
The composite is a weighted blend of 9 inputs, each scored 0–100. Each bar is that input's sub-score; the figure is the points it added to the 100-point composite (weight × sub-score).
- Cash flow +15.1/30.0
- ARV discount +15.0/15.0
- 1% rule +5.4/10.0
- Rent growth +5.0/5.0
- DSCR +4.6/10.0
- Appreciation +3.9/10.0
- Livability +3.4/5.0
- Schools +3.0/10.0
- Condition / age +2.5/5.0
$194,849
🖨 Deal sheet 📄 Offer letter ✓ Due diligence
Listing remarks
This property offers an incredible opportunity for investors or buyers looking to build equity. Featuring over 2,000 square feet of living space, this home includes 4 spacious bedrooms and 2.5 bathrooms, providing a solid foundation for renovation or customization. Situated on a generous 1.19-acre lot along the scenic Oswego River, the property offers both privacy and picturesque natural surroundings. This home features 130 feet of water frontage on the Oswego River. Whether you re looking for your next investment project or a property to transform into your dream home, this one is full of possibilities. Being sold as-is bring your vision and make it your own.
Key facts
- Water frontage
- 1.19-acre lot
- Oswego river
Tags
Property features AI
Exterior
- Parking: Attached 2-car garage
- Utilities: Well water; Septic tank
- Home design: Single-story home; Existing construction; Wood siding; Rectangular rural lot
- Construction: Block foundation; Built as existing (year built details: existing)
- Exterior features: Blacktop driveway; River access to the Oswego River; Stream frontage
Interior
- Kitchen: Dishwasher
- Bedrooms: Four main-level bedrooms
- Flooring: Carpet; Ceramic tile; Hardwood; Tile; Varies
- Bathrooms: Two full bathrooms; One half bathroom; Two main-level bathrooms
- Heating & cooling: Oil forced-air heating
- Interior features: Formal dining room; Eat-in kitchen; Formal living room; Bedroom on main level; Full, partially finished basement; One fireplace
- Laundry & utility: Electric water heater
Neighborhood map
What this means for you Summary
Snapshot
- This is a 4-bed/2.0-bath single-family listed at $195k.
Deal economics
- At list price, monthly cash flow is $63 ($753/yr) — positive.
- The deal already cash-flows at list — no discount required.
- Meets the 1% rule at list price ($2k rent vs $195k).
- Cap rate 6.7% vs local median 4.4% in Minetto — top-decile yield for the area; either an underpriced asset or a hidden risk that comps aren't pricing in. Stress-test before assuming the spread holds.
Location & tenants
- Location reads 68/100 on livability (#554 in NY) — a middle-class / working-renter tenant base. Strengths: housing A+, crime A, cost of living A; Watch: schools D+, amenities F, commute F.
- Fulton City School District (town): math 29% / reading 43% proficiency, ranked #554 of 590 in NY (top 94%) — families likely to look elsewhere, expect single-tenant / working-renter base with shorter leases.
- Market conditions: Rents rising fast (+19.2%/yr); 168 active listings in the ZIP; 172 units permitted in Oswego County in 2024 (27 in 5+ unit buildings).
- This rent runs 37% of the median local income ($65k/yr) — at the standard rent-burdened threshold; future hikes will face affordability resistance.
Forward outlook
- Local home prices are declining (-2.2%/yr); year-one equity from $1k of loan paydown is wiped out by about $4k of value loss. Plan a longer hold.
- Oswego County population projected at -23% by 2050 — secular population decline; favor cash flow + early exit over multi-decade hold.
- At projected returns (-2.2% appreciation + 8.0% rent growth), your $55k cash investment doubles in ~10 years — after that, you're playing with house money.
Negotiation context
- Only 1 days on market — expect competitive offers; lowballing is unlikely to land.
- 4 sale attempts since 13y ago with the ask held roughly flat each time — persistent listings suggest the price (not the market) is what's stuck; bring a comps-based counter.
Risks & watch-outs
- Watch-outs: property tax is 2.6% of price.
Questions for the listing agent
- Built in 1960 — when were the roof, HVAC, electrical panel, plumbing, and water heater last replaced?
- Property tax is high relative to price — has the assessment been appealed recently, and will the sale trigger a re-assessment?
- Is there a deadline driving the sale (1031 exchange, divorce, estate, relocation)? That informs how much negotiation room exists.
- Schools are D-rated, which usually means shorter tenancies and higher turnover. Who's the typical renter profile here, and what's been the actual vacancy rate?
- What's the average days-on-market for RENTAL listings here right now (not sales)? A rising rental-DOM trend means longer vacancies and softer asking-rent achievability than the comps imply.
- What's the recent tenant-quality profile in this submarket — average credit score on applications, eviction rate, late-payment / NSF rate, and stable-employment percentage? A property-management company in the area should have these aggregated.
- How much new for-sale + rental construction is in the pipeline within 1–3 miles? Heavy new supply typically softens prices + rents 12–24 months out; constrained supply supports both.
Investment metrics
- 1% rule
- 1.04% ✓
- Cap rate
- 6.68%
- Cash-on-cash
- 1.38%
- DSCR
- 1.06
- GRM
- 8.0
CMA / ARV
- ARV (median comp)
- $318,000
- List price
- $194,849
- Delta
- -32.11%
- Verdict
- UNDERPRICED
- Comps
- 13 within 1.0 mi
Show comp detail 3 sales within ~0.75 mi
| Address | Dist | Beds/Ba | Sqft | Sold | Price | $/sf | Match |
|---|---|---|---|---|---|---|---|
| 55 Hickory Grove Rd | 0.41mi | 4/3.5 | 2,028 (-1%) | 6mo | $356,000 | $176 | 68 |
| 31 Hickory Grove Rd | 0.47mi | 4/2.5 | 2,336 (+14%) | 17mo | $230,000 | $98 | 39 |
| 101 Kingdom Rd | 0.74mi | 3/2.5 (-1) | 1,918 (-6%) | 18mo | $365,000 | $190 | 33 |
Match score weights: distance 35% · size 25% · config 20% · recency 20%. Top-matched comps best support the ARV.
Projected returns pro-forma
-2.25% appreciation · 8.0% rent growth · sell at horizon
- IRR
- -4.7%
- Equity multiple
- 0.81×
- Total profit
- $-10,603
- Equity at exit
- $35,599
- IRR
- 9.0%
- Equity multiple
- 1.93×
- Total profit
- $50,511
- Equity at exit
- $28,310
Cash invested: $54,558 (down + closing). Projections, not guarantees.
Landlord ↔ Tenant lean methodology
- Overall (STATE)
- 15 Strongly Tenant-Friendly
- State New York
- 15 Strongly Tenant-Friendly · D+10
- County
- — inherits STATE
- City
- — inherits STATE
ZIP-level market 13126
- Home prices YoY
- -0.8%
- Rents YoY
- 19.2%
- Active inventory
- 168
- Price-to-rent
- 8.0×
Monthly cashflow live
- Estimated rent
- $2,020 medium interval (Pro) →
- Mortgage (P&I)
- −$1,022
- Tax from tax record
- −$430 /mo · $5,163/yr
- Insurance
- −$81
- HOA
- −$0
- Vacancy / Maint / Mgmt
- −$424
- Net cashflow
- $63
Break-even live
UW: 25.0% down · 7.5% · 30yr · 1.5% tax · 5.0% vac · 8.0% maint · 8.0% mgmt
Financing live
Cash to close
- Down payment
- $48,712
- Closing costs
- $5,845
- Reserves months
- —
- Total cash needed
- —
Loan-product check · same deal, 3 products live
Conventional
25% down · 7.5% · 30yr
- Down + closing
- —
- Monthly P&I
- —
- Monthly cashflow
- —
- DSCR
- —
- Eligible?
- —
Personal DTI + credit; lowest rate.
DSCR
20% down · 8.5% · 30yr
- Down + closing
- —
- Monthly P&I
- —
- Monthly cashflow
- —
- DSCR
- —
- Eligible?
- —
No personal income docs; deal must DSCR.
Hard money
10% down · 12.0% · 12mo
- Down + closing
- —
- Monthly P&I
- —
- Monthly cashflow
- —
- DSCR
- —
- Eligible?
- —
Short-term bridge; refi at stabilization.
Listing history 14 events
-
2026-06-18remarks 669-char remark
-
2026-06-18pricedays on market $194,849 Active 1 DOM
-
2026-06-10days on market $205,105 Active 23 DOM
-
2026-06-09days on market $205,105 Active 22 DOM
-
2026-06-08days on market $205,105 Active 21 DOM
-
2026-06-07days on market $205,105 Active 20 DOM
-
2026-06-02days on market $205,105 Active 15 DOM
-
2026-06-01days on market $205,105 Active 14 DOM
-
2026-05-31days on market $205,105 Active 13 DOM
-
2026-05-30days on market $205,105 Active 12 DOM
-
2026-05-18$215,900 Active 668-char remark
-
2026-05-14historical
-
2026-04-20$215,900 Active
-
2013-01-11$109,900
ⓘ Source: listings_history table (triggers on properties + properties_extension) + one-shot
backfill from property_details.listing_events for pre-trigger history.
Tax reassessment forecast NY · Partial reset (capped growth)
- Current annual tax
- $5,163 · $430/mo
- Projected year-2 tax
- $5,163 · $430/mo
- Expected delta
- $0/yr ($0/mo · 0.0%)
ⓘ Screening estimate from a state-policy table — verify with the county assessor before closing.
Climate risk First Street
- Flood 1/10 Low FEMA zone X (unshaded) · 0% chance over 30 yrs
- Wildfire 1/10 Low
- Heat 2/10 Low 7 d/yr ≥94°F today · 16 d/yr by 30 yrs out
- Wind 1/10 Low 100% chance of damaging wind over 30 yrs
- Air quality 2/10 Low 1 unhealthy d/yr today · 1 by 30 yrs out
Nearby sold comps map
Loading sold comps map…
Walkable amenities ~0.75 mi
Loading nearby amenities…
Taxation est. · year 1
- Rental income
- $24,243
- − Mortgage interest
- −$10,915
- − Property taxes
- −$5,163
- − Insurance
- −$974
- − Repairs & maintenance
- −$1,939
- − Management
- −$1,939
- − Depreciation
- −$5,668
- Taxable loss
- −$2,356
- Est. tax savings @ 24.0%
- +$566
- After-tax cash flow
- $1,318/yr
For passive investors: Depreciation is non-cash, so a rental often shows a tax loss while cash-flowing — sheltering income. Rental losses are passive: they offset passive income freely, and up to $25,000/yr can offset ordinary (W-2) income if you actively participate and your MAGI is under $100k (phasing out to $0 by $150k); unused losses carry forward. On sale, claimed depreciation is recaptured at up to 25%, and gains may owe capital-gains tax (a 1031 exchange can defer both). Figures are a year-1 estimate at your 24.0% rate — not tax advice; consult a CPA.
Schools (NCES district)
- District
- Fulton City School District
- NCES district ID
- 3611700
- Math proficiency
- 29% ▼ -11.00%
- Reading proficiency
- 43% ▲ 5.00%
- Median HH income
- $43,337
- Composite
- 30.49/100
- National rank
- #6220
- State rank
- #554 of 590 in NY
Livability — Minetto
- Score
- 68/100
- State rank
- #554
- US rank
- #9951
Category grades
Schools grade is shown separately in the Schools card above.
Census & demographics
- County
- Oswego County · 36,495 people
- City population
- 223
- Metro
- Syracuse, NY
- Population (ZIP)
- 36,495
- Household income
- $65,346
- Rent vs Own
- Severe rent burden
- 1341.0
Population outlook (Oswego County) Hauer SSP2
- Today (2025)
- 114,465 people
- By 2030
- 109,968 · -3.9%
- By 2040
- 99,205 · -13.3%
- By 2050
- 87,979 · -23.1%
- By 2075
- 65,100 · -43.1%
- By 2100
- 47,117 · -58.8%
Race, ethnicity, and origin ACS 2023
- Neighborhood character
- Predominantly White (87%)
- Race & ethnicity
- White 87% Hispanic / Latino 5% Two or more races 5% Black 2% Asian 2%
- Hispanic origin (detail)
- Mexican 1% Puerto Rican 2%
- Common ancestry
- Romanian 6% Lithuanian 4% Italian 2%
- Foreign-born
- 3% · Canada
- Languages at home
- 93% English-only · Spanish 3% Other Asian/Pacific 1% Other Indo-European 1%
Political lean MEDSL · Oswego
- 2024 margin
- Strong R (+24.2) · D 37.9% · R 62.1%
- 2008→2024 swing
- -26.6pp toward R · 2008: 2.5pp · 2024: -24.2pp
- All cycles
- 2024: R+24.2 2020: R+20.2 2016: R+23.2 2012: D+7.9 2008: D+2.5
Not yet ingested
- Civics
- —
Market trends
- HPI YoY
- ▼ -2.25%
- Current HPI
- 295.5134
- Rent YoY
- ▲ 19.18%
- Metro
- Syracuse, NY
- State GDP YoY
- ▲ 2.60%
- F500 in state
- 92
Industry mix (Fortune 500 HQ in NY)
| Industry | F500 HQs | Revenue |
|---|---|---|
| Financial Services | 10 | $950B |
|
||
| Consumer Goods | 9 | $162B |
|
||
| Insurance | 4 | $225B |
|
||
| Telecommunications | 2 | $144B |
|
||
| Pharmaceuticals | 2 | $112B |
|
||
| Media / Entertainment | 2 | $69B |
|
||
Price history
+77.3% since first listed7 events — show timeline
- 2026-06-18 Listed $194,849 CNYIS
- 2026-06-12 Listing Removed — CNYIS
- 2026-05-26 Price Changed $205,105 CNYIS
- 2026-05-18 Listed $215,900 CNYIS
- 2026-05-14 Listing Removed — CNYIS
- 2026-04-20 Listed $215,900 CNYIS
- 2013-01-11 Listed $109,900 CNYIS
Property tax history
+0.7%/yrLatest (2025): $5,163 · -4.2% YoY. Source: county tax records.
Cash-flow waterfall
monthlySold comps — $/sqft
last 12 mo · ≤1 miLoading sold comps…