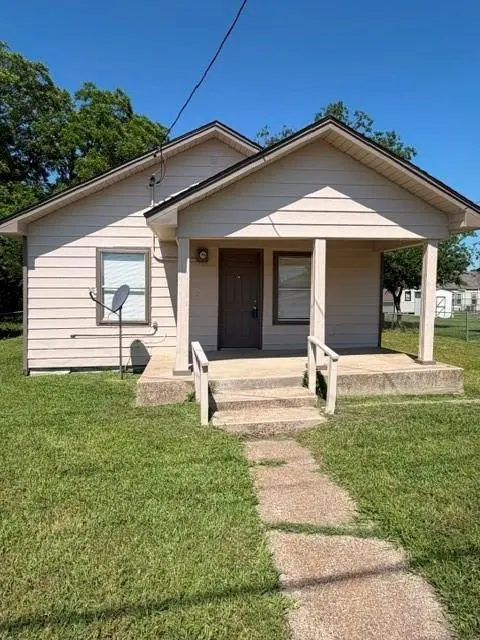
109 S 5th St · Sanger, TX
Flood risk 1/10 · Minimal
- FEMA flood zone
- X (unshaded)
- Chance of flooding over 30 yrs
- 0.0%
- Est. flood insurance / yr
- $507 – $1,088
Fire risk 6/10 · Moderate
- Est. fire insurance / yr
- $1,222 – $2,270
Heat risk 7/10 · Major
- Hot days now (above 111°F)
- 7 days/yr
- Hot days in 30 yrs
- 22 days/yr
Wind risk 4/10 · Minor
- Chance of severe wind over 30 yrs
- 18.0%
Air-quality risk 3/10 · Minor
- Unhealthy air days now
- 3 days/yr
- Unhealthy air days in 30 yrs
- 4 days/yr
Risk factors via First Street. Map © Google.
Why this score? — see what drove the C+ grade
The composite is a weighted blend of 9 inputs, each scored 0–100. Each bar is that input's sub-score; the figure is the points it added to the 100-point composite (weight × sub-score).
- Cash flow +23.0/30.0
- ARV discount +15.0/15.0
- DSCR +7.4/10.0
- 1% rule +5.3/10.0
- Schools +3.8/10.0
- Livability +3.1/5.0
- Rent growth +2.6/5.0
- Condition / age +2.5/5.0
- Appreciation +0.0/10.0
$160,000
🖨 Deal sheet 📄 Offer letter ✓ Due diligence
Listing remarks MLS
Charming 2 bedroom one bath home great first time home or investment opportunity. Home is in old town Sanger conveniently located near a growing and thriving downtown with churches, shopping, and dining. Enjoy your shaded backyard in a peaceful and quiet neighborhood.
Key facts
- Shaded backyard
- Growing downtown
- 5,750 sq ft lot
Tags
Neighborhood map
What this means for you Summary
Snapshot
- This is a 2-bed/1.0-bath single-family listed at $160k.
Deal economics
- At list price, monthly cash flow is $285 ($3k/yr) — positive.
- The deal already cash-flows at list — no discount required.
- Meets the 1% rule at list price ($2k rent vs $160k).
- Recommended offer: $150k (6.0% below list) — sets the bar for market timing.
- Cap rate 8.4% vs local median 3.6% in Sanger — top-decile yield for the area; either an underpriced asset or a hidden risk that comps aren't pricing in. Stress-test before assuming the spread holds.
Location & tenants
- Location reads 62/100 on livability (#958 in TX) — a middle-class / working-renter tenant base. Strengths: crime A+, cost of living A+, housing A+; Watch: schools C-, amenities F, commute F.
- Sanger ISD (rural): math 38% / reading 47% proficiency, ranked #281 of 826 in TX (top 34%) — families likely to look elsewhere, expect single-tenant / working-renter base with shorter leases.
- Market conditions: Rents flat; 322 active listings in the ZIP; 3 comparable units currently listed for rent nearby; rentals leasing fast (median 4d on market — plan ~1-2 weeks tenant-placement turnaround); solid renter incomes; 10,531 units permitted in Denton County in 2024 (2,713 in 5+ unit buildings).
Forward outlook
- Local home prices are declining (-3.0%/yr); year-one equity from $1k of loan paydown is wiped out by about $5k of value loss. Plan a longer hold.
- Denton County population projected at +66% by 2050 — long-run rental-demand tailwind backs the buy-and-hold thesis.
Negotiation context
- It's been on market 75 days — a 6% lower offer ($150k) is reasonable based on typical stale-listing flexibility.
- 3 sale attempts with the ask held roughly flat each time — persistent listings suggest the price (not the market) is what's stuck; bring a comps-based counter.
Risks & watch-outs
- Watch-outs: built in 1940 — expect roof / HVAC / electrical / plumbing capex.
- Climate carrying-cost: major wildfire risk; extreme-heat days projected 7→22/yr by 2055 (HVAC capex compounding) — expect insurance premiums to compound above CPI over the hold.
Questions for the listing agent
- It's been on market 75 days. Have you received any prior offers? Is the seller open to a 6% concession, seller financing, or rate buy-down credit?
- Built in 1940 — when were the roof, HVAC, electrical panel, plumbing, and water heater last replaced?
- Why hasn't it sold? Are there any deal-killer items the seller is aware of (foundation, flood, title, zoning, code violations)?
- Is there a deadline driving the sale (1031 exchange, divorce, estate, relocation)? That informs how much negotiation room exists.
- What's the average days-on-market for RENTAL listings here right now (not sales)? A rising rental-DOM trend means longer vacancies and softer asking-rent achievability than the comps imply.
- What's the recent tenant-quality profile in this submarket — average credit score on applications, eviction rate, late-payment / NSF rate, and stable-employment percentage? A property-management company in the area should have these aggregated.
- How much new for-sale + rental construction is in the pipeline within 1–3 miles? Heavy new supply typically softens prices + rents 12–24 months out; constrained supply supports both.
Investment metrics
- 1% rule
- 1.03% ✓
- Cap rate
- 8.43%
- Cash-on-cash
- 7.63%
- DSCR
- 1.34
- GRM
- 8.1
CMA / ARV
- ARV (median comp)
- $215,224
- List price
- $160,000
- Delta
- -25.66%
- Verdict
- UNDERPRICED
- Comps
- 15 within 1.0 mi
Show comp detail 5 sales within ~0.75 mi
| Address | Dist | Beds/Ba | Sqft | Sold | Price | $/sf | Match |
|---|---|---|---|---|---|---|---|
| 111 S 5th St | 0.01mi | 2/1.0 | 844 (+10%) | 0mo | $215,000 | $255 | 83 |
| 209 S 2nd St | 0.16mi | 2/1.0 | 832 (+8%) | 13mo | $209,900 | $252 | 68 |
| 203 Plum St | 0.41mi | 2/1.0 | 784 (+2%) | 16mo | $208,750 | $266 | 64 |
| 312 Marshall St | 0.18mi | 2/1.0 | 866 (+13%) | 20mo | $199,900 | $231 | 53 |
| 507 Denton St | 0.28mi | 2/1.0 | 864 (+12%) | 21mo | $223,000 | $258 | 48 |
Match score weights: distance 35% · size 25% · config 20% · recency 20%. Top-matched comps best support the ARV.
Projected returns pro-forma
-3.0% appreciation · 0.57% rent growth · sell at horizon
- IRR
- -7.3%
- Equity multiple
- 0.74×
- Total profit
- $-11,759
- Equity at exit
- $23,857
- IRR
- -0.9%
- Equity multiple
- 0.95×
- Total profit
- $-2,396
- Equity at exit
- $13,834
Cash invested: $44,800 (down + closing). Projections, not guarantees.
Landlord ↔ Tenant lean methodology
- Overall (STATE)
- 87 Strongly Landlord-Friendly
- State Texas
- 87 Strongly Landlord-Friendly · R+5
- County
- — inherits STATE
- City
- — inherits STATE
ZIP-level market 76266
- Home prices YoY
- -18.2%
- Rents YoY
- 0.6%
- Active inventory
- 322
- Price-to-rent
- 8.1×
Monthly cashflow live
- Estimated rent
- $1,650 medium interval (Pro) →
- Mortgage (P&I)
- −$839
- Tax from tax record
- −$113 /mo · $1,353/yr
- Insurance
- −$67
- HOA
- −$0
- Vacancy / Maint / Mgmt
- −$346
- Net cashflow
- $285
Break-even live
UW: 25.0% down · 7.5% · 30yr · 1.5% tax · 5.0% vac · 8.0% maint · 8.0% mgmt
Financing live
Cash to close
- Down payment
- $40,000
- Closing costs
- $4,800
- Reserves months
- —
- Total cash needed
- —
Loan-product check · same deal, 3 products live
Conventional
25% down · 7.5% · 30yr
- Down + closing
- —
- Monthly P&I
- —
- Monthly cashflow
- —
- DSCR
- —
- Eligible?
- —
Personal DTI + credit; lowest rate.
DSCR
20% down · 8.5% · 30yr
- Down + closing
- —
- Monthly P&I
- —
- Monthly cashflow
- —
- DSCR
- —
- Eligible?
- —
No personal income docs; deal must DSCR.
Hard money
10% down · 12.0% · 12mo
- Down + closing
- —
- Monthly P&I
- —
- Monthly cashflow
- —
- DSCR
- —
- Eligible?
- —
Short-term bridge; refi at stabilization.
Rent comps 3 comps
| Address | Beds | Baths | Sqft | Rent | $/sqft | DOM | Units | Dist |
|---|---|---|---|---|---|---|---|---|
| 105 S 3rd St Sanger, TX | 3.0 | 1.0 | 960 | $1,550 | $1.61 | 24d | 1 | 0.10mi |
| 2014 Jackson LN Sanger, TX | 1.0–3.0 | 1.0–2.0 | 1136 | $1,866 | $1.64 | 1d | 40 | 0.83mi |
| 821 Vernon Ct Sanger, TX | 3.0 | 1.0 | 1077 | $1,800 | $1.67 | 3d | 1 | 0.86mi |
Listing history 26 events
-
2026-06-18days on market $160,000 Active 75 DOM
-
2026-06-17days on market $160,000 Active 74 DOM
-
2026-06-16days on market $160,000 Active 73 DOM
-
2026-06-15days on market $160,000 Active 72 DOM
-
2026-06-13days on market $160,000 Active 70 DOM
-
2026-06-13days on market $160,000 Active 69 DOM
-
2026-06-09days on market $160,000 Active 66 DOM
-
2026-06-08days on market $160,000 Active 65 DOM
-
2026-06-07days on market $160,000 Active 64 DOM
-
2026-06-04days on market $160,000 Active 61 DOM
-
2026-06-03days on market $160,000 Active 60 DOM
-
2026-06-02days on market $160,000 Active 59 DOM
-
2026-06-01days on market $160,000 Active 58 DOM
-
2026-05-31days on market $160,000 Active 57 DOM
-
2026-05-12price $160,000 271-char remark
Show marketing remark (271 chars)
Charming 2 bedroom one bath home great first time home or investment opportunity. Home is in old town Sanger conveniently located near a growing and thriving downtown with churches, shopping, and dining. Enjoy your shaded backyard in a peaceful and quiet neighborhood.
-
2026-04-02$165,000 Active 271-char remark
Show marketing remark (271 chars)
Charming 2 bedroom one bath home great first time home or investment opportunity. Home is in old town Sanger conveniently located near a growing and thriving downtown with churches, shopping, and dining. Enjoy your shaded backyard in a peaceful and quiet neighborhood.
-
2026-01-21historical
-
2025-12-31price $170,000
-
2025-10-21price $180,000
-
2025-10-21$18,000 Active
-
2025-09-30historical
-
2025-07-31price $180,000
-
2025-07-09price $195,000
-
2025-06-06$220,000 Active
-
1990-05-22soldstatus
-
1988-03-14soldstatus
ⓘ Source: listings_history table (triggers on properties + properties_extension) + one-shot
backfill from property_details.listing_events for pre-trigger history.
Tax reassessment forecast TX · Resets to sale price
- Current annual tax
- $1,353 · $113/mo
- Projected year-2 tax
- $2,928 · $244/mo
- Expected delta
- +$1,575/yr (+$131/mo · 116.4%)
ⓘ Screening estimate from a state-policy table — verify with the county assessor before closing.
Climate risk First Street
- Flood 1/10 Low FEMA zone X (unshaded) · 0% chance over 30 yrs
- Wildfire 6/10 Major
- Heat 7/10 Severe 7 d/yr ≥111°F today · 22 d/yr by 30 yrs out
- Wind 4/10 Moderate 18% chance of damaging wind over 30 yrs
- Air quality 3/10 Moderate 3 unhealthy d/yr today · 4 by 30 yrs out
Nearby sold comps map
Loading sold comps map…
Walkable amenities ~0.75 mi
Loading nearby amenities…
Taxation est. · year 1
- Rental income
- $19,795
- − Mortgage interest
- −$8,962
- − Property taxes
- −$1,353
- − Insurance
- −$800
- − Repairs & maintenance
- −$1,584
- − Management
- −$1,584
- − Depreciation
- −$4,655
- Taxable income
- $858
- Est. tax owed @ 24.0%
- −$206
- After-tax cash flow
- $3,211/yr
For passive investors: Depreciation is non-cash, so a rental often shows a tax loss while cash-flowing — sheltering income. Rental losses are passive: they offset passive income freely, and up to $25,000/yr can offset ordinary (W-2) income if you actively participate and your MAGI is under $100k (phasing out to $0 by $150k); unused losses carry forward. On sale, claimed depreciation is recaptured at up to 25%, and gains may owe capital-gains tax (a 1031 exchange can defer both). Figures are a year-1 estimate at your 24.0% rate — not tax advice; consult a CPA.
Schools (NCES district)
- District
- Sanger ISD
- NCES district ID
- 4839180
- Math proficiency
- 38% ▼ -13.00%
- Reading proficiency
- 47% ▼ -2.00%
- Median HH income
- $62,803
- Composite
- 37.76/100
- National rank
- #4349
- State rank
- #281 of 826 in TX
Livability — Sanger
- Score
- 62/100
- State rank
- #958
- US rank
- #16973
Category grades
Schools grade is shown separately in the Schools card above.
Census & demographics
- Census place
- Sanger, TX
- County
- Denton County · 901,654 people
- City population
- 18,155
- Metro
- Dallas-Fort Worth-Arlington, TX
- Population (ZIP)
- 18,155
- Household income
- $99,425
- Rent vs Own
- Severe rent burden
- 325.0
Population outlook (Denton County) Hauer SSP2
- Today (2025)
- 1,053,010 people
- By 2030
- 1,192,269 · +13.2%
- By 2040
- 1,472,920 · +39.9%
- By 2050
- 1,746,506 · +65.9%
- By 2075
- 2,358,497 · +124.0%
- By 2100
- 2,779,183 · +163.9%
Race, ethnicity, and origin ACS 2023
- Neighborhood character
- Predominantly White (74%)
- Race & ethnicity
- White 74% Hispanic / Latino 18% Two or more races 10% Black 5% Asian 1%
- Hispanic origin (detail)
- Mexican 15%
- Common ancestry
- Italian 4% Iranian 2% Lithuanian 2%
- Foreign-born
- 8% · Canada
- Languages at home
- 86% English-only · Spanish 11% Other Indo-European 1% Russian/Polish/Slavic 1%
Political lean MEDSL · Denton
- 2024 margin
- R (+13.2) · D 42.7% · R 55.8% · Other 1.5%
- 2008→2024 swing
- +11.0pp toward D · 2008: -24.2pp · 2024: -13.2pp
- All cycles
- 2024: R+13.2 2020: R+8.1 2016: R+20.2 2012: R+31.7 2008: R+24.2
Not yet ingested
- Civics
- —
Market trends
- HPI YoY
- ▼ -63.07%
- Current HPI
- 284.2146
- Rent YoY
- ▲ 0.57%
- Metro
- Dallas-Fort Worth-Arlington, TX
- State GDP YoY
- ▲ 3.95%
- F500 in state
- 110
Industry mix (Fortune 500 HQ in TX)
| Industry | F500 HQs | Revenue |
|---|---|---|
| Energy | 16 | $1,198B |
|
||
| Technology | 5 | $198B |
|
||
| Engineering / Construction | 4 | $72B |
|
||
| Energy Services | 3 | $60B |
|
||
| Utilities | 3 | $41B |
|
||
| Healthcare | 2 | $330B |
|
||
Price history
-27.3% since first listed12 events — show timeline
- 2026-05-12 Price Changed $160,000 NTREIS
- 2026-04-02 Listed $165,000 NTREIS
- 2026-01-21 Listing Removed — NTREIS
- 2025-12-31 Price Changed $170,000 NTREIS
- 2025-10-21 Price Changed $180,000 NTREIS
- 2025-10-21 Listed $18,000 NTREIS
- 2025-09-30 Listing Removed — NTREIS
- 2025-07-31 Price Changed $180,000 NTREIS
- 2025-07-09 Price Changed $195,000 NTREIS
- 2025-06-06 Listed $220,000 NTREIS
- 1990-05-22 Sold (Public Records) — Public Records
- 1988-03-14 Sold (Public Records) — Public Records
Property tax history
+4.8%/yrLatest (2025): $1,353 · +1.2% YoY. Source: county tax records.
Cash-flow waterfall
monthlySold comps — $/sqft
last 12 mo · ≤1 miLoading sold comps…