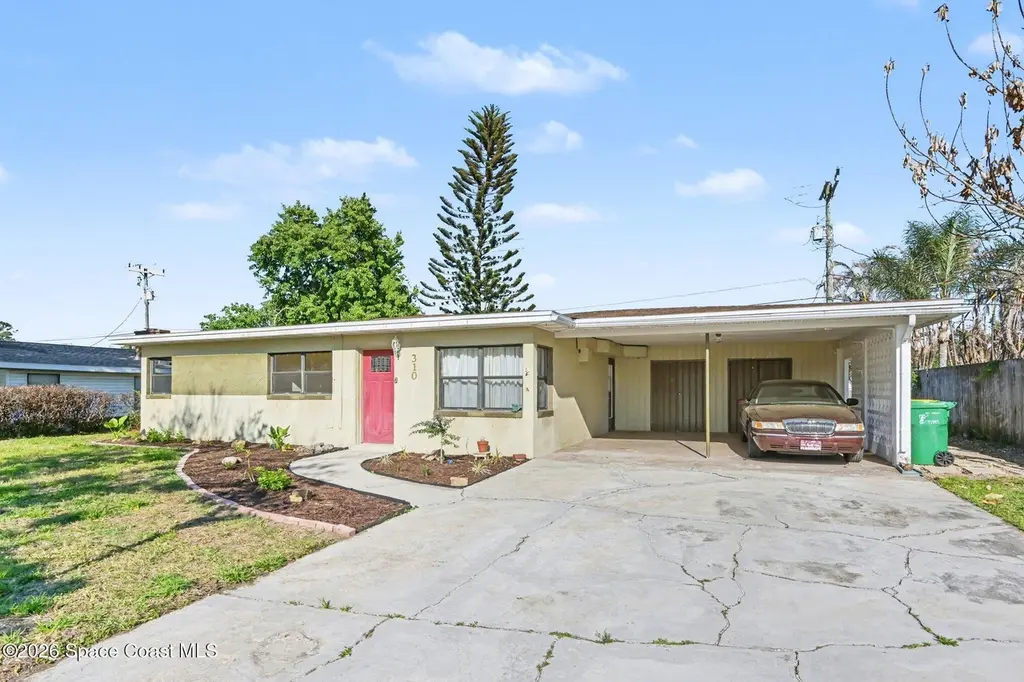
310 Norwood St · Merritt Island, FL
Flood risk 8/10 · Major
- FEMA flood zone
- X (unshaded)
- Chance of flooding over 30 yrs
- 0.97%
- Est. flood insurance / yr
- $507 – $1,088
Fire risk 3/10 · Minor
- Est. fire insurance / yr
- $947 – $1,759
Heat risk 10/10 · Severe
- Hot days now (above 106°F)
- 7 days/yr
- Hot days in 30 yrs
- 23 days/yr
Wind risk 10/10 · Severe
- Chance of severe wind over 30 yrs
- 99.0%
Air-quality risk 1/10 · Minimal
- Unhealthy air days now
- 0 days/yr
- Unhealthy air days in 30 yrs
- 0 days/yr
Risk factors via First Street. Map © Google.
Why this score? — see what drove the C grade
The composite is a weighted blend of 9 inputs, each scored 0–100. Each bar is that input's sub-score; the figure is the points it added to the 100-point composite (weight × sub-score).
- Cash flow +22.6/30.0
- ARV discount +7.5/15.0
- DSCR +7.2/10.0
- 1% rule +4.7/10.0
- Schools +4.7/10.0
- Livability +3.5/5.0
- Rent growth +3.0/5.0
- Condition / age +2.5/5.0
- Appreciation +0.0/10.0
$249,500
🖨 Deal sheet 📄 Offer letter ✓ Due diligence
Listing remarks
WOW, GREAT PRICE FOR MERRITT ISLAND!!! FIXER UPPER. .. .Cute 3 bedroom 1 1/2 bath with a newer roof (2021). Updated Kitchen, large backyard with a Shed. Family-friendly neighborhood with NO HOA, . Close to shopping, beaches, restaurants & golf courses. Make your appointment today.
Key facts
- Newer roof
- Large backyard
- Updated kitchen
Tags
Property features AI
Finance
- Other: Pets allowed
Exterior
- Parking: Carport (2 spaces)
- Utilities: Septic tank; Electricity connected; Natural gas connected; Water connected
- Home design: Single family residence; Faces east
- Construction: Concrete construction
- Exterior features: Few trees on the lot; No private pool
Interior
- Kitchen: Gas range; Microwave; Refrigerator
- Bedrooms: 3 bedrooms
- Flooring: Carpet; Terrazzo
- Bathrooms: 2 bathrooms (1 full, 1 half)
- Heating & cooling: Central heating; Central air conditioning
- Interior features: Ceiling fans; Other interior features
- Laundry & utility: Washer; Dryer
Neighborhood map
What this means for you Summary
Snapshot
- This is a 3-bed/2.0-bath single-family listed at $250k.
Deal economics
- At list price, monthly cash flow is $358 ($4k/yr) — positive.
- The deal already cash-flows at list — no discount required.
- To meet the 1% rule (rent ≥ 1% of price), the offer needs to be $243k (2.8% below list).
- Recommended offer: $235k (6.0% below list) — sets the bar for market timing.
Location & tenants
- Location reads 70/100 on livability (#441 in FL) — a middle-class / working-renter tenant base. Strengths: crime A+, housing A+, employment A-; Watch: amenities F, commute F, health & safety D-.
- Brevard (suburban): math 53% / reading 57% proficiency, ranked #19 of 73 in FL (top 26%) — acceptable for families but not a draw, mixed tenant base, ~2y average lease.
- Zoned schools: Mila Elementary School (math 37% / reading 46%, grade F, #1,437 of 2,144 statewide, top 68%, 433 students, 70% FRL); Thomas Jefferson Middle School (math 63% / reading 55%, grade B, #144 of 571 statewide, top 26%, 608 students, 43% FRL); Merritt Island High School (math 32% / reading 55%, grade F, #248 of 667 statewide, top 38%, 1,546 students, 35% FRL).
- Market conditions: Rents rising (+2.1%/yr); 219 active listings in the ZIP; 19 comparable units currently listed for rent nearby; rentals at typical pace (median 24d on market — plan ~3-4 weeks tenant-placement turnaround); solid renter incomes; 4,602 units permitted in Brevard County in 2024 (702 in 5+ unit buildings).
- This rent runs 33% of the median local income ($87k/yr) — at the standard rent-burdened threshold; future hikes will face affordability resistance.
Forward outlook
- Local home prices are declining (-3.0%/yr); year-one equity from $2k of loan paydown is wiped out by about $7k of value loss. Plan a longer hold.
- Brevard County population projected at +15% by 2050 — modest demand growth; plan on rents tracking national, not racing it.
Negotiation context
- It's been on market 83 days — a 6% lower offer ($235k) is reasonable based on typical stale-listing flexibility.
Risks & watch-outs
- Watch-outs: flood insurance adds $66/mo; built in 1957 — expect roof / HVAC / electrical / plumbing capex.
- Climate carrying-cost: severe flood risk; severe wind risk, 99% chance of damaging wind over 30y; extreme-heat days projected 7→23/yr by 2055 (HVAC capex compounding) — expect insurance premiums to compound above CPI over the hold.
Questions for the listing agent
- It's been on market 83 days. Have you received any prior offers? Is the seller open to a 6% concession, seller financing, or rate buy-down credit?
- Built in 1957 — when were the roof, HVAC, electrical panel, plumbing, and water heater last replaced?
- What's the actual annual flood-insurance premium (NFIP or private), and is the property in a SFHA with mandatory coverage?
- Why hasn't it sold? Are there any deal-killer items the seller is aware of (foundation, flood, title, zoning, code violations)?
- Is there a deadline driving the sale (1031 exchange, divorce, estate, relocation)? That informs how much negotiation room exists.
- Schools are B-rated — typically a magnet for longer-tenancy family renters. What's the average tenant stay here, and is there a school-zone premium baked into asking?
- What's the average days-on-market for RENTAL listings here right now (not sales)? A rising rental-DOM trend means longer vacancies and softer asking-rent achievability than the comps imply.
- What's the recent tenant-quality profile in this submarket — average credit score on applications, eviction rate, late-payment / NSF rate, and stable-employment percentage? A property-management company in the area should have these aggregated.
- How much new for-sale + rental construction is in the pipeline within 1–3 miles? Heavy new supply typically softens prices + rents 12–24 months out; constrained supply supports both.
Investment metrics
- 1% rule
- 0.97% ✗
- Cap rate
- 8.34%
- Cash-on-cash
- 7.30%
- DSCR
- 1.32
- GRM
- 8.6
CMA / ARV
No comps found within radius.
Projected returns pro-forma
-3.0% appreciation · 2.12% rent growth · sell at horizon
- IRR
- -7.8%
- Equity multiple
- 0.72×
- Total profit
- $-19,793
- Equity at exit
- $37,201
- IRR
- 0.7%
- Equity multiple
- 1.05×
- Total profit
- $3,314
- Equity at exit
- $21,572
Cash invested: $69,860 (down + closing). Projections, not guarantees.
Landlord ↔ Tenant lean methodology
- Overall (STATE)
- 87 Strongly Landlord-Friendly
- State Florida
- 87 Strongly Landlord-Friendly · R+3
- County
- — inherits STATE
- City
- — inherits STATE
ZIP-level market 32953
- Home prices YoY
- -34.5%
- Rents YoY
- 2.1%
- Active inventory
- 219
- Price-to-rent
- 8.6×
Monthly cashflow live
- Estimated rent
- $2,425 high interval (Pro) →
- Mortgage (P&I)
- −$1,308
- Tax from tax record
- −$78 /mo · $942/yr
- Insurance
- −$104
- Flood insurance flood zone
- −$66 /mo · $798/yr
- HOA
- −$0
- Vacancy / Maint / Mgmt
- −$509
- Net cashflow
- $358
Break-even live
UW: 25.0% down · 7.5% · 30yr · 1.5% tax · 5.0% vac · 8.0% maint · 8.0% mgmt
Financing live
Cash to close
- Down payment
- $62,375
- Closing costs
- $7,485
- Reserves months
- —
- Total cash needed
- —
Loan-product check · same deal, 3 products live
Conventional
25% down · 7.5% · 30yr
- Down + closing
- —
- Monthly P&I
- —
- Monthly cashflow
- —
- DSCR
- —
- Eligible?
- —
Personal DTI + credit; lowest rate.
DSCR
20% down · 8.5% · 30yr
- Down + closing
- —
- Monthly P&I
- —
- Monthly cashflow
- —
- DSCR
- —
- Eligible?
- —
No personal income docs; deal must DSCR.
Hard money
10% down · 12.0% · 12mo
- Down + closing
- —
- Monthly P&I
- —
- Monthly cashflow
- —
- DSCR
- —
- Eligible?
- —
Short-term bridge; refi at stabilization.
Rent comps 19 comps
| Address | Beds | Baths | Sqft | Rent | $/sqft | DOM | Units | Dist |
|---|---|---|---|---|---|---|---|---|
| 140 McLeod St Unit 1513829P Merritt Island, FL | 3.0 | 2.0 | 1323 | $3,291 | $2.49 | 19d | 1 | 0.29mi |
| 55 Needle Blvd Merritt Island, FL | 2.0 | 1.5 | 900 | $1,545 | $1.72 | 14d | 2 | 0.38mi |
| 55 Needle Blvd Merritt Island, FL | 2.0 | 1.5 | 900 | $1,525 | $1.69 | 23d | 2 | 0.38mi |
| 50 Needle Blvd #28 Merritt Island, FL | 2.0 | 1.5 | 900 | $1,550 | $1.72 | 23d | 1 | 0.41mi |
| 145 Needle Blvd Merritt Island, FL | 4.0 | 2.0 | 1314 | $3,250 | $2.47 | 23d | 1 | 0.50mi |
| 205 Palmetto Ave Merritt Island, FL | 2.0 | 2.0 | 1033 | $1,625 | $1.57 | 23d | 2 | 0.56mi |
| 225 S Tropical Trl Merritt Island, FL | 1.0–2.0 | 1.0–2.0 | 779 | $2,800 | $3.59 | 23d | 4 | 0.58mi |
| 225 S Tropical Trl Merritt Island, FL | 1.0–2.0 | 1.0–2.0 | 779 | $2,800 | $3.59 | 14d | 4 | 0.58mi |
| 215 Richland Ave Unit 1044313P Merritt Island, FL | 3.0 | 2.0 | 1184 | $4,648 | $3.93 | 14d | 1 | 0.70mi |
| 800 1st St Merritt Island, FL | 3.0 | 2.0 | 1529 | $2,800 | $1.83 | 23d | 1 | 0.70mi |
| 390 Needle Blvd Merritt Island, FL | 4.0 | 2.0 | 1828 | $3,450 | $1.89 | 23d | 1 | 0.79mi |
| 410 S Tropical Trl Merritt Island, FL | 3.0 | 2.0 | 1573 | $2,295 | $1.46 | 23d | 1 | 0.81mi |
| 820 Del Rio Way #401 Merritt Island, FL | 3.0 | 2.0 | 1862 | $2,600 | $1.40 | 23d | 1 | 0.86mi |
| 165 Tiki Dr Merritt Island, FL | 3.0 | 2.0 | 1795 | $2,875 | $1.60 | 23d | 1 | 0.90mi |
| 480 Nancie Ave Merritt Island, FL | 3.0 | 2.0 | 888 | $2,100 | $2.36 | 23d | 1 | 1.03mi |
| 1155 N Courtenay Pkwy Merritt Island, FL | 2.0 | 1.0 | 750 | $1,434 | $1.91 | 23d | 1 | 1.05mi |
| 489 Seacrest Ave Unit 1325661P Merritt Island, FL | 3.0 | 2.0 | 1173 | $4,320 | $3.68 | 14d | 1 | 1.10mi |
| 200 S Sykes Creek Pkwy #702 Merritt Island, FL | 2.0 | 2.0 | 1307 | $2,390 | $1.83 | 23d | 1 | 1.38mi |
| 250 S Sykes Creek Pkwy Unit B510 Merritt Island, FL | 2.0 | 2.0 | 1660 | $2,600 | $1.57 | 23d | 1 | 1.44mi |
Listing history 30 events
-
2026-06-18price $249,500 Active 83 DOM
-
2026-06-18days on market $250,000 Active 83 DOM
-
2026-06-17days on market $250,000 Active 82 DOM
-
2026-06-16days on market $250,000 Active 81 DOM
-
2026-06-15days on market $250,000 Active 80 DOM
-
2026-06-14days on market $250,000 Active 78 DOM
-
2026-06-10days on market $250,000 Active 75 DOM
-
2026-06-08days on market $250,000 Active 73 DOM
-
2026-06-07days on market $250,000 Active 72 DOM
-
2026-06-05days on market $250,000 Active 69 DOM
-
2026-06-03days on market $250,000 Active 68 DOM
-
2026-06-02days on market $250,000 Active 67 DOM
-
2026-06-01days on market $250,000 Active 66 DOM
-
2026-05-31days on market $250,000 Active 65 DOM
-
2026-05-31days on market $250,000 Active 64 DOM
-
2026-05-21price $277,000
-
2026-05-18price $278,000
-
2026-05-14price $279,000
-
2026-05-11price $280,000
-
2026-05-08price $281,000
-
2026-04-30price $282,000
-
2026-04-27price $283,000
-
2026-04-24price $284,000
-
2026-04-20price $285,000
-
2026-04-16price $286,000
-
2026-04-13price $287,000
-
2026-04-09price $288,000
-
2026-04-06price $289,000
-
2026-04-02price $290,000
-
2026-03-27$300,000 Active
ⓘ Source: listings_history table (triggers on properties + properties_extension) + one-shot
backfill from property_details.listing_events for pre-trigger history.
Tax reassessment forecast FL · Resets to sale price
- Current annual tax
- $942 · $78/mo
- Projected year-2 tax
- $2,071 · $173/mo
- Expected delta
- +$1,129/yr (+$94/mo · 119.9%)
ⓘ Screening estimate from a state-policy table — verify with the county assessor before closing.
Climate risk First Street
- Flood 8/10 Severe FEMA zone X (unshaded) · 97% chance over 30 yrs
- Wildfire 3/10 Moderate
- Heat 10/10 Extreme 7 d/yr ≥106°F today · 23 d/yr by 30 yrs out
- Wind 10/10 Extreme 99% chance of damaging wind over 30 yrs
- Air quality 1/10 Low 0 unhealthy d/yr today · 0 by 30 yrs out
Nearby sold comps map
Loading sold comps map…
Walkable amenities ~0.75 mi
Loading nearby amenities…
Taxation est. · year 1
- Rental income
- $29,100
- − Mortgage interest
- −$13,976
- − Property taxes
- −$942
- − Insurance
- −$2,045
- − Repairs & maintenance
- −$2,328
- − Management
- −$2,328
- − Depreciation
- −$7,258
- Taxable income
- $223
- Est. tax owed @ 24.0%
- −$54
- After-tax cash flow
- $4,248/yr
For passive investors: Depreciation is non-cash, so a rental often shows a tax loss while cash-flowing — sheltering income. Rental losses are passive: they offset passive income freely, and up to $25,000/yr can offset ordinary (W-2) income if you actively participate and your MAGI is under $100k (phasing out to $0 by $150k); unused losses carry forward. On sale, claimed depreciation is recaptured at up to 25%, and gains may owe capital-gains tax (a 1031 exchange can defer both). Figures are a year-1 estimate at your 24.0% rate — not tax advice; consult a CPA.
Schools (NCES district)
- District
- Brevard
- NCES district ID
- 1200150
- Math proficiency
- 53% ▼ -9.00%
- Reading proficiency
- 57% ▼ -4.00%
- Median HH income
- $49,426
- Composite
- 46.86/100
- National rank
- #2370
- State rank
- #19 of 73 in FL
Livability — Merritt Island
- Score
- 70/100
- State rank
- #441
- US rank
- #7878
Category grades
Schools grade is shown separately in the Schools card above.
Census & demographics
- Census place
- Merritt Island, FL
- County
- Brevard County · 602,871 people
- City population
- 46,372
- Metro
- Palm Bay-Melbourne-Titusville, FL
- Population (ZIP)
- 24,759
- Household income
- $87,262
- Rent vs Own
- Severe rent burden
- 849.0
Population outlook (Brevard County) Hauer SSP2
- Today (2025)
- 623,254 people
- By 2030
- 648,420 · +4.0%
- By 2040
- 690,009 · +10.7%
- By 2050
- 715,669 · +14.8%
- By 2075
- 775,744 · +24.5%
- By 2100
- 776,687 · +24.6%
Race, ethnicity, and origin ACS 2023
- Neighborhood character
- Predominantly White (77%)
- Race & ethnicity
- White 77% Hispanic / Latino 13% Two or more races 7% Black 4% Asian 3%
- Hispanic origin (detail)
- Mexican 2% Puerto Rican 6%
- Common ancestry
- Slovak 3% Romanian 3% Lithuanian 3%
- Foreign-born
- 9% · Canada, China, Jamaica
- Languages at home
- 87% English-only · Spanish 8% Tagalog/Filipino 2% French/Haitian/Cajun 1%
Political lean MEDSL · Brevard
- 2024 margin
- Strong R (+20.8) · D 39.1% · R 59.9% · Other 1.0%
- 2008→2024 swing
- -10.4pp toward R · 2008: -10.4pp · 2024: -20.8pp
- All cycles
- 2024: R+20.8 2020: R+16.4 2016: R+19.8 2012: R+12.7 2008: R+10.4
Not yet ingested
- Civics
- —
Market trends
- HPI YoY
- ▼ -168.76%
- Current HPI
- 320.1966
- Rent YoY
- ▲ 2.12%
- Metro
- Palm Bay-Melbourne-Titusville, FL
- State GDP YoY
- ▲ 3.28%
- F500 in state
- 36
Industry mix (Fortune 500 HQ in FL)
| Industry | F500 HQs | Revenue |
|---|---|---|
| Industrial Technology | 2 | $29B |
|
||
| Insurance | 2 | $17B |
|
||
| Retail | 1 | $60B |
|
||
| Technology Distribution | 1 | $58B |
|
||
| Homebuilding | 1 | $35B |
|
||
| Technology Manufacturing | 1 | $35B |
|
||
Price history
-7.7% since first listed15 events — show timeline
- 2026-05-21 Price Changed $277,000 SCMLS
- 2026-05-18 Price Changed $278,000 SCMLS
- 2026-05-14 Price Changed $279,000 SCMLS
- 2026-05-11 Price Changed $280,000 SCMLS
- 2026-05-08 Price Changed $281,000 SCMLS
- 2026-04-30 Price Changed $282,000 SCMLS
- 2026-04-27 Price Changed $283,000 SCMLS
- 2026-04-24 Price Changed $284,000 SCMLS
- 2026-04-20 Price Changed $285,000 SCMLS
- 2026-04-16 Price Changed $286,000 SCMLS
- 2026-04-13 Price Changed $287,000 SCMLS
- 2026-04-09 Price Changed $288,000 SCMLS
- 2026-04-06 Price Changed $289,000 SCMLS
- 2026-04-02 Price Changed $290,000 SCMLS
- 2026-03-27 Listed $300,000 SCMLS
Property tax history
+4.1%/yrLatest (2025): $942 · +13.0% YoY. Source: county tax records.
Cash-flow waterfall
monthlySold comps — $/sqft
last 12 mo · ≤1 miLoading sold comps…