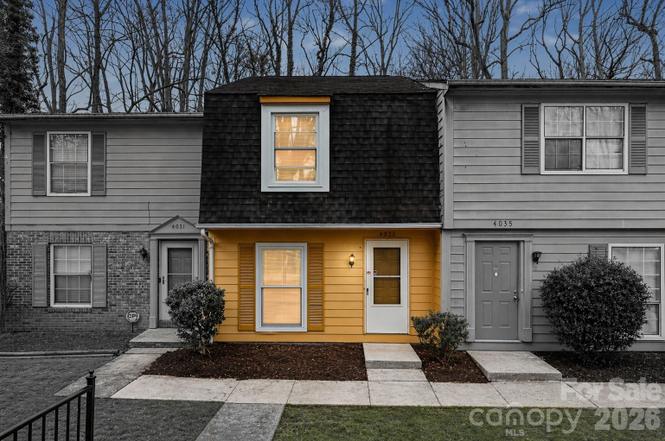
4033 Briarhill Dr · Charlotte, NC
Flood risk 1/10 · Minimal
- FEMA flood zone
- X (unshaded)
- Chance of flooding over 30 yrs
- 0.0%
- Est. flood insurance / yr
- $507 – $1,088
Fire risk 1/10 · Minimal
- Est. fire insurance / yr
- $906 – $1,684
Heat risk 6/10 · Moderate
- Hot days now (above 104°F)
- 7 days/yr
- Hot days in 30 yrs
- 17 days/yr
Wind risk 6/10 · Moderate
- Chance of severe wind over 30 yrs
- 27.0%
Air-quality risk 3/10 · Minor
- Unhealthy air days now
- 3 days/yr
- Unhealthy air days in 30 yrs
- 4 days/yr
Risk factors via First Street. Map © Google.
Why this score? — see what drove the F grade
The composite is a weighted blend of 9 inputs, each scored 0–100. Each bar is that input's sub-score; the figure is the points it added to the 100-point composite (weight × sub-score).
- Cash flow +11.8/30.0
- 1% rule +4.0/10.0
- Livability +3.9/5.0
- Schools +3.8/10.0
- DSCR +3.5/10.0
- Rent growth +2.9/5.0
- Condition / age +2.5/5.0
- ARV discount +0.0/15.0
- Appreciation +0.0/10.0
$166,990
🖨 Deal sheet 📄 Offer letter ✓ Due diligence
Listing remarks
Price Reduction in East Charlotte! Don’t miss this well-maintained East Charlotte townhome offering comfortable, low-maintenance living, great natural light, and a functional floor plan designed for everyday convenience. This property is a great opportunity for first-time homebuyers, downsizers, or investors looking for an affordable Charlotte real estate option. Conveniently located near shopping, dining, parks, schools, and major commuter routes, this home provides easy access to Uptown Charlotte, I-485, and surrounding areas. With its desirable location, value-focused pricing, and strong rental or owner-occupant potential, this East Charlotte townhome is ready for its next chapter.
Key facts
- $175 HOA
- Built 1985
- Listed 103 days
Property features AI
Finance
- HOA & community: Monthly HOA fee of $175 (MILTON COMMONS); HOA mandatory; Pets allowed
Exterior
- Parking: Parking lot
- Security: Carbon monoxide detector(s); Smoke detector(s)
- Utilities: City water; Public sewer; Electricity connected; Cable available; Wired internet available; Satellite internet available
- Home design: Residential townhouse; Two levels; Entry level 1; Private maintained road
- Construction: Site-built construction; Hardboard siding; Composition roof; Slab foundation; Built on a 0.03-acre lot
- Exterior features: Lawn maintenance provided; Storage
Interior
- Kitchen: Dishwasher
- Bedrooms: 2 bedrooms on the upper level
- Bathrooms: 1 full bathroom (upper); 1 half bathroom (main)
- Heating & cooling: Central heating; Central air; Ceiling fan(s)
- Interior features: 6 rooms total; Entry level: 1; Dishwasher
- Laundry & utility: In-unit laundry with washer and electric dryer hookups; Laundry closet
Neighborhood map
What this means for you Summary
Snapshot
- This is a 2-bed/1.5-bath townhouse listed at $167k.
Deal economics
- At list price, monthly cash flow is $-44 ($-532/yr) — negative.
- To cash-flow at today's rent, offer at most $159k (4.7% below list).
- To meet the 1% rule (rent ≥ 1% of price), the offer needs to be $150k (10.3% below list).
- Recommended offer: $150k (10.3% below list) — sets the bar for 1% rule.
- Cap rate 6.0% vs local median 3.1% in Charlotte — top-decile yield for the area; either an underpriced asset or a hidden risk that comps aren't pricing in. Stress-test before assuming the spread holds.
Location & tenants
- Location reads 78/100 on livability (#26 in NC, #2,502 nationally) — a middle-class / working-renter tenant base. Strengths: amenities A+, commute A+, housing A+; Watch: schools D+, crime F.
- Charlotte-Mecklenburg Schools (urban): math 42% / reading 46% proficiency, ranked #85 of 178 in NC (top 48%) — families likely to look elsewhere, expect single-tenant / working-renter base with shorter leases.
- Market conditions: Rents rising (+1.8%/yr); 562 active listings in the ZIP; 40 comparable units currently listed for rent nearby; rentals at typical pace (median 17d on market — plan ~3-4 weeks tenant-placement turnaround); 11,969 units permitted in Mecklenburg County in 2024 (5,377 in 5+ unit buildings).
Forward outlook
- Local home prices are declining (-3.0%/yr); year-one equity from $1k of loan paydown is wiped out by about $5k of value loss. Plan a longer hold.
- Mecklenburg County population projected at +53% by 2050 — long-run rental-demand tailwind backs the buy-and-hold thesis.
Negotiation context
- It's been on market 104 days — a 9% lower offer ($152k) is reasonable based on typical stale-listing flexibility.
Risks & watch-outs
- Climate carrying-cost: major wind risk, 27% chance of damaging wind over 30y; extreme-heat days projected 7→17/yr by 2055 (HVAC capex compounding) — expect insurance premiums to compound above CPI over the hold.
Questions for the listing agent
- What do current leases actually rent for vs. the listed asking? Can we see a recent rent roll and the last 12 months of T-12 income?
- It's been on market 104 days. Have you received any prior offers? Is the seller open to a 10% concession, seller financing, or rate buy-down credit?
- What does the HOA fee cover, when was the last increase, and are there any pending special assessments or reserve-fund shortfalls?
- Why hasn't it sold? Are there any deal-killer items the seller is aware of (foundation, flood, title, zoning, code violations)?
- Is there a deadline driving the sale (1031 exchange, divorce, estate, relocation)? That informs how much negotiation room exists.
- Schools are D-rated, which usually means shorter tenancies and higher turnover. Who's the typical renter profile here, and what's been the actual vacancy rate?
- Crime grade is F in this area — have there been break-ins, vandalism, or insurance claims at this property in the last 3 years? What carrier currently insures it and at what premium?
- The area grade is low — what's the realistic commute time and amenity access for the typical tenant pool here? Any planned neighborhood developments (good or bad) we should know about?
- What's the average days-on-market for RENTAL listings here right now (not sales)? A rising rental-DOM trend means longer vacancies and softer asking-rent achievability than the comps imply.
- What's the recent tenant-quality profile in this submarket — average credit score on applications, eviction rate, late-payment / NSF rate, and stable-employment percentage? A property-management company in the area should have these aggregated.
- How much new for-sale + rental construction is in the pipeline within 1–3 miles? Heavy new supply typically softens prices + rents 12–24 months out; constrained supply supports both.
Investment metrics
- 1% rule
- 0.90% ✗
- Cap rate
- 5.97%
- Cash-on-cash
- -1.14%
- DSCR
- 0.95
- GRM
- 9.3
CMA / ARV
- ARV (on-the-fly)
- $136,320
- Comps found
- 5
Show comp detail 5 sales within ~0.75 mi
| Address | Dist | Beds/Ba | Sqft | Sold | Price | $/sf | Match |
|---|---|---|---|---|---|---|---|
| 4051 Briarhill Dr | 0.04mi | 2/1.5 | 992 (+3%) | 18mo | $179,000 | $180 | 78 |
| 3919 Briarhill Dr | 0.08mi | 3/1.5 (+1) | 1,097 (+14%) | 11mo | $192,500 | $175 | 58 |
| 4508 Sharon Chase Dr Unit H | 0.60mi | 2/2.0 | 913 (-5%) | 8mo | $130,000 | $142 | 55 |
| 4524 Sharon Chase Dr Unit E | 0.57mi | 2/2.0 | 958 (-0%) | 21mo | $115,000 | $120 | 54 |
| 4500 Sharon Chase Dr Unit C | 0.59mi | 3/2.0 (+1) | 1,062 (+11%) | 5mo | $115,000 | $108 | 44 |
Match score weights: distance 35% · size 25% · config 20% · recency 20%. Top-matched comps best support the ARV.
Projected returns pro-forma
-3.0% appreciation · 1.76% rent growth · sell at horizon
- IRR
- -19.6%
- Equity multiple
- 0.32×
- Total profit
- $-31,660
- Equity at exit
- $24,899
- IRR
- -15.3%
- Equity multiple
- 0.18×
- Total profit
- $-38,316
- Equity at exit
- $14,438
Cash invested: $46,757 (down + closing). Projections, not guarantees.
Landlord ↔ Tenant lean methodology
- Overall (STATE)
- 85 Strongly Landlord-Friendly
- State North Carolina
- 85 Strongly Landlord-Friendly · R+3
- County
- — inherits STATE
- City
- — inherits STATE
ZIP-level market 28215
- Rents YoY
- 1.8%
- Active inventory
- 562
- Price-to-rent
- 9.3×
Monthly cashflow live
- Estimated rent
- $1,497 high interval (Pro) →
- Mortgage (P&I)
- −$876
- Tax from tax record
- −$107 /mo · $1,284/yr
- Insurance
- −$70
- HOA
- −$175
- Vacancy / Maint / Mgmt
- −$314
- Net cashflow
- $-44
Break-even live
UW: 25.0% down · 7.5% · 30yr · 1.5% tax · 5.0% vac · 8.0% maint · 8.0% mgmt
Financing live
Cash to close
- Down payment
- $41,748
- Closing costs
- $5,010
- Reserves months
- —
- Total cash needed
- —
Loan-product check · same deal, 3 products live
Conventional
25% down · 7.5% · 30yr
- Down + closing
- —
- Monthly P&I
- —
- Monthly cashflow
- —
- DSCR
- —
- Eligible?
- —
Personal DTI + credit; lowest rate.
DSCR
20% down · 8.5% · 30yr
- Down + closing
- —
- Monthly P&I
- —
- Monthly cashflow
- —
- DSCR
- —
- Eligible?
- —
No personal income docs; deal must DSCR.
Hard money
10% down · 12.0% · 12mo
- Down + closing
- —
- Monthly P&I
- —
- Monthly cashflow
- —
- DSCR
- —
- Eligible?
- —
Short-term bridge; refi at stabilization.
Rent comps 40 comps
| Address | Beds | Baths | Sqft | Rent | $/sqft | DOM | Units | Dist |
|---|---|---|---|---|---|---|---|---|
| 3932 Slagle Dr Charlotte, NC | 3.0 | 2.0 | 1015 | $1,800 | $1.77 | 24d | 1 | 0.17mi |
| 3829 Stonehaven Dr Charlotte, NC | 3.0 | 1.5 | 1081 | $1,850 | $1.71 | 16d | 1 | 0.34mi |
| 7113 Village Green Dr Charlotte, NC | 1.0–2.0 | 1.0 | 710 | $1,175 | $1.65 | 1d | 8 | 0.44mi |
| 7000 Barrington Dr Unit 2500-10 Charlotte, NC | 2.0 | 1.5 | 945 | $1,410 | $1.49 | 7d | 1 | 0.50mi |
| 7000 Barrington Dr Unit 2703-08 Charlotte, NC | 2.0 | 1.5 | 945 | $1,160 | $1.23 | 5d | 1 | 0.50mi |
| 7000 Barrington Dr Unit L2615-05 Charlotte, NC | 1.0 | 1.0 | 756 | $980 | $1.30 | 15d | 1 | 0.50mi |
| 7000 Barrington Dr Unit 2621-03 Charlotte, NC | 1.0 | 1.0 | 756 | $1,120 | $1.48 | 24d | 1 | 0.50mi |
| 7000 Barrington Dr Unit 7101-05 Charlotte, NC | 1.0 | 1.0 | 756 | $980 | $1.30 | 24d | 1 | 0.50mi |
| 7000 Barrington Dr Charlotte, NC | 1.0–3.0 | 1.0–1.5 | 997 | $1,290 | $1.29 | 2d | 8 | 0.51mi |
| 4408 Sharon Chase Dr Charlotte, NC | 1.0 | 1.0 | 992 | $730 | $0.74 | 16d | 1 | 0.54mi |
| 4417 Sharon Chase Dr Unit A Charlotte, NC | 2.0 | 2.0 | 929 | $1,299 | $1.40 | 16d | 1 | 0.55mi |
| 7000 Barrington Dr Unit 2500-03 Charlotte, NC | 2.0 | 1.5 | 945 | $1,410 | $1.49 | 24d | 1 | 0.58mi |
| 4608 Sharon Chase Dr Unit C Charlotte, NC | 3.0 | 2.0 | 1062 | $1,700 | $1.60 | 16d | 1 | 0.60mi |
| 1951 Milton Rd Charlotte, NC | 1.0–2.0 | 1.0–1.5 | 682 | $1,340 | $1.96 | 2d | 7 | 0.62mi |
| 4617 Sharon Chase Dr Unit H Charlotte, NC | 2.0 | 2.0 | 908 | $1,395 | $1.54 | 24d | 1 | 0.67mi |
| 5100 Little Greenleaf Way Charlotte, NC | 2.0 | 2.0 | 970 | $1,199 | $1.24 | 7d | 1 | 0.87mi |
| 4811 Spring Lake Dr Unit E Charlotte, NC | 2.0 | 2.0 | 1053 | $1,500 | $1.42 | 20d | 1 | 0.95mi |
| 4908 Endolwood Rd Charlotte, NC | 1.0–2.0 | 1.0–2.0 | 775 | $1,405 | $1.81 | 2d | 25 | 0.97mi |
| 4700 Twisted Oaks Rd Charlotte, NC | 1.0–2.0 | 1.0–2.0 | 780 | $1,498 | $1.92 | 2d | 14 | 0.98mi |
| 3217 Shamrock Dr Charlotte, NC | 1.0 | 1.0 | 668 | $1,059 | $1.59 | 24d | 1 | 0.99mi |
| 3217 Shamrock Dr Charlotte, NC | 2.0 | 2.0 | 1024 | $1,390 | $1.36 | 22d | 1 | 0.99mi |
| 6309 Montego Dr Charlotte, NC | 1.0–3.0 | 1.0–2.0 | 952 | $1,212 | $1.27 | 3d | 1 | 0.99mi |
| 4900 Spring Lake Dr Charlotte, NC | 2.0 | 2.0 | 1053 | $1,499 | $1.42 | 12d | 1 | 1.00mi |
| 6116 Meadow Rose Ln Charlotte, NC | 1.0 | 1.0 | 956 | $725 | $0.76 | 2d | 1 | 1.00mi |
| 6116 Meadow Rose Ln Charlotte, NC | 1.0 | 1.0 | 956 | $695 | $0.73 | 24d | 1 | 1.00mi |
| 6017 Williams Rd Charlotte, NC | 3.0 | 1.0–2.0 | 877 | $1,567 | $1.79 | 24d | 1 | 1.03mi |
| 6142 Meadow Rose Ln Charlotte, NC | 2.0 | 2.0 | 941 | $1,225 | $1.30 | 24d | 1 | 1.03mi |
| 6158 Meadow Rose Ln Unit 1 Charlotte, NC | 2.0 | 2.0 | 834 | $1,200 | $1.44 | 11d | 1 | 1.04mi |
| 6164 Meadow Rose Ln Charlotte, NC | 2.0 | 2.0 | 881 | $1,250 | $1.42 | 24d | 1 | 1.04mi |
| 6164 Meadow Rose Ln Charlotte, NC | 2.0 | 2.0 | 881 | $1,250 | $1.42 | 5d | 1 | 1.04mi |
| 6156 Meadow Rose Ln Charlotte, NC | 2.0 | 2.0 | 846 | $1,250 | $1.48 | 22d | 1 | 1.05mi |
| 6158 Meadow Rose Ln Charlotte, NC | 2.0 | 2.0 | 834 | $1,250 | $1.50 | 11d | 1 | 1.05mi |
| 6133 Meadow Rose Ln Charlotte, NC | 2.0 | 2.0 | 846 | $1,250 | $1.48 | 24d | 1 | 1.06mi |
| 6133 Meadow Rose Ln Charlotte, NC | 2.0 | 2.0 | 846 | $1,250 | $1.48 | 14d | 1 | 1.06mi |
| 6125 Meadow Rose Ln Charlotte, NC | 2.0 | 2.0 | 918 | $1,250 | $1.36 | 22d | 1 | 1.07mi |
| 7234 Rose Terrace Ct Unit 7242 Charlotte, NC | 2.0 | 2.0 | 1000 | $1,450 | $1.45 | 24d | 1 | 1.07mi |
| 2900 Edsel Pl Charlotte, NC | 3.0 | 1.0 | 1056 | $1,700 | $1.61 | 16d | 1 | 1.09mi |
| 2900 Edsel Pl Charlotte, NC | 3.0 | 1.0 | 1000 | $1,700 | $1.70 | 5d | 1 | 1.09mi |
| 7264 Rose Terrace Ct Charlotte, NC | 2.0 | 2.0 | 1000 | $1,375 | $1.38 | 5d | 6 | 1.09mi |
| 2219 Kilborne Dr Unit D Charlotte, NC | 1.0 | 1.0 | 634 | $1,050 | $1.66 | 5d | 1 | 1.18mi |
HOA detail
- Monthly dues
- $175 · $2,100/yr
Listing history 18 events
-
2026-06-18days on market $166,990 Active 104 DOM
-
2026-06-17days on market $166,990 Active 103 DOM
-
2026-06-16days on market $166,990 Active 102 DOM
-
2026-06-15days on market $166,990 Active 101 DOM
-
2026-06-13days on market $166,990 Active 99 DOM
-
2026-06-10days on market $166,990 Active 95 DOM
-
2026-06-08days on market $166,990 Active 94 DOM
-
2026-06-07days on market $166,990 Active 93 DOM
-
2026-06-04days on market $166,990 Active 90 DOM
-
2026-06-03days on market $166,990 Active 89 DOM
-
2026-06-02days on market $166,990 Active 88 DOM
-
2026-06-02days on market $166,990 Active 87 DOM
-
2026-05-31days on market $166,990 Active 86 DOM
-
2026-04-28price $166,990
-
2026-04-10price $169,990
-
2026-03-26price $173,990
-
2026-03-07$200,000 Active
-
2026-03-02historical $200,000
ⓘ Source: listings_history table (triggers on properties + properties_extension) + one-shot
backfill from property_details.listing_events for pre-trigger history.
Tax reassessment forecast NC · Resets to sale price
- Current annual tax
- $1,284 · $107/mo
- Projected year-2 tax
- $1,369 · $114/mo
- Expected delta
- +$86/yr (+$7/mo · 6.7%)
ⓘ Screening estimate from a state-policy table — verify with the county assessor before closing.
Climate risk First Street
- Flood 1/10 Low FEMA zone X (unshaded) · 0% chance over 30 yrs
- Wildfire 1/10 Low
- Heat 6/10 Major 7 d/yr ≥104°F today · 17 d/yr by 30 yrs out
- Wind 6/10 Major 27% chance of damaging wind over 30 yrs
- Air quality 3/10 Moderate 3 unhealthy d/yr today · 4 by 30 yrs out
Nearby sold comps map
Loading sold comps map…
Walkable amenities ~0.75 mi
Loading nearby amenities…
Taxation est. · year 1
- Rental income
- $17,969
- − Mortgage interest
- −$9,354
- − Property taxes
- −$1,284
- − Insurance
- −$835
- − Repairs & maintenance
- −$1,438
- − Management
- −$1,438
- − HOA
- −$2,100
- − Depreciation
- −$4,858
- Taxable loss
- −$3,337
- Est. tax savings @ 24.0%
- +$801
- After-tax cash flow
- $269/yr
For passive investors: Depreciation is non-cash, so a rental often shows a tax loss while cash-flowing — sheltering income. Rental losses are passive: they offset passive income freely, and up to $25,000/yr can offset ordinary (W-2) income if you actively participate and your MAGI is under $100k (phasing out to $0 by $150k); unused losses carry forward. On sale, claimed depreciation is recaptured at up to 25%, and gains may owe capital-gains tax (a 1031 exchange can defer both). Figures are a year-1 estimate at your 24.0% rate — not tax advice; consult a CPA.
Schools (NCES district)
- District
- Charlotte-Mecklenburg Schools
- NCES district ID
- 3702970
- Math proficiency
- 42% ▼ -6.00%
- Reading proficiency
- 46% ▲ 1.00%
- Median HH income
- $57,175
- Composite
- 38.49/100
- National rank
- #4183
- State rank
- #85 of 178 in NC
Livability — Charlotte
- Score
- 78/100
- State rank
- #26
- US rank
- #2502
Category grades
Schools grade is shown separately in the Schools card above.
Census & demographics
- Census place
- Charlotte, NC
- County
- Mecklenburg County · 1,167,319 people
- City population
- 920,422
- Metro
- Charlotte-Concord-Gastonia, NC-SC
- Population (ZIP)
- 66,674
- Household income
- $71,162
- Rent vs Own
- Severe rent burden
- 1952.0
Population outlook (Mecklenburg County) Hauer SSP2
- Today (2025)
- 1,305,740 people
- By 2030
- 1,442,752 · +10.5%
- By 2040
- 1,722,441 · +31.9%
- By 2050
- 1,999,450 · +53.1%
- By 2075
- 2,642,495 · +102.4%
- By 2100
- 3,106,755 · +137.9%
Race, ethnicity, and origin ACS 2023
- Neighborhood character
- Diverse neighborhood (Simpson 0.66)
- Race & ethnicity
- Black 50% Hispanic / Latino 23% White 21% Two or more races 7% Asian 3%
- Hispanic origin (detail)
- Mexican 8% Puerto Rican 1% Dominican 1%
- Common ancestry
- Slovak 1% Serbian 1% Romanian 1%
- Foreign-born
- 19% · Canada, Vietnam
- Languages at home
- 73% English-only · Spanish 19% French/Haitian/Cajun 2% Other Asian/Pacific 2%
Political lean MEDSL · Mecklenburg
- 2024 margin
- Solid D (+32.9) · D 65.6% · R 32.7% · Other 1.6%
- 2008→2024 swing
- +8.5pp toward D · 2008: 24.4pp · 2024: 32.9pp
- All cycles
- 2024: D+32.9 2020: D+35.1 2016: D+29.9 2012: D+22.5 2008: D+24.4
Not yet ingested
- Civics
- —
Market trends
- HPI YoY
- ▼ -201.15%
- Current HPI
- 286.5413
- Rent YoY
- ▲ 1.76%
- Metro
- Charlotte-Concord-Gastonia, NC-SC
- State GDP YoY
- ▲ 3.28%
- F500 in state
- 26
Industry mix (Fortune 500 HQ in NC)
| Industry | F500 HQs | Revenue |
|---|---|---|
| Financial Services | 2 | $213B |
|
||
| Retail | 2 | $95B |
|
||
| Industrial Conglomerate | 1 | $38B |
|
||
| Metals / Steel | 1 | $35B |
|
||
| Utilities | 1 | $30B |
|
||
| Industrial Machinery | 1 | $19B |
|
||
Price history
-16.5% since first listed5 events — show timeline
- 2026-04-28 Price Changed $166,990 CANOPYMLS as Distributed by MLS Grid
- 2026-04-10 Price Changed $169,990 CANOPYMLS as Distributed by MLS Grid
- 2026-03-26 Price Changed $173,990 CANOPYMLS as Distributed by MLS Grid
- 2026-03-07 Listed $200,000 CANOPYMLS as Distributed by MLS Grid
- 2026-03-02 Coming Soon $200,000 CANOPYMLS as Distributed by MLS Grid
Property tax history
+11.0%/yrLatest (2025): $1,284 · -6.1% YoY. Source: county tax records.
Cash-flow waterfall
monthlySold comps — $/sqft
last 12 mo · ≤1 miLoading sold comps…