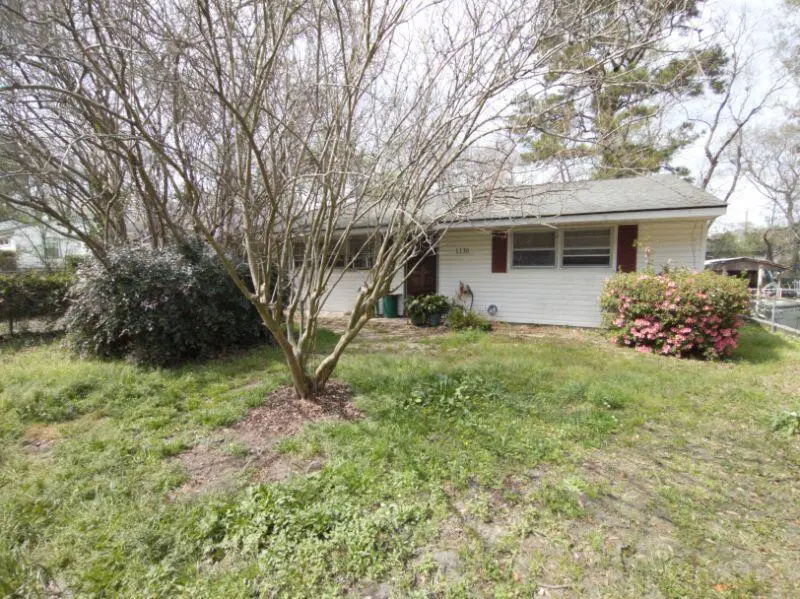
1110 Mount Batten Dr · Hanahan, SC
Flood risk 6/10 · Moderate
- FEMA flood zone
- X (unshaded)
- Chance of flooding over 30 yrs
- 0.72%
- Est. flood insurance / yr
- $507 – $1,088
Fire risk 3/10 · Minor
- Est. fire insurance / yr
- $783 – $1,453
Heat risk 9/10 · Severe
- Hot days now (above 106°F)
- 7 days/yr
- Hot days in 30 yrs
- 18 days/yr
Wind risk 9/10 · Severe
- Chance of severe wind over 30 yrs
- 99.0%
Air-quality risk 3/10 · Minor
- Unhealthy air days now
- 3 days/yr
- Unhealthy air days in 30 yrs
- 3 days/yr
Risk factors via First Street. Map © Google.
Why this score? — see what drove the B grade
The composite is a weighted blend of 9 inputs, each scored 0–100. Each bar is that input's sub-score; the figure is the points it added to the 100-point composite (weight × sub-score).
- Cash flow +30.0/30.0
- 1% rule +10.0/10.0
- DSCR +10.0/10.0
- ARV discount +7.5/15.0
- Rent growth +3.7/5.0
- Schools +3.6/10.0
- Livability +3.6/5.0
- Condition / age +2.5/5.0
- Appreciation +0.0/10.0
$125,000
🖨 Deal sheet (PDF) 📄 Offer letter ✓ Due diligence
Listing remarks
SELLER MAKING DECISION ON OFFERS 06/01/26 * * * * PROPERTY IS OCCUPIED- DO NOT APPROACH * * * Ranch in a nice neighborhood.
Key facts
- 5,662 sq ft lot
- Parking
- Built 1950
Property features AI
Exterior
- Parking: 1-car carport
- Utilities: Public sewer
- Home design: Single-family detached home; One level
- Construction: No other structures reported
- Exterior features: Other exterior features; Asphalt roof
Interior
- Kitchen: Other kitchen appliances
- Bedrooms: 3 bedrooms
- Flooring: Other flooring
- Bathrooms: 1 bathroom
- Heating & cooling: Electric heating
- Interior features: See remarks for additional interior details; Other interior features
- Laundry & utility: Other laundry/utility features
Neighborhood map
What this means for you Summary
Snapshot
- This is a 3-bed/1.0-bath single-family listed at $125k.
Deal economics
- At list price, monthly cash flow is $767 ($9k/yr) — positive.
- The deal already cash-flows at list — no discount required.
- Meets the 1% rule at list price ($2k rent vs $125k).
- Cap rate 13.7% vs local median 3.6% in Hanahan — top-decile yield for the area; either an underpriced asset or a hidden risk that comps aren't pricing in. Stress-test before assuming the spread holds.
Location & tenants
- Location reads 72/100 on livability (#45 in SC) — a middle-class / working-renter tenant base. Strengths: housing A+, employment A-, health & safety A-; Watch: amenities F, commute F.
- Berkeley 01 (suburban): math 35% / reading 48% proficiency, ranked #30 of 80 in SC (top 38%) — families likely to look elsewhere, expect single-tenant / working-renter base with shorter leases.
- Zoned schools: Hanahan Elementary (math 41% / reading 40%, grade F, #286 of 597 statewide, top 49%, 923 students, 66% FRL); Hanahan Middle (math 43% / reading 47%, grade D, #48 of 229 statewide, top 22%, 793 students, 39% FRL); Hanahan High (math 52% / reading 87%, grade B, #60 of 196 statewide, top 32%, 1,040 students, 29% FRL) — zoned schools at 45% FRL track the district average.
- Market conditions: Rents rising fast (+4.6%/yr); 72 active listings in the ZIP; 28 comparable units currently listed for rent nearby; rentals at typical pace (median 25d on market — plan ~3-4 weeks tenant-placement turnaround); solid renter incomes; 3,183 units permitted in Berkeley County in 2024 (580 in 5+ unit buildings).
Forward outlook
- Local home prices are declining (-3.0%/yr); year-one equity from $864 of loan paydown is wiped out by about $4k of value loss. Plan a longer hold.
- Berkeley County population projected at +48% by 2050 — long-run rental-demand tailwind backs the buy-and-hold thesis.
- At projected returns (-3.0% appreciation + 4.6% rent growth), your $35k cash investment doubles in ~5 years — after that, you're playing with house money.
Negotiation context
- Only 6 days on market — expect competitive offers; lowballing is unlikely to land.
Risks & watch-outs
- Watch-outs: built in 1950 — expect roof / HVAC / electrical / plumbing capex.
- Climate carrying-cost: major flood risk; severe wind risk, 99% chance of damaging wind over 30y; extreme-heat days projected 7→18/yr by 2055 (HVAC capex compounding) — expect insurance premiums to compound above CPI over the hold.
Questions for the listing agent
- Built in 1950 — when were the roof, HVAC, electrical panel, plumbing, and water heater last replaced?
- Is there a deadline driving the sale (1031 exchange, divorce, estate, relocation)? That informs how much negotiation room exists.
- What's the average days-on-market for RENTAL listings here right now (not sales)? A rising rental-DOM trend means longer vacancies and softer asking-rent achievability than the comps imply.
- What's the recent tenant-quality profile in this submarket — average credit score on applications, eviction rate, late-payment / NSF rate, and stable-employment percentage? A property-management company in the area should have these aggregated.
- How much new for-sale + rental construction is in the pipeline within 1–3 miles? Heavy new supply typically softens prices + rents 12–24 months out; constrained supply supports both.
Investment metrics
- 1% rule
- 1.56% ✓
- Cap rate
- 13.65%
- Cash-on-cash
- 26.28%
- DSCR
- 2.17
- GRM
- 5.4
CMA / ARV
- ARV (on-the-fly)
- $358,274
- Comps found
- 12
Show comp detail 12 sales within ~0.75 mi
| Address | Dist | Beds/Ba | Sqft | Sold | Price | $/sf | Match |
|---|---|---|---|---|---|---|---|
| 5830 Beverly Dr | 0.11mi | 3/1.0 | 1,095 (-4%) | 4mo | $275,000 | $251 | 84 |
| 5719 Edison Ave | 0.40mi | 3/1.0 | 1,118 (-2%) | 6mo | $250,000 | $224 | 73 |
| 5807 Robinhood Dr | 0.10mi | 3/2.0 | 1,005 (-12%) | 0mo | $238,000 | $237 | 71 |
| 1114 Yeamans Hall Rd | 0.25mi | 3/2.0 | 1,025 (-10%) | 2mo | $350,000 | $341 | 66 |
| 5812 Knight St | 0.26mi | 3/2.5 | 1,026 (-10%) | 7mo | $322,000 | $314 | 59 |
| 5918 Griffin St | 0.57mi | 3/2.0 | 1,205 (+6%) | 1mo | $265,000 | $220 | 59 |
| 5810 Knight St | 0.26mi | 3/2.5 | 1,026 (-10%) | 7mo | $322,000 | $314 | 59 |
| 5808 Knight St | 0.27mi | 3/2.5 | 1,026 (-10%) | 7mo | $329,000 | $321 | 59 |
| 5920 Griffin St | 0.57mi | 2/1.0 (-1) | 1,205 (+6%) | 1mo | $241,900 | $201 | 58 |
| 1409 Sumner Ave | 0.69mi | 3/2.0 | 1,100 (-4%) | 4mo | $415,000 | $377 | 55 |
| 1214 Hawthorne Cir | 0.63mi | 3/1.0 | 1,045 (-8%) | 4mo | $312,000 | $299 | 53 |
| 1238 Hawthorne Cir | 0.61mi | 3/2.0 | 1,035 (-9%) | 1mo | $350,000 | $338 | 52 |
Match score weights: distance 35% · size 25% · config 20% · recency 20%. Top-matched comps best support the ARV.
Projected returns pro-forma
-3.0% appreciation · 4.63% rent growth · sell at horizon
- IRR
- 21.8%
- Equity multiple
- 1.91×
- Total profit
- $31,780
- Equity at exit
- $18,638
- IRR
- 30.8%
- Equity multiple
- 3.98×
- Total profit
- $104,176
- Equity at exit
- $10,808
Cash invested: $35,000 (down + closing). Projections, not guarantees.
Landlord ↔ Tenant lean methodology
- Overall (STATE)
- 90 Strongly Landlord-Friendly
- State South Carolina
- 90 Strongly Landlord-Friendly · R+6
- County
- — inherits STATE
- City
- — inherits STATE
ZIP-level market 29410
- Rents YoY
- 4.6%
- Active inventory
- 72
- Price-to-rent
- 5.4×
Monthly cashflow live
- Estimated rent
- $1,945 high interval (Pro) →
- Mortgage (P&I)
- −$656
- Tax from tax record
- −$62 /mo · $747/yr
- Insurance
- −$52
- HOA
- −$0
- Vacancy / Maint / Mgmt
- −$408
- Net cashflow
- $767
Break-even live
Sensitivity live
| Price | -10% $837 | -5% $802 | +0% $767 | +5% $731 | +10% $696 |
|---|---|---|---|---|---|
| Rent | -10% $613 | -5% $690 | +0% $767 | +5% $843 | +10% $920 |
| Rate | -1.0pp $830 | -0.5pp $798 | base $767 | +0.5pp $734 | +1.0pp $701 |
UW: 25.0% down · 7.5% · 30yr · 1.5% tax · 5.0% vac · 8.0% maint · 8.0% mgmt
Financing live
Cash to close
- Down payment
- $31,250
- Closing costs
- $3,750
- Reserves months
- —
- Total cash needed
- —
Loan-product check · same deal, 3 products live
Conventional
25% down · 7.5% · 30yr
- Down + closing
- —
- Monthly P&I
- —
- Monthly cashflow
- —
- DSCR
- —
- Eligible?
- —
Personal DTI + credit; lowest rate.
DSCR
20% down · 8.5% · 30yr
- Down + closing
- —
- Monthly P&I
- —
- Monthly cashflow
- —
- DSCR
- —
- Eligible?
- —
No personal income docs; deal must DSCR.
Hard money
10% down · 12.0% · 12mo
- Down + closing
- —
- Monthly P&I
- —
- Monthly cashflow
- —
- DSCR
- —
- Eligible?
- —
Short-term bridge; refi at stabilization.
Rent comps 28 comps
| Address | Beds | Baths | Sqft | Rent | $/sqft | DOM | Units | Dist |
|---|---|---|---|---|---|---|---|---|
| 5812 Knight St Hanahan, SC | 3.0 | 2.5 | 1025 | $2,349 | $2.29 | 16d | 1 | 0.24mi |
| 5808 Knight St Hanahan, SC | 3.0 | 2.5 | 1025 | $2,249 | $2.19 | 4d | 1 | 0.25mi |
| 5739 Salvo ST , SC | 2.0 | 2.0 | 994 | $1,495 | $1.50 | 25d | 1 | 0.26mi |
| 5902 Park St Hanahan, SC | 3.0 | 1.0 | 1100 | $1,650 | $1.50 | 5d | 1 | 0.28mi |
| 5902 Park St Hanahan, SC | 3.0 | 1.0 | 1100 | $1,650 | $1.50 | 13d | 1 | 0.28mi |
| 5806 Sledge St Hanahan, SC | 2.0 | 2.0 | 1000 | $1,600 | $1.60 | 16d | 1 | 0.39mi |
| 5806 Sledge St Unit A Hanahan, SC | 2.0 | 1.5 | 1200 | $1,600 | $1.33 | 5d | 1 | 0.39mi |
| 5736 Pilgrim Ave Hanahan, SC | 3.0 | 1.0 | 900 | $2,150 | $2.39 | 25d | 1 | 0.42mi |
| 1441 Remount Rd Unit 12 North Charleston, SC | 3.0 | 2.0 | 1050 | $2,030 | $1.93 | 25d | 1 | 0.45mi |
| 1441 Remount Rd North Charleston, SC | 2.0–3.0 | 1.0–2.0 | 837 | $2,030 | $2.42 | 16d | 3 | 0.45mi |
| 5739 N Murray Ave Lot 7 Hanahan, SC | 3.0 | 2.5 | 1380 | $2,295 | $1.66 | 25d | 1 | 0.46mi |
| 5739 N Murray Ave Lot 7 Hanahan, SC | 3.0 | 2.5 | 1380 | $2,295 | $1.66 | 16d | 1 | 0.46mi |
| 1370 Remount Rd Apt 5 North Charleston, SC | 2.0 | 1.5 | 900 | $1,700 | $1.89 | 25d | 1 | 0.50mi |
| 1370 Remount Rd Unit 2 North Charleston, SC | 2.0 | 1.5 | 900 | $1,600 | $1.78 | 25d | 1 | 0.50mi |
| 1331 Addykay Pl North Charleston, SC | 3.0 | 2.0 | 1200 | $2,086 | $1.74 | 25d | 1 | 0.61mi |
| 1511 Larry St Charleston, SC | 3.0 | 1.0 | 967 | $2,100 | $2.17 | 25d | 1 | 0.79mi |
| 5475 Califf Rd Charleston, SC | 2.0 | 1.0 | 750 | $1,350 | $1.80 | 25d | 1 | 0.87mi |
| 5403 Torgerson Ave North Charleston, SC | 3.0 | 1.0 | 995 | $2,075 | $2.09 | 25d | 1 | 0.87mi |
| 6028 Miami St Hanahan, SC | 4.0 | 2.0 | 1200 | $2,350 | $1.96 | 25d | 1 | 0.88mi |
| 1901 Gumwood Blvd Unit F North Charleston, SC | 2.0 | 1.0 | 1100 | $900 | $0.82 | 23d | 1 | 0.91mi |
| 6248 Lucille Dr Unit 15F North Charleston, SC | 2.0 | 1.5 | 1066 | $1,530 | $1.44 | 16d | 1 | 1.26mi |
| 6220 Murray Dr Hanahan, SC | 1.0–2.0 | 1.0 | 792 | $1,263 | $1.59 | 25d | 4 | 1.29mi |
| 6211 Rolling Fork Rd Apt E North Charleston, SC | 2.0 | 2.0 | 988 | $1,700 | $1.72 | 25d | 1 | 1.32mi |
| 6280 Lucille Dr Unit D North Charleston, SC | 2.0 | 1.5 | 1066 | $1,450 | $1.36 | 25d | 1 | 1.34mi |
| 2020 Coldspring Dr North Charleston, SC | 2.0 | 2.0 | 921 | $1,700 | $1.85 | 25d | 1 | 1.36mi |
| 2020 Coldspring Dr Unit F North Charleston, SC | 2.0 | 2.0 | 921 | $1,750 | $1.90 | 25d | 1 | 1.36mi |
| 1100 River Rd Hanahan, SC | 2.0 | 1.0 | 850 | $1,245 | $1.46 | 5d | 4 | 1.47mi |
| 1946 Iron St Unit 8 North Charleston, SC | 2.0 | 1.0 | 800 | $1,200 | $1.50 | 25d | 1 | 1.49mi |
Listing history 4 events
-
2026-06-02status $125,000 Pending 6 DOM
-
2026-06-01days on market $125,000 Active 6 DOM
-
2026-05-31days on market $125,000 Active 5 DOM
-
2026-05-26$125,000 Active
ⓘ Source: listings_history table (triggers on properties + properties_extension) + one-shot
backfill from property_details.listing_events for pre-trigger history.
Tax reassessment forecast SC · Resets to sale price
- Current annual tax
- $747 · $62/mo
- Projected year-2 tax
- $747 · $62/mo
- Expected delta
- $0/yr ($0/mo · 0.0%)
ⓘ Screening estimate from a state-policy table — verify with the county assessor before closing.
Climate risk First Street
- Flood 6/10 Major FEMA zone X (unshaded) · 72% chance over 30 yrs
- Wildfire 3/10 Moderate
- Heat 9/10 Extreme 7 d/yr ≥106°F today · 18 d/yr by 30 yrs out
- Wind 9/10 Extreme 99% chance of damaging wind over 30 yrs
- Air quality 3/10 Moderate 3 unhealthy d/yr today · 3 by 30 yrs out
Nearby sold comps map
Loading sold comps map…
Walkable amenities ~0.75 mi
Loading nearby amenities…
Taxation est. · year 1
- Rental income
- $23,337
- − Mortgage interest
- −$7,002
- − Property taxes
- −$747
- − Insurance
- −$625
- − Repairs & maintenance
- −$1,867
- − Management
- −$1,867
- − Depreciation
- −$3,636
- Taxable income
- $7,594
- Est. tax owed @ 24.0%
- −$1,822
- After-tax cash flow
- $7,376/yr
For passive investors: Depreciation is non-cash, so a rental often shows a tax loss while cash-flowing — sheltering income. Rental losses are passive: they offset passive income freely, and up to $25,000/yr can offset ordinary (W-2) income if you actively participate and your MAGI is under $100k (phasing out to $0 by $150k); unused losses carry forward. On sale, claimed depreciation is recaptured at up to 25%, and gains may owe capital-gains tax (a 1031 exchange can defer both). Figures are a year-1 estimate at your 24.0% rate — not tax advice; consult a CPA.
Schools (NCES district)
- District
- Berkeley 01
- NCES district ID
- 4501170
- Math proficiency
- 35% ▼ -8.00%
- Reading proficiency
- 48% ▼ -2.00%
- Median HH income
- $52,724
- Composite
- 35.95/100
- National rank
- #4799
- State rank
- #30 of 80 in SC
Livability — Hanahan
- Score
- 72/100
- State rank
- #45
- US rank
- #6201
Category grades
Schools grade is shown separately in the Schools card above.
Census & demographics
- Census place
- Hanahan, SC
- County
- Berkeley County · 198,768 people
- City population
- 21,314
- Metro
- Charleston-North Charleston, SC
- Population (ZIP)
- 21,314
- Household income
- $87,984
- Rent vs Own
- Severe rent burden
- 727.0
Population outlook (Berkeley County) Hauer SSP2
- Today (2025)
- 254,184 people
- By 2030
- 279,677 · +10.0%
- By 2040
- 329,379 · +29.6%
- By 2050
- 375,557 · +47.8%
- By 2075
- 476,740 · +87.6%
- By 2100
- 535,945 · +110.8%
Race, ethnicity, and origin ACS 2023
- Neighborhood character
- Predominantly White (72%)
- Race & ethnicity
- White 72% Hispanic / Latino 11% Black 9% Asian 4% Two or more races 4%
- Hispanic origin (detail)
- Mexican 4% Puerto Rican 1% Cuban 1%
- Common ancestry
- Serbian 5% Italian 3% Slovak 2%
- Foreign-born
- 11% · Canada, Vietnam, Jamaica
- Languages at home
- 85% English-only · Spanish 10% Other Asian/Pacific 1% Vietnamese 1%
Political lean MEDSL · Berkeley
- 2024 margin
- R (+16.3) · D 41.1% · R 57.4% · Other 1.4%
- 2008→2024 swing
- -3.2pp toward R · 2008: -13.1pp · 2024: -16.3pp
- All cycles
- 2024: R+16.3 2020: R+11.7 2016: R+17.4 2012: R+18.9 2008: R+13.1
Not yet ingested
- Civics
- —
Market trends
- HPI YoY
- ▼ -222.05%
- Current HPI
- 326.9496
- Rent YoY
- ▲ 4.63%
- Metro
- Charleston-North Charleston, SC
- State GDP YoY
- ▲ 4.51%
- F500 in state
- 2
Industry mix (Fortune 500 HQ in SC)
| Industry | F500 HQs | Revenue |
|---|---|---|
| Packaging | 1 | $7B |
|
||
Price history
1 event — show timeline
- 2026-05-26 Listed $125,000 Charleston Trident MLS
Property tax history
+3.8%/yrLatest (2025): $747 · +6.1% YoY. Source: county tax records.
Cash-flow waterfall
monthlySold comps — $/sqft
last 12 mo · ≤1 miLoading sold comps…