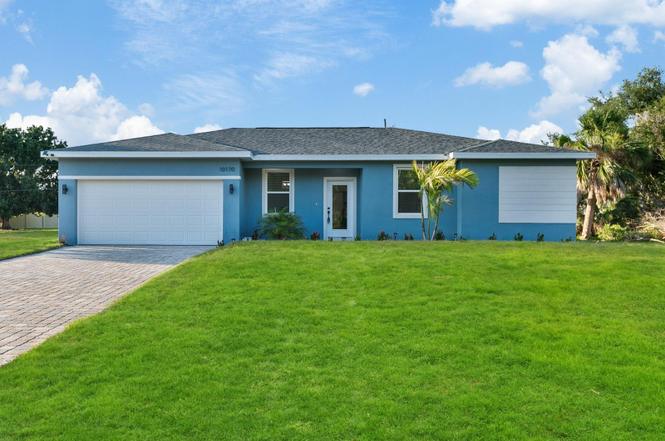
3038 Sargeant St · Port Charlotte, FL
Flood risk 8/10 · Major
- FEMA flood zone
- X (shaded)
- Chance of flooding over 30 yrs
- 0.98%
- Est. flood insurance / yr
- $507 – $1,088
Fire risk 2/10 · Minimal
- Est. fire insurance / yr
- $947 – $1,759
Heat risk 10/10 · Severe
- Hot days now (above 107°F)
- 7 days/yr
- Hot days in 30 yrs
- 27 days/yr
Wind risk 10/10 · Severe
- Chance of severe wind over 30 yrs
- 99.0%
Air-quality risk 3/10 · Minor
- Unhealthy air days now
- 2 days/yr
- Unhealthy air days in 30 yrs
- 2 days/yr
Risk factors via First Street. Map © Google.
Why this score? — see what drove the F grade
The composite is a weighted blend of 9 inputs, each scored 0–100. Each bar is that input's sub-score; the figure is the points it added to the 100-point composite (weight × sub-score).
- ARV discount +7.5/15.0
- Cash flow +7.2/30.0
- Schools +4.6/10.0
- Livability +3.2/5.0
- Condition / age +2.5/5.0
- Rent growth +2.1/5.0
- 1% rule +2.0/10.0
- DSCR +1.3/10.0
- Appreciation +0.0/10.0
$330,000
🖨 Deal sheet (PDF) 📄 Offer letter ✓ Due diligence
Listing remarks
MOVE-IN READY. Welcome to your dream home move-in ready! Be the first to experience luxury in this stunning brand new construction, boasting 4 beds and 2 baths, nestled in a serene neighborhood. Park with ease in the attached 2 car garage or on the elegant driveway adorned with pavers. Revel in the cleverly designed two-way split floor plan offering privacy and space for everyone. Embrace modern living with waterproof vinyl flooring throughout, ensuring both style and durability. Entertain effortlessly in the chic kitchen featuring granite countertops, upgraded cabinets, and a charming backsplash. Unwind in the lavish master bedroom complete with a spacious walk-in closet. With all applianc
Key facts
- Charming backsplash
- New construction
- Granite countertops
Tags
Property features AI
Finance
- Other: Property type: Residential - Single family residence; Zoning: RSF3.5; Living area approximately 1,636 (public records); total building area approximately 2,079; Lot size approximately 0.23 acres (about 929 m²); Permit number 20220624979; Builder model: 1636
Exterior
- Parking: Attached garage with 2 spaces
- Utilities: Well water; Septic tank; Electricity available and connected; Cable available; Sewer connected; Water available
- Home design: Single family residence; One-story; Faces west; New construction (completed / projected completion Mar 31, 2026)
- Construction: Block and stucco construction; Shingle roof; Slab foundation; Built by AMERISTAR GROUP INC
- Exterior features: Hurricane shutters; Paved road access; Lot dimensions approximately 80 x 125
Interior
- Kitchen: Dishwasher; Disposal; Microwave; Range; Refrigerator
- Bedrooms: 4 bedrooms
- Flooring: Vinyl
- Bathrooms: 2 full bathrooms
- Heating & cooling: Central heating (electric); Central air conditioning
- Interior features: Ceiling fans; High ceilings; Living room / dining room combo; Open floorplan; Solid surface counters; Thermostat
- Laundry & utility: Dedicated laundry room
Neighborhood map
What this means for you Summary
Snapshot
- This is a 4-bed/2.0-bath land listed at $330k.
Deal economics
- At list price, monthly cash flow is $-526 ($-6k/yr) — negative.
- To cash-flow at today's rent, offer at most $254k (23.0% below list).
- To meet the 1% rule (rent ≥ 1% of price), the offer needs to be $231k (30.1% below list).
- Recommended offer: $231k (30.1% below list) — sets the bar for 1% rule.
Location & tenants
- Location reads 65/100 on livability (#655 in FL) — a middle-class / working-renter tenant base. Strengths: cost of living A+, housing A+; Watch: employment D, amenities F, commute F.
- Charlotte (suburban): math 54% / reading 54% proficiency, ranked #22 of 73 in FL (top 30%) — acceptable for families but not a draw, mixed tenant base, ~2y average lease.
- Zoned schools: Meadow Park Elementary School (math 61% / reading 56%, grade B-, #735 of 2,144 statewide, top 35%, 701 students, 59% FRL); Murdock Middle School (math 50% / reading 45%, grade C-, #288 of 571 statewide, top 51%, 577 students, 56% FRL); Port Charlotte High School (math 23% / reading 38%, grade F, #434 of 667 statewide, top 66%, 1,649 students, 43% FRL) — zoned schools at 53% FRL track the district average.
- Market conditions: Rents soft (-1.6%/yr); 963 active listings in the ZIP; 27 comparable units currently listed for rent nearby; rentals at typical pace (median 23d on market — plan ~3-4 weeks tenant-placement turnaround); 4,585 units permitted in Charlotte County in 2024 (703 in 5+ unit buildings).
- This rent runs 44% of the median local income ($63k/yr) — at the standard rent-burdened threshold; future hikes will face affordability resistance.
Forward outlook
- Local home prices are declining (-3.0%/yr); year-one equity from $2k of loan paydown is wiped out by about $10k of value loss. Plan a longer hold.
- Charlotte County population projected at +24% by 2050 — long-run rental-demand tailwind backs the buy-and-hold thesis.
Negotiation context
- It's been on market 492 days — a 12% lower offer ($290k) is reasonable based on typical stale-listing flexibility.
- 4 sale attempts since 2y ago; this cycle's ask is 13100% above the opening price — seller raised mid-cycle; expect resistance to lowballs.
- Current owner paid $112k; list at $330k implies a 195% gain — meaningful room to come down on a strong offer.
Risks & watch-outs
- Watch-outs: flood insurance adds $66/mo.
- Climate carrying-cost: severe flood risk; severe wind risk, 99% chance of damaging wind over 30y; extreme-heat days projected 7→27/yr by 2055 (HVAC capex compounding) — expect insurance premiums to compound above CPI over the hold.
Questions for the listing agent
- What do current leases actually rent for vs. the listed asking? Can we see a recent rent roll and the last 12 months of T-12 income?
- It's been on market 492 days. Have you received any prior offers? Is the seller open to a 30% concession, seller financing, or rate buy-down credit?
- What's the actual annual flood-insurance premium (NFIP or private), and is the property in a SFHA with mandatory coverage?
- Why hasn't it sold? Are there any deal-killer items the seller is aware of (foundation, flood, title, zoning, code violations)?
- Is there a deadline driving the sale (1031 exchange, divorce, estate, relocation)? That informs how much negotiation room exists.
- Schools are D-rated, which usually means shorter tenancies and higher turnover. Who's the typical renter profile here, and what's been the actual vacancy rate?
- The area grade is low — what's the realistic commute time and amenity access for the typical tenant pool here? Any planned neighborhood developments (good or bad) we should know about?
- What's the average days-on-market for RENTAL listings here right now (not sales)? A rising rental-DOM trend means longer vacancies and softer asking-rent achievability than the comps imply.
- What's the recent tenant-quality profile in this submarket — average credit score on applications, eviction rate, late-payment / NSF rate, and stable-employment percentage? A property-management company in the area should have these aggregated.
- How much new for-sale + rental construction is in the pipeline within 1–3 miles? Heavy new supply typically softens prices + rents 12–24 months out; constrained supply supports both.
Investment metrics
- 1% rule
- 0.70% ✗
- Cap rate
- 4.62%
- Cash-on-cash
- -5.96%
- DSCR
- 0.73
- GRM
- 11.9
CMA / ARV
No comps found within radius.
Projected returns pro-forma
-3.0% appreciation · 0.0% rent growth · sell at horizon
- IRR
- -31.6%
- Equity multiple
- -0.01×
- Total profit
- $-93,626
- Equity at exit
- $49,204
- IRR
- -57.4%
- Equity multiple
- -0.63×
- Total profit
- $-150,433
- Equity at exit
- $28,532
Cash invested: $92,400 (down + closing). Projections, not guarantees.
Landlord ↔ Tenant lean methodology
- Overall (STATE)
- 87 Strongly Landlord-Friendly
- State Florida
- 87 Strongly Landlord-Friendly · R+3
- County
- — inherits STATE
- City
- — inherits STATE
ZIP-level market 33948
- Home prices YoY
- -14.9%
- Rents YoY
- -1.6%
- Active inventory
- 963
- Price-to-rent
- 11.9×
Monthly cashflow live
- Estimated rent
- $2,306 high interval (Pro) →
- Mortgage (P&I)
- −$1,731
- Tax est. 1.5%
- −$412 /mo · $4,950/yr
- Insurance
- −$138
- Flood insurance flood zone
- −$66 /mo · $798/yr
- HOA
- −$0
- Vacancy / Maint / Mgmt
- −$484
- Net cashflow
- $-526
Break-even live
Sensitivity live
| Price | -10% $-297 | -5% $-411 | +0% $-526 | +5% $-640 | +10% $-754 |
|---|---|---|---|---|---|
| Rent | -10% $-708 | -5% $-617 | +0% $-526 | +5% $-434 | +10% $-343 |
| Rate | -1.0pp $-359 | -0.5pp $-442 | base $-526 | +0.5pp $-611 | +1.0pp $-698 |
UW: 25.0% down · 7.5% · 30yr · 1.5% tax · 5.0% vac · 8.0% maint · 8.0% mgmt
Financing live
Cash to close
- Down payment
- $82,500
- Closing costs
- $9,900
- Reserves months
- —
- Total cash needed
- —
Loan-product check · same deal, 3 products live
Conventional
25% down · 7.5% · 30yr
- Down + closing
- —
- Monthly P&I
- —
- Monthly cashflow
- —
- DSCR
- —
- Eligible?
- —
Personal DTI + credit; lowest rate.
DSCR
20% down · 8.5% · 30yr
- Down + closing
- —
- Monthly P&I
- —
- Monthly cashflow
- —
- DSCR
- —
- Eligible?
- —
No personal income docs; deal must DSCR.
Hard money
10% down · 12.0% · 12mo
- Down + closing
- —
- Monthly P&I
- —
- Monthly cashflow
- —
- DSCR
- —
- Eligible?
- —
Short-term bridge; refi at stabilization.
Rent comps 27 comps
| Address | Beds | Baths | Sqft | Rent | $/sqft | DOM | Units | Dist |
|---|---|---|---|---|---|---|---|---|
| 2457 Haven St Port Charlotte, FL | 3.0 | 2.0 | 1150 | $1,775 | $1.54 | 23d | 1 | 0.21mi |
| 18423 Elgin Ave Port Charlotte, FL | 4.0 | 2.0 | 1636 | $2,200 | $1.34 | 23d | 1 | 0.47mi |
| 3153 Jody St Port Charlotte, FL | 4.0 | 2.0 | 1650 | $1,945 | $1.18 | 23d | 1 | 0.57mi |
| 2223 Tinker St Port Charlotte, FL | 3.0 | 2.0 | 1337 | $2,400 | $1.80 | 23d | 1 | 0.69mi |
| 17424 Poston Ave Port Charlotte, FL | 4.0 | 2.0 | 1833 | $1,925 | $1.05 | 15d | 1 | 0.75mi |
| 1225 Armsdale Ave Port Charlotte, FL | 3.0 | 2.0 | 1140 | $1,525 | $1.34 | 23d | 1 | 0.77mi |
| 18353 Grace Ave Port Charlotte, FL | 3.0 | 2.0 | 1658 | $2,100 | $1.27 | 23d | 1 | 0.79mi |
| 2144 Pellam Blvd Port Charlotte, FL | 4.0 | 2.5 | 1751 | $2,106 | $1.20 | 15d | 1 | 0.96mi |
| 1148 Salina Ave Port Charlotte, FL | 3.0 | 2.0 | 1449 | $3,000 | $2.07 | 23d | 1 | 1.03mi |
| 17319 Terry Ave Port Charlotte, FL | 3.0 | 2.0 | 1478 | $2,095 | $1.42 | 23d | 1 | 1.03mi |
| 18522 Robinson Ave Port Charlotte, FL | 3.0 | 2.0 | 1252 | $2,000 | $1.60 | 23d | 1 | 1.17mi |
| 1011 Tropical Ave NW Port Charlotte, FL | 3.0 | 2.0 | 1558 | $1,950 | $1.25 | 23d | 1 | 1.19mi |
| 979 Roseway Ter NW Port Charlotte, FL | 3.0 | 1.5 | 1140 | $1,525 | $1.34 | 23d | 1 | 1.24mi |
| 4192 Gingold St Port Charlotte, FL | 3.0 | 2.0 | 1127 | $4,200 | $3.73 | 23d | 1 | 1.26mi |
| 1000 Chevy Chase St Port Charlotte, FL | 3.0 | 2.0 | 1589 | $3,500 | $2.20 | 23d | 1 | 1.28mi |
| 1275 Price Cir NW Port Charlotte, FL | 3.0 | 2.0 | 1810 | $1,700 | $0.94 | 23d | 1 | 1.29mi |
| 2113 Como St Port Charlotte, FL | 3.0 | 2.0 | 1162 | $1,500 | $1.29 | 23d | 1 | 1.31mi |
| 18312 Driggers Ave Port Charlotte, FL | 3.0 | 2.0 | 1428 | $5,400 | $3.78 | 23d | 1 | 1.31mi |
| 945 Chevy Chase St Port Charlotte, FL | 3.0 | 2.0 | 1582 | $2,875 | $1.82 | 23d | 1 | 1.36mi |
| 17051 Greenan Ave Port Charlotte, FL | 4.0 | 2.0 | 1833 | $1,995 | $1.09 | 15d | 1 | 1.43mi |
| 651 Chamber St NW Port Charlotte, FL | 3.0 | 2.0 | 1196 | $1,900 | $1.59 | 23d | 1 | 1.44mi |
| 262 Grenada St Port Charlotte, FL | 3.0 | 2.0 | 1650 | $1,845 | $1.12 | 23d | 1 | 1.45mi |
| 18608 Alphonse Cir Port Charlotte, FL | 3.0 | 2.0 | 1441 | $4,000 | $2.78 | 23d | 1 | 1.47mi |
| 2233 Fraser St Unit 2235 Port Charlotte, FL | 3.0 | 2.0 | 1162 | $1,647 | $1.42 | 23d | 1 | 1.47mi |
| 2225 Fraser St Port Charlotte, FL | 3.0 | 2.0 | 1600 | $2,500 | $1.56 | 15d | 1 | 1.48mi |
| 4232 Swensson St Port Charlotte, FL | 4.0 | 2.5 | 2054 | $2,245 | $1.09 | 15d | 1 | 1.48mi |
| 2022 Dorion St Port Charlotte, FL | 3.0 | 2.0 | 1200 | $1,695 | $1.41 | 15d | 1 | 1.49mi |
Listing history 28 events
-
2026-06-18days on market $330,000 Active 492 DOM
-
2026-06-17days on market $330,000 Active 491 DOM
-
2026-06-16days on market $330,000 Active 490 DOM
-
2026-06-15days on market $330,000 Active 489 DOM
-
2026-06-14days on market $330,000 Active 487 DOM
-
2026-06-13days on market $330,000 Active 486 DOM
-
2026-06-10days on market $330,000 Active 484 DOM
-
2026-06-09days on market $330,000 Active 483 DOM
-
2026-06-08days on market $330,000 Active 482 DOM
-
2026-06-05days on market $330,000 Active 478 DOM
-
2026-06-02days on market $330,000 Active 476 DOM
-
2026-06-01days on market $330,000 Active 475 DOM
-
2026-05-31days on market $330,000 Active 474 DOM
-
2026-05-30days on market $330,000 Active 473 DOM
-
2026-03-27price $330,000
-
2026-03-01price $350,000
-
2026-01-26price $359,000
-
2026-01-25price $2,300
-
2025-12-25$2,500
-
2025-12-21status Active
-
2025-12-13historical
-
2025-12-04price $360,000
-
2025-09-13price $375,000
-
2025-02-03$380,000 Active
-
2024-12-29historical
-
2024-06-29$380,000 Active
-
2022-10-24soldstatus $112,000
-
2022-01-10soldstatus $10,500
ⓘ Source: listings_history table (triggers on properties + properties_extension) + one-shot
backfill from property_details.listing_events for pre-trigger history.
Climate risk First Street
- Flood 8/10 Severe FEMA zone X (shaded) · 98% chance over 30 yrs
- Wildfire 2/10 Low
- Heat 10/10 Extreme 7 d/yr ≥107°F today · 27 d/yr by 30 yrs out
- Wind 10/10 Extreme 99% chance of damaging wind over 30 yrs
- Air quality 3/10 Moderate 2 unhealthy d/yr today · 2 by 30 yrs out
Nearby sold comps map
Loading sold comps map…
Walkable amenities ~0.75 mi
Loading nearby amenities…
Taxation est. · year 1
- Rental income
- $27,668
- − Mortgage interest
- −$18,485
- − Property taxes
- −$4,950
- − Insurance
- −$2,448
- − Repairs & maintenance
- −$2,213
- − Management
- −$2,213
- − Depreciation
- −$9,600
- Taxable loss
- −$12,241
- Est. tax savings @ 24.0%
- +$2,938
- After-tax cash flow
- $-3,368/yr
For passive investors: Depreciation is non-cash, so a rental often shows a tax loss while cash-flowing — sheltering income. Rental losses are passive: they offset passive income freely, and up to $25,000/yr can offset ordinary (W-2) income if you actively participate and your MAGI is under $100k (phasing out to $0 by $150k); unused losses carry forward. On sale, claimed depreciation is recaptured at up to 25%, and gains may owe capital-gains tax (a 1031 exchange can defer both). Figures are a year-1 estimate at your 24.0% rate — not tax advice; consult a CPA.
Schools (NCES district)
- District
- Charlotte
- NCES district ID
- 1200240
- Math proficiency
- 54% ▼ -6.00%
- Reading proficiency
- 54% ▼ -1.00%
- Median HH income
- $44,864
- Composite
- 45.62/100
- National rank
- #2586
- State rank
- #22 of 73 in FL
Livability — Port Charlotte
- Score
- 65/100
- State rank
- #655
- US rank
- #13081
Category grades
Schools grade is shown separately in the Schools card above.
Census & demographics
- Census place
- Port Charlotte, FL
- County
- Charlotte County · 196,994 people
- City population
- 102,180
- Metro
- Punta Gorda, FL
- Population (ZIP)
- 18,696
- Household income
- $62,744
- Rent vs Own
- Severe rent burden
- 501.0
Population outlook (Charlotte County) Hauer SSP2
- Today (2025)
- 198,646 people
- By 2030
- 210,507 · +6.0%
- By 2040
- 230,857 · +16.2%
- By 2050
- 247,148 · +24.4%
- By 2075
- 281,777 · +41.8%
- By 2100
- 293,609 · +47.8%
Race, ethnicity, and origin ACS 2023
- Neighborhood character
- Predominantly White (79%)
- Race & ethnicity
- White 79% Two or more races 8% Black 7% Hispanic / Latino 7% Asian 2%
- Hispanic origin (detail)
- Mexican 2% Puerto Rican 1%
- Common ancestry
- Lithuanian 5% Romanian 4% Iranian 2%
- Foreign-born
- 11% · Canada
- Languages at home
- 88% English-only · Spanish 5% Russian/Polish/Slavic 2% Other Indo-European 1%
Political lean MEDSL · Charlotte
- 2024 margin
- Solid R (+34.0) · D 32.7% · R 66.7%
- 2008→2024 swing
- -26.7pp toward R · 2008: -7.2pp · 2024: -34.0pp
- All cycles
- 2024: R+34.0 2020: R+26.6 2016: R+27.8 2012: R+14.3 2008: R+7.2
Not yet ingested
- Civics
- —
Market trends
- HPI YoY
- ▼ -55.31%
- Current HPI
- 315.0548
- Rent YoY
- ▼ -1.63%
- Metro
- Punta Gorda, FL
- State GDP YoY
- ▲ 3.28%
- F500 in state
- 36
Industry mix (Fortune 500 HQ in FL)
| Industry | F500 HQs | Revenue |
|---|---|---|
| Industrial Technology | 2 | $29B |
|
||
| Insurance | 2 | $17B |
|
||
| Retail | 1 | $60B |
|
||
| Technology Distribution | 1 | $58B |
|
||
| Homebuilding | 1 | $35B |
|
||
| Technology Manufacturing | 1 | $35B |
|
||
Price history
+3042.9% since first listed14 events — show timeline
- 2026-03-27 Price Changed $330,000 Stellar MLS as Distributed by MLS Grid
- 2026-03-01 Price Changed $350,000 Stellar MLS as Distributed by MLS Grid
- 2026-01-26 Price Changed $359,000 Stellar MLS as Distributed by MLS Grid
- 2026-01-25 Price Changed $2,300 STELLARMLS
- 2025-12-25 Listed for Rent $2,500 STELLARMLS
- 2025-12-21 Relisted — Stellar MLS as Distributed by MLS Grid
- 2025-12-13 Listing Removed — Stellar MLS as Distributed by MLS Grid
- 2025-12-04 Price Changed $360,000 Stellar MLS as Distributed by MLS Grid
- 2025-09-13 Price Changed $375,000 Stellar MLS as Distributed by MLS Grid
- 2025-02-03 Listed $380,000 Stellar MLS as Distributed by MLS Grid
- 2024-12-29 Listing Removed — Stellar MLS as Distributed by MLS Grid
- 2024-06-29 Listed $380,000 Stellar MLS as Distributed by MLS Grid
- 2022-10-24 Sold (Public Records) $112,000 Public Records
- 2022-01-10 Sold (Public Records) $10,500 Public Records
Property tax history
+3.6%/yrLatest (2025): $479 · -4.9% YoY. Source: county tax records.
Cash-flow waterfall
monthlySold comps — $/sqft
last 12 mo · ≤1 miLoading sold comps…