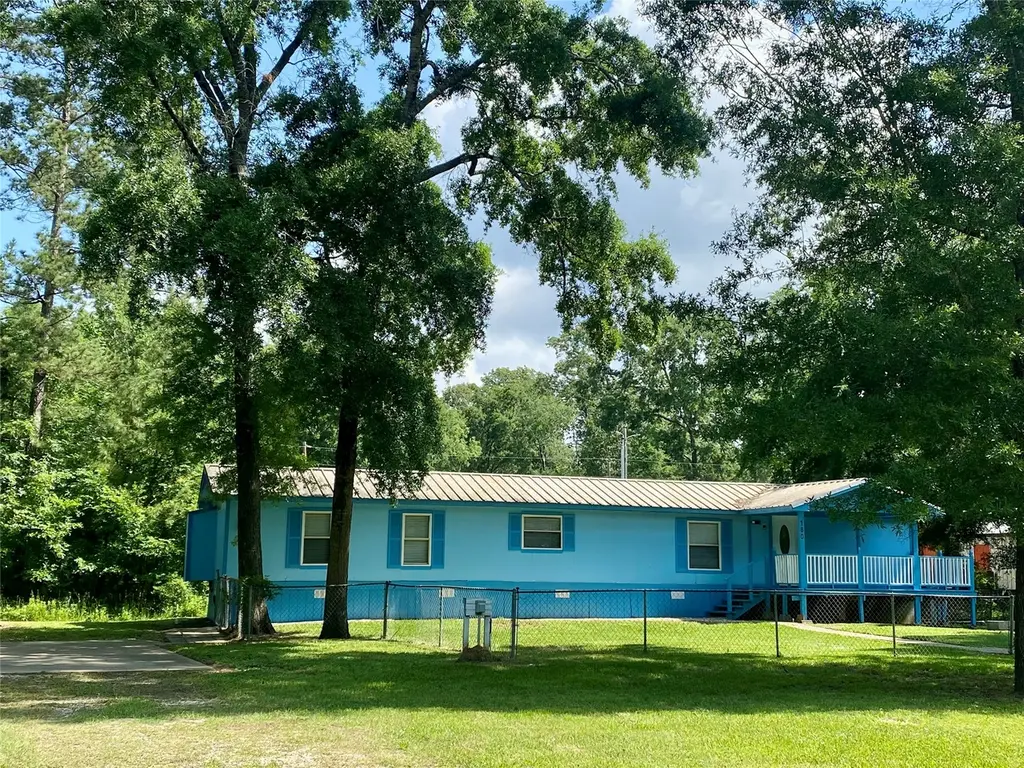
160 Champion Way · West Livingston, TX
Flood risk 1/10 · Minimal
- FEMA flood zone
- X (unshaded)
- Chance of flooding over 30 yrs
- 0.0%
- Est. flood insurance / yr
- $507 – $1,088
Fire risk 4/10 · Minor
- Est. fire insurance / yr
- $1,222 – $2,270
Heat risk 8/10 · Major
- Hot days now (above 112°F)
- 7 days/yr
- Hot days in 30 yrs
- 24 days/yr
Wind risk 8/10 · Major
- Chance of severe wind over 30 yrs
- 98.0%
Air-quality risk 1/10 · Minimal
- Unhealthy air days now
- 0 days/yr
- Unhealthy air days in 30 yrs
- 0 days/yr
Risk factors via First Street. Map © Google.
Why this score? — see what drove the C- grade
The composite is a weighted blend of 9 inputs, each scored 0–100. Each bar is that input's sub-score; the figure is the points it added to the 100-point composite (weight × sub-score).
- Cash flow +20.9/30.0
- ARV discount +8.9/15.0
- DSCR +6.6/10.0
- 1% rule +5.8/10.0
- Schools +3.2/10.0
- Rent growth +2.5/5.0
- Livability +2.5/5.0
- Condition / age +2.5/5.0
- Appreciation +0.0/10.0
$109,900
🖨 Deal sheet (PDF) 📄 Offer letter ✓ Due diligence
Listing remarks
Huge Price Drop!! on this Nice 2 bedroom 2 bath Manufactured Lake Home in Lake Livingston Village. This Great Lake House comes with 3 Lots and is Move-In ready and Remodeled to include new painted Cabinets and Rooms, New Grey Carpet, Deck and Exterior, 1 year old Water Heater and Refrigerator included. There is an Extra room off the Kitchen for Storage or Office. Check out the Huge Deck and Fenced Front Yard with Large Trees for your Lake House Enjoyment! 3rd Lot has a concrete pad with RV hookup or put an additional Manufactured Home for Great Investment Opportunity. Community has Parks, Pavilion and Boat Ramp for access to Beautiful Lake Livingston!
Key facts
- Remodeled
- 3 lots
- Huge deck
Tags
Property features AI
Finance
- Other: Seller disclosure available
- Financial info: Lease not considered
- HOA & community: Part of Lake Livingston Village POA; Community amenities include boat ramp, picnic area, playground, and guard; Annual association fee
Exterior
- Parking: No parking details provided
- Security: Smoke detector(s)
- Utilities: Public water; Public sewer
- Home design: Residential property; Single-story entry (first floor rooms listed); Full ownership
- Construction: Built in 1995; Block foundation; Metal roof
- Exterior features: Covered patio; Patio; Deck; Partial fencing; Tennis court(s); Cleared lot in a subdivision; Has additional parcel(s)
Interior
- Kitchen: Dishwasher; Electric oven; Electric range; Free‑standing range; Microwave; Oven; Refrigerator
- Bedrooms: Primary bedroom (First floor) 14x12; Bedroom (First floor) 12x11; Total of 2 bedrooms noted (plus additional finished rooms)
- Flooring: Carpet; Vinyl
- Bathrooms: 2 full bathrooms
- Heating & cooling: Central heating (electric); Central air conditioning (electric)
- Interior features: Breakfast bar; Crown molding; Kitchen and family room combined; Kitchen and dining area combined; Living and dining area; Tub with shower
- Laundry & utility: Washer; Dryer; Electric dryer hookup; Utility room (First floor) 9x6
Neighborhood map
What this means for you Summary
Snapshot
- This is a 2-bed/2.0-bath single-family listed at $110k.
Deal economics
- At list price, monthly cash flow is $153 ($2k/yr) — positive.
- The deal already cash-flows at list — no discount required.
- Meets the 1% rule at list price ($1k rent vs $110k).
- Recommended offer: $107k (3.0% below list) — sets the bar for market timing.
- Cap rate 8.0% vs local median 2.4% in West Livingston — top-decile yield for the area; either an underpriced asset or a hidden risk that comps aren't pricing in. Stress-test before assuming the spread holds.
Location & tenants
- Location reads 50/100 on livability (#1,501 in TX) — a working-class tenant base; expect higher turnover. Strengths: cost of living A+, housing A+; Watch: crime F, amenities F, commute F.
- Livingston ISD (rural): math 38% / reading 39% proficiency, ranked #459 of 826 in TX (top 56%) — families likely to look elsewhere, expect single-tenant / working-renter base with shorter leases.
- Zoned schools: Timber Creek El (math 56% / reading 47%, grade C-, #808 of 4,322 statewide, top 19%, 522 students, 74% FRL); Livingston J H (math 30% / reading 32%, grade F, #1,015 of 1,662 statewide, top 62%, 893 students, 62% FRL); Livingston H S (math 35% / reading 46%, grade F, #798 of 1,632 statewide, top 49%, 1,128 students, 51% FRL) — zoned schools at 63% FRL track the district average.
- Market conditions: 1202 active listings in the ZIP; 769 units permitted in Polk County in 2024 (0 in 5+ unit buildings).
Forward outlook
- Local home prices are declining (-3.0%/yr); year-one equity from $760 of loan paydown is wiped out by about $3k of value loss. Plan a longer hold.
- Polk County population projected at +16% by 2050 — long-run rental-demand tailwind backs the buy-and-hold thesis.
Negotiation context
- It's been on market 38 days — a 3% lower offer ($107k) is reasonable based on typical stale-listing flexibility.
- 3 sale attempts with the ask held roughly flat each time — persistent listings suggest the price (not the market) is what's stuck; bring a comps-based counter.
- Current owner paid $10; list at $110k implies a 1098900% gain — meaningful room to come down on a strong offer.
Risks & watch-outs
- Climate carrying-cost: severe wind risk, 98% chance of damaging wind over 30y; extreme-heat days projected 7→24/yr by 2055 (HVAC capex compounding) — expect insurance premiums to compound above CPI over the hold.
Questions for the listing agent
- It's been on market 38 days. Have you received any prior offers? Is the seller open to a 3% concession, seller financing, or rate buy-down credit?
- What does the HOA fee cover, when was the last increase, and are there any pending special assessments or reserve-fund shortfalls?
- Is there a deadline driving the sale (1031 exchange, divorce, estate, relocation)? That informs how much negotiation room exists.
- Schools are F-rated, which usually means shorter tenancies and higher turnover. Who's the typical renter profile here, and what's been the actual vacancy rate?
- Crime grade is F in this area — have there been break-ins, vandalism, or insurance claims at this property in the last 3 years? What carrier currently insures it and at what premium?
- What's the average days-on-market for RENTAL listings here right now (not sales)? A rising rental-DOM trend means longer vacancies and softer asking-rent achievability than the comps imply.
- What's the recent tenant-quality profile in this submarket — average credit score on applications, eviction rate, late-payment / NSF rate, and stable-employment percentage? A property-management company in the area should have these aggregated.
- How much new for-sale + rental construction is in the pipeline within 1–3 miles? Heavy new supply typically softens prices + rents 12–24 months out; constrained supply supports both.
Investment metrics
- 1% rule
- 1.08% ✓
- Cap rate
- 7.96%
- Cash-on-cash
- 5.95%
- DSCR
- 1.26
- GRM
- 7.7
CMA / ARV
- ARV (median comp)
- $113,380
- List price
- $109,900
- Delta
- 1.34%
- Verdict
- FAIR
- Comps
- 3 within 1.0 mi
Show comp detail 1 sale within ~0.75 mi
| Address | Dist | Beds/Ba | Sqft | Sold | Price | $/sf | Match |
|---|---|---|---|---|---|---|---|
| 3209 Mangum Rd | 0.65mi | 2/1.0 | 1,080 (+8%) | 15mo | $189,000 | $175 | 40 |
Match score weights: distance 35% · size 25% · config 20% · recency 20%. Top-matched comps best support the ARV.
Projected returns pro-forma
-3.0% appreciation · 3.0% rent growth · sell at horizon
- IRR
- -7.1%
- Equity multiple
- 0.74×
- Total profit
- $-8,060
- Equity at exit
- $16,386
- IRR
- 2.5%
- Equity multiple
- 1.18×
- Total profit
- $5,628
- Equity at exit
- $9,502
Cash invested: $30,772 (down + closing). Projections, not guarantees.
Landlord ↔ Tenant lean methodology
- Overall (STATE)
- 87 Strongly Landlord-Friendly
- State Texas
- 87 Strongly Landlord-Friendly · R+5
- County
- — inherits STATE
- City
- — inherits STATE
ZIP-level market 77351
- Home prices YoY
- -14.8%
- Active inventory
- 1202
- Price-to-rent
- 7.7×
Monthly cashflow live
- Estimated rent
- $1,187 medium interval (Pro) →
- Mortgage (P&I)
- −$576
- Tax est. 1.5%
- −$137 /mo · $1,648/yr
- Insurance
- −$46
- HOA
- −$26
- Vacancy / Maint / Mgmt
- −$249
- Net cashflow
- $153
Break-even live
Sensitivity live
| Price | -10% $228 | -5% $191 | +0% $153 | +5% $115 | +10% $77 |
|---|---|---|---|---|---|
| Rent | -10% $59 | -5% $106 | +0% $153 | +5% $199 | +10% $246 |
| Rate | -1.0pp $208 | -0.5pp $180 | base $153 | +0.5pp $124 | +1.0pp $95 |
UW: 25.0% down · 7.5% · 30yr · 1.5% tax · 5.0% vac · 8.0% maint · 8.0% mgmt
Financing live
Cash to close
- Down payment
- $27,475
- Closing costs
- $3,297
- Reserves months
- —
- Total cash needed
- —
Loan-product check · same deal, 3 products live
Conventional
25% down · 7.5% · 30yr
- Down + closing
- —
- Monthly P&I
- —
- Monthly cashflow
- —
- DSCR
- —
- Eligible?
- —
Personal DTI + credit; lowest rate.
DSCR
20% down · 8.5% · 30yr
- Down + closing
- —
- Monthly P&I
- —
- Monthly cashflow
- —
- DSCR
- —
- Eligible?
- —
No personal income docs; deal must DSCR.
Hard money
10% down · 12.0% · 12mo
- Down + closing
- —
- Monthly P&I
- —
- Monthly cashflow
- —
- DSCR
- —
- Eligible?
- —
Short-term bridge; refi at stabilization.
HOA detail
- Monthly dues
- $26 · $312/yr
- Likely covers
- water
Listing history 23 events
-
2026-06-22remarks 659-char remark
-
2026-06-22price $109,900 Active 38 DOM
-
2026-06-21days on market $114,900 Active 38 DOM
-
2026-06-18days on market $114,900 Active 35 DOM
-
2026-06-17days on market $114,900 Active 34 DOM
-
2026-06-16days on market $114,900 Active 33 DOM
-
2026-06-15days on market $114,900 Active 32 DOM
-
2026-06-13days on market $114,900 Active 30 DOM
-
2026-06-09days on market $114,900 Active 26 DOM
-
2026-06-08days on market $114,900 Active 25 DOM
-
2026-06-07days on market $114,900 Active 24 DOM
-
2026-06-04days on market $114,900 Active 21 DOM
-
2026-06-03days on market $114,900 Active 20 DOM
-
2026-06-02days on market $114,900 Active 19 DOM
-
2026-06-01days on market $114,900 Active 18 DOM
-
2026-05-31days on market $114,900 Active 17 DOM
-
2026-05-14historical
-
2026-05-14$114,900 Active 657-char remark
-
2026-04-02$116,900 Active
-
2026-04-02historical
-
2026-02-09$119,900 Active
-
2026-01-05soldstatus $10
-
2019-01-23soldstatus
ⓘ Source: listings_history table (triggers on properties + properties_extension) + one-shot
backfill from property_details.listing_events for pre-trigger history.
Climate risk First Street
- Flood 1/10 Low FEMA zone X (unshaded) · 0% chance over 30 yrs
- Wildfire 4/10 Moderate
- Heat 8/10 Severe 7 d/yr ≥112°F today · 24 d/yr by 30 yrs out
- Wind 8/10 Severe 98% chance of damaging wind over 30 yrs
- Air quality 1/10 Low 0 unhealthy d/yr today · 0 by 30 yrs out
Nearby sold comps map
Loading sold comps map…
Walkable amenities ~0.75 mi
Loading nearby amenities…
Taxation est. · year 1
- Rental income
- $14,248
- − Mortgage interest
- −$6,156
- − Property taxes
- −$1,648
- − Insurance
- −$550
- − Repairs & maintenance
- −$1,140
- − Management
- −$1,140
- − HOA
- −$312
- − Depreciation
- −$3,197
- Taxable income
- $105
- Est. tax owed @ 24.0%
- −$25
- After-tax cash flow
- $1,805/yr
For passive investors: Depreciation is non-cash, so a rental often shows a tax loss while cash-flowing — sheltering income. Rental losses are passive: they offset passive income freely, and up to $25,000/yr can offset ordinary (W-2) income if you actively participate and your MAGI is under $100k (phasing out to $0 by $150k); unused losses carry forward. On sale, claimed depreciation is recaptured at up to 25%, and gains may owe capital-gains tax (a 1031 exchange can defer both). Figures are a year-1 estimate at your 24.0% rate — not tax advice; consult a CPA.
Schools (NCES district)
- District
- Livingston ISD
- NCES district ID
- 4827780
- Math proficiency
- 38% ▼ -1.00%
- Reading proficiency
- 39% ▲ 3.00%
- Median HH income
- $39,531
- Composite
- 32.25/100
- National rank
- #5767
- State rank
- #459 of 826 in TX
Livability — West Livingston
- Score
- 50/100
- State rank
- #1501
- US rank
- #25668
Category grades
Schools grade is shown separately in the Schools card above.
Census & demographics
- Census place
- West Livingston, TX
- County
- Polk County · 37,143 people
- Metro
- nan
- Population (ZIP)
- 37,143
- Household income
- $66,834
- Rent vs Own
- Severe rent burden
- 608.0
Population outlook (Polk County) Hauer SSP2
- Today (2025)
- 51,049 people
- By 2030
- 53,243 · +4.3%
- By 2040
- 56,528 · +10.7%
- By 2050
- 59,243 · +16.1%
- By 2075
- 63,528 · +24.4%
- By 2100
- 60,376 · +18.3%
Race, ethnicity, and origin ACS 2023
- Neighborhood character
- Predominantly White (72%)
- Race & ethnicity
- White 72% Hispanic / Latino 14% Two or more races 9% Black 8% Native American 2%
- Hispanic origin (detail)
- Mexican 11%
- Common ancestry
- Lithuanian 2% Italian 2% Portuguese 2%
- Foreign-born
- 5% · Canada
- Languages at home
- 88% English-only · Spanish 10%
Political lean MEDSL · Polk
- 2024 margin
- Solid R (+58.9) · D 20.2% · R 79.1%
- 2008→2024 swing
- -21.7pp toward R · 2008: -37.2pp · 2024: -58.9pp
- All cycles
- 2024: R+58.9 2020: R+54.5 2016: R+56.5 2012: R+48.2 2008: R+37.2
Not yet ingested
- Civics
- —
Market trends
- HPI YoY
- ▼ -31.11%
- Current HPI
- 178.5316
- Rent YoY
- —
- Metro
- nan
- State GDP YoY
- ▲ 3.95%
- F500 in state
- 110
Industry mix (Fortune 500 HQ in TX)
| Industry | F500 HQs | Revenue |
|---|---|---|
| Energy | 16 | $1,198B |
|
||
| Technology | 5 | $198B |
|
||
| Engineering / Construction | 4 | $72B |
|
||
| Energy Services | 3 | $60B |
|
||
| Utilities | 3 | $41B |
|
||
| Healthcare | 2 | $330B |
|
||
Price history
-4.2% since first listed7 events — show timeline
- 2026-05-14 Listed $114,900 HARMLS
- 2026-05-14 Listing Removed — HARMLS
- 2026-04-02 Listing Removed — HARMLS
- 2026-04-02 Listed $116,900 HARMLS
- 2026-02-09 Listed $119,900 HARMLS
- 2026-01-05 Sold (Public Records) $10 Public Records
- 2019-01-23 Sold (Public Records) — Public Records
Property tax history
+27.0%/yrLatest (2025): $187 · +16.1% YoY. Source: county tax records.
Cash-flow waterfall
monthlySold comps — $/sqft
last 12 mo · ≤1 miLoading sold comps…