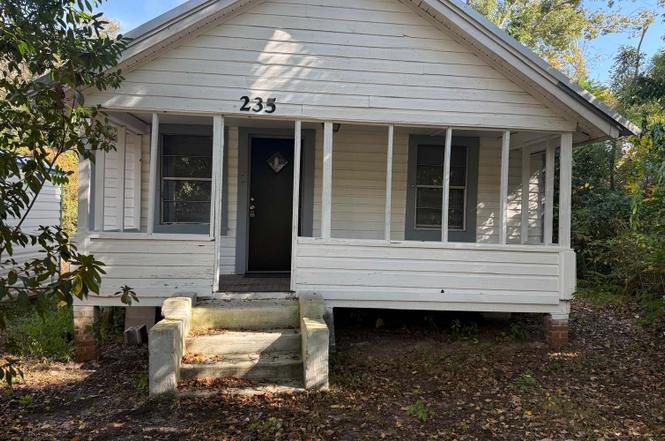
235 SW Valentine Ave · Madison, FL
Flood risk 1/10 · Minimal
- FEMA flood zone
- X (unshaded)
- Chance of flooding over 30 yrs
- 0.0%
- Est. flood insurance / yr
- $507 – $1,088
Fire risk 5/10 · Moderate
- Est. fire insurance / yr
- $947 – $1,759
Heat risk 8/10 · Major
- Hot days now (above 108°F)
- 7 days/yr
- Hot days in 30 yrs
- 19 days/yr
Wind risk 9/10 · Severe
- Chance of severe wind over 30 yrs
- 99.0%
Air-quality risk 6/10 · Moderate
- Unhealthy air days now
- 11 days/yr
- Unhealthy air days in 30 yrs
- 12 days/yr
Risk factors via First Street. Map © Google.
Why this score? — see what drove the A grade
The composite is a weighted blend of 9 inputs, each scored 0–100. Each bar is that input's sub-score; the figure is the points it added to the 100-point composite (weight × sub-score).
- Cash flow +30.0/30.0
- ARV discount +15.0/15.0
- DSCR +10.0/10.0
- Appreciation +10.0/10.0
- 1% rule +9.1/10.0
- Livability +3.5/5.0
- Schools +3.3/10.0
- Rent growth +2.5/5.0
- Condition / age +2.5/5.0
$70,000
🖨 Deal sheet 📄 Offer letter ✓ Due diligence
Listing remarks
Move-in-ready 3/1 home with a clean and updated interior. This charming property features a bright layout, a brand-new AC unit, and newly remodeled flooring. The washer and dryer are included, making the home truly ready for its next family. Please note: the small exterior shed is not included in the sale, but you will enjoy a spacious yard perfect for your garden, a play area, or any project you’ve been dreaming of. Ready for immediate occupancy.
Key facts
- Spacious yard
- Updated interior
- Brand-new ac unit
Tags
Property features AI
Exterior
- Parking: 1-car garage; On-street parking available
- Home design: Single-story residential home
- Construction: Frame construction
- Exterior features: Metal roof
Interior
- Bathrooms: 1 full bathroom
- Heating & cooling: Central air conditioning; Central electric heating
- Interior features: Washer and dryer included; Central air conditioning; Central electric heating
- Laundry & utility: Washer and dryer
Neighborhood map
What this means for you Summary
Snapshot
- This is a 3-bed/1.0-bath single-family listed at $70k.
Deal economics
- At list price, monthly cash flow is $261 ($3k/yr) — positive.
- The deal already cash-flows at list — no discount required.
- Meets the 1% rule at list price ($990 rent vs $70k).
- Recommended offer: $62k (12.0% below list) — sets the bar for market timing.
- Cap rate 10.8% vs local median 2.6% in Madison — top-decile yield for the area; either an underpriced asset or a hidden risk that comps aren't pricing in. Stress-test before assuming the spread holds.
Location & tenants
- Location reads 70/100 on livability (#437 in FL) — a middle-class / working-renter tenant base. Strengths: cost of living A+, health & safety A+, crime A; Watch: schools C-, housing D+, amenities F.
- Madison (rural): math 39% / reading 40% proficiency, ranked #64 of 73 in FL (top 88%) — families likely to look elsewhere, expect single-tenant / working-renter base with shorter leases; 75% free/reduced lunch — lower-income household profile, screen leases tightly.
- Market conditions: 97 active listings in the ZIP; 31 units permitted in Madison County in 2024 (0 in 5+ unit buildings).
Forward outlook
- In year one you build about $7k of equity ($484 loan paydown + $7k appreciation (10.0% local appreciation)).
- Madison County population projected at -29% by 2050 — secular population decline; favor cash flow + early exit over multi-decade hold.
- At projected returns (10.0% appreciation + 3.0% rent growth), your $20k cash investment doubles in ~2 years — after that, you're playing with house money.
- By year 5, paydown + projected appreciation supports a ~$35k cash-out refi (75% LTV) — recoverable capital for the next deal without selling this one.
Negotiation context
- It's been on market 193 days — a 12% lower offer ($62k) is reasonable based on typical stale-listing flexibility.
- 8 sale attempts since 3y ago with the ask held roughly flat each time — persistent listings suggest the price (not the market) is what's stuck; bring a comps-based counter.
Risks & watch-outs
- Watch-outs: built in 1948 — expect roof / HVAC / electrical / plumbing capex.
- Climate carrying-cost: severe wind risk, 99% chance of damaging wind over 30y; moderate wildfire risk; extreme-heat days projected 7→19/yr by 2055 (HVAC capex compounding) — expect insurance premiums to compound above CPI over the hold.
Questions for the listing agent
- It's been on market 193 days. Have you received any prior offers? Is the seller open to a 12% concession, seller financing, or rate buy-down credit?
- Built in 1948 — when were the roof, HVAC, electrical panel, plumbing, and water heater last replaced?
- Why hasn't it sold? Are there any deal-killer items the seller is aware of (foundation, flood, title, zoning, code violations)?
- Is there a deadline driving the sale (1031 exchange, divorce, estate, relocation)? That informs how much negotiation room exists.
- What's the average days-on-market for RENTAL listings here right now (not sales)? A rising rental-DOM trend means longer vacancies and softer asking-rent achievability than the comps imply.
- What's the recent tenant-quality profile in this submarket — average credit score on applications, eviction rate, late-payment / NSF rate, and stable-employment percentage? A property-management company in the area should have these aggregated.
- How much new for-sale + rental construction is in the pipeline within 1–3 miles? Heavy new supply typically softens prices + rents 12–24 months out; constrained supply supports both.
Investment metrics
- 1% rule
- 1.41% ✓
- Cap rate
- 10.77%
- Cash-on-cash
- 15.97%
- DSCR
- 1.71
- GRM
- 5.9
CMA / ARV
- ARV (on-the-fly)
- $107,448
- Comps found
- 4
Show comp detail 4 sales within ~0.75 mi
| Address | Dist | Beds/Ba | Sqft | Sold | Price | $/sf | Match |
|---|---|---|---|---|---|---|---|
| 470 SW Lee Ave | 0.28mi | 2/1.0 (-1) | 852 (-4%) | 5mo | $26,000 | $31 | 71 |
| 137 SW Miller St | 0.39mi | 2/1.0 (-1) | 840 (-5%) | 7mo | $40,000 | $48 | 62 |
| 546 SW Range Ave | 0.41mi | 3/1.0 | 1,021 (+15%) | 6mo | $124,900 | $122 | 51 |
| 159 SE Seminole St | 0.62mi | 2/1.0 (-1) | 981 (+10%) | 11mo | $119,000 | $121 | 39 |
Match score weights: distance 35% · size 25% · config 20% · recency 20%. Top-matched comps best support the ARV.
Projected returns pro-forma
10.0% appreciation · 3.0% rent growth · sell at horizon
- IRR
- 36.1%
- Equity multiple
- 3.79×
- Total profit
- $54,780
- Equity at exit
- $63,062
- IRR
- 31.1%
- Equity multiple
- 8.57×
- Total profit
- $148,325
- Equity at exit
- $135,995
Cash invested: $19,600 (down + closing). Projections, not guarantees.
Landlord ↔ Tenant lean methodology
- Overall (STATE)
- 87 Strongly Landlord-Friendly
- State Florida
- 87 Strongly Landlord-Friendly · R+3
- County
- — inherits STATE
- City
- — inherits STATE
ZIP-level market 32340
- Home prices YoY
- 32.0%
- Active inventory
- 97
- Price-to-rent
- 5.9×
Monthly cashflow live
- Estimated rent
- $990 medium interval (Pro) →
- Mortgage (P&I)
- −$367
- Tax from tax record
- −$125 /mo · $1,503/yr
- Insurance
- −$29
- HOA
- −$0
- Vacancy / Maint / Mgmt
- −$208
- Net cashflow
- $261
Break-even live
UW: 25.0% down · 7.5% · 30yr · 1.5% tax · 5.0% vac · 8.0% maint · 8.0% mgmt
Financing live
Cash to close
- Down payment
- $17,500
- Closing costs
- $2,100
- Reserves months
- —
- Total cash needed
- —
Loan-product check · same deal, 3 products live
Conventional
25% down · 7.5% · 30yr
- Down + closing
- —
- Monthly P&I
- —
- Monthly cashflow
- —
- DSCR
- —
- Eligible?
- —
Personal DTI + credit; lowest rate.
DSCR
20% down · 8.5% · 30yr
- Down + closing
- —
- Monthly P&I
- —
- Monthly cashflow
- —
- DSCR
- —
- Eligible?
- —
No personal income docs; deal must DSCR.
Hard money
10% down · 12.0% · 12mo
- Down + closing
- —
- Monthly P&I
- —
- Monthly cashflow
- —
- DSCR
- —
- Eligible?
- —
Short-term bridge; refi at stabilization.
Listing history 31 events
-
2026-06-19days on market $70,000 Active 193 DOM
-
2026-06-18days on market $70,000 Active 192 DOM
-
2026-06-17days on market $70,000 Active 191 DOM
-
2026-06-16days on market $70,000 Active 190 DOM
-
2026-06-15days on market $70,000 Active 189 DOM
-
2026-06-14days on market $70,000 Active 187 DOM
-
2026-06-13days on market $70,000 Active 186 DOM
-
2026-06-10days on market $70,000 Active 184 DOM
-
2026-06-09days on market $70,000 Active 183 DOM
-
2026-06-08days on market $70,000 Active 182 DOM
-
2026-06-07days on market $70,000 Active 181 DOM
-
2026-06-05days on market $70,000 Active 178 DOM
-
2026-06-03days on market $70,000 Active 177 DOM
-
2026-06-02days on market $70,000 Active 176 DOM
-
2026-06-01days on market $70,000 Active 175 DOM
-
2026-05-31days on market $70,000 Active 174 DOM
-
2026-05-30days on market $70,000 Active 173 DOM
-
2025-12-08$70,000 Active
-
2025-10-29price $70,000
-
2025-08-11$75,000 Active
-
2025-04-04status Active
-
2025-03-25status Active Under Contract
-
2025-03-11price $85,000
-
2025-01-23$49,000 Active
-
2024-11-21historical Active Under Contract
-
2024-11-20soldstatus $62,500 Closed
-
2024-11-07$75,000 Active
-
2024-03-06$105,000 Active
-
2024-03-04historical
-
2024-01-11price $105,000
-
2023-11-26$115,999 Active
ⓘ Source: listings_history table (triggers on properties + properties_extension) + one-shot
backfill from property_details.listing_events for pre-trigger history.
Tax reassessment forecast FL · Resets to sale price
- Current annual tax
- $1,503 · $125/mo
- Projected year-2 tax
- $1,503 · $125/mo
- Expected delta
- $0/yr ($0/mo · 0.0%)
ⓘ Screening estimate from a state-policy table — verify with the county assessor before closing.
Climate risk First Street
- Flood 1/10 Low FEMA zone X (unshaded) · 0% chance over 30 yrs
- Wildfire 5/10 Major
- Heat 8/10 Severe 7 d/yr ≥108°F today · 19 d/yr by 30 yrs out
- Wind 9/10 Extreme 99% chance of damaging wind over 30 yrs
- Air quality 6/10 Major 11 unhealthy d/yr today · 12 by 30 yrs out
Nearby sold comps map
Loading sold comps map…
Walkable amenities ~0.75 mi
Loading nearby amenities…
Taxation est. · year 1
- Rental income
- $11,885
- − Mortgage interest
- −$3,921
- − Property taxes
- −$1,503
- − Insurance
- −$350
- − Repairs & maintenance
- −$951
- − Management
- −$951
- − Depreciation
- −$2,036
- Taxable income
- $2,173
- Est. tax owed @ 24.0%
- −$521
- After-tax cash flow
- $2,610/yr
For passive investors: Depreciation is non-cash, so a rental often shows a tax loss while cash-flowing — sheltering income. Rental losses are passive: they offset passive income freely, and up to $25,000/yr can offset ordinary (W-2) income if you actively participate and your MAGI is under $100k (phasing out to $0 by $150k); unused losses carry forward. On sale, claimed depreciation is recaptured at up to 25%, and gains may owe capital-gains tax (a 1031 exchange can defer both). Figures are a year-1 estimate at your 24.0% rate — not tax advice; consult a CPA.
Schools (NCES district)
- District
- Madison
- NCES district ID
- 1201200
- Math proficiency
- 39% ▼ -5.00%
- Reading proficiency
- 40% ▼ -2.00%
- Median HH income
- $33,925
- Composite
- 32.54/100
- National rank
- #5693
- State rank
- #64 of 73 in FL
Livability — Madison
- Score
- 70/100
- State rank
- #437
- US rank
- #7819
Category grades
Schools grade is shown separately in the Schools card above.
Census & demographics
- Census place
- Madison, FL
- Population (ZIP)
- 10,424
Population outlook (Madison County) Hauer SSP2
- Today (2025)
- 16,849 people
- By 2030
- 15,883 · -5.7%
- By 2040
- 13,861 · -17.7%
- By 2050
- 11,918 · -29.3%
- By 2075
- 7,810 · -53.6%
- By 2100
- 4,684 · -72.2%
Race, ethnicity, and origin ACS 2023
- Neighborhood character
- Diverse neighborhood (Simpson 0.56)
- Race & ethnicity
- White 50% Black 43% Two or more races 5% Hispanic / Latino 3%
- Common ancestry
- Slovak 1% Iranian 1% Serbian 1%
- Foreign-born
- 2% · Canada
- Languages at home
- 97% English-only · Spanish 2%
Political lean MEDSL · Madison
- 2024 margin
- Strong R (+28.9) · D 35.3% · R 64.2%
- 2008→2024 swing
- -25.8pp toward R · 2008: -3.1pp · 2024: -28.9pp
- All cycles
- 2024: R+28.9 2020: R+19.5 2016: R+15.6 2012: R+3.4 2008: R+3.1
Not yet ingested
- Civics
- —
Market trends
- HPI YoY
- ▲ 65.13%
- Current HPI
- 268.8459
- Rent YoY
- —
- Metro
- —
- State GDP YoY
- ▲ 3.28%
- F500 in state
- 36
Industry mix (Fortune 500 HQ in FL)
| Industry | F500 HQs | Revenue |
|---|---|---|
| Industrial Technology | 2 | $29B |
|
||
| Insurance | 2 | $17B |
|
||
| Retail | 1 | $60B |
|
||
| Technology Distribution | 1 | $58B |
|
||
| Homebuilding | 1 | $35B |
|
||
| Technology Manufacturing | 1 | $35B |
|
||
Price history
-39.7% since first listed14 events — show timeline
- 2025-12-08 Listed $70,000 NFMLS
- 2025-10-29 Price Changed $70,000 NFMLS
- 2025-08-11 Listed $75,000 NFMLS
- 2025-04-04 Relisted — NFMLS
- 2025-03-25 Relisted — NFMLS
- 2025-03-11 Price Changed $85,000 NFMLS
- 2025-01-23 Listed $49,000 NFMLS
- 2024-11-21 Contingent — NFMLS
- 2024-11-20 Sold (MLS) $62,500 NFMLS
- 2024-11-07 Listed $75,000 NFMLS
- 2024-03-06 Listed $105,000 NFMLS
- 2024-03-04 Listing Removed — CATRS
- 2024-01-11 Price Changed $105,000 CATRS
- 2023-11-26 Listed $115,999 CATRS
Property tax history
+13.0%/yrLatest (2024): $1,503 · +193.5% YoY. Source: county tax records.
Cash-flow waterfall
monthlySold comps — $/sqft
last 12 mo · ≤1 miLoading sold comps…