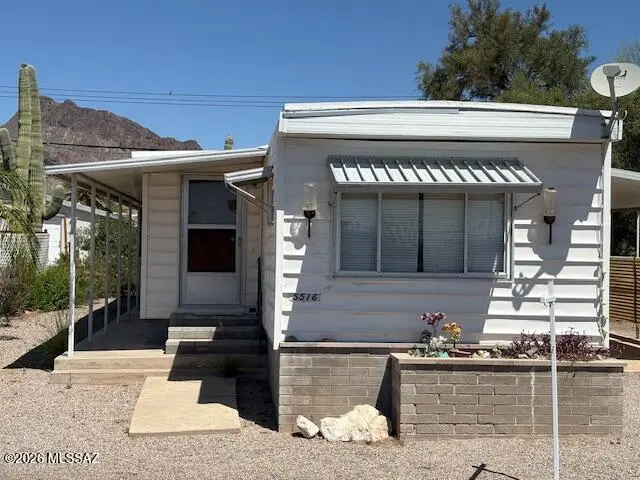
5516 W Lazy Heart St · Tucson Estates, AZ
Flood risk 1/10 · Minimal
- FEMA flood zone
- X (unshaded)
- Chance of flooding over 30 yrs
- 0.0%
- Est. flood insurance / yr
- $507 – $1,088
Fire risk 5/10 · Moderate
- Est. fire insurance / yr
- $610 – $1,132
Heat risk 8/10 · Major
- Hot days now (above 106°F)
- 7 days/yr
- Hot days in 30 yrs
- 19 days/yr
Wind risk 1/10 · Minimal
- Chance of severe wind over 30 yrs
- —
Air-quality risk 1/10 · Minimal
- Unhealthy air days now
- 0 days/yr
- Unhealthy air days in 30 yrs
- 0 days/yr
Risk factors via First Street. Map © Google.
Why this score? — see what drove the C+ grade
The composite is a weighted blend of 9 inputs, each scored 0–100. Each bar is that input's sub-score; the figure is the points it added to the 100-point composite (weight × sub-score).
- Cash flow +24.7/30.0
- ARV discount +13.1/15.0
- 1% rule +8.2/10.0
- DSCR +8.0/10.0
- Livability +3.1/5.0
- Rent growth +2.6/5.0
- Condition / age +2.5/5.0
- Schools +1.6/10.0
- Appreciation +0.0/10.0
$105,000
🖨 Deal sheet 📄 Offer letter ✓ Due diligence
Listing remarks MLS
Neat furnished home with split bedrooms Expanded living room and central air. Large storage shed and golf cart included.
Key facts
- Tennis
- Pickleball
- Shuffleboard
Tags
Property features AI
Finance
- Other: Lot with north/south exposure on paved streets (HOA maintains road); Zoning: Pima County - TH
- HOA & community: Part of TEPOA; Monthly HOA fee $208; HOA transfer fee $153; HOA maintains common areas and streets; Community amenities: clubhouse, pool, spa/hot tub, sauna, recreation room, tennis courts, pickleball, shuffleboard, putting green, golf, fitness center, paved streets, street lights
Exterior
- Parking: Attached garage; 1 covered/carport space; Storage in parking area
- Security: Smoke detector(s)
- Utilities: Public water; Sewer connected
- Home design: Mobile home; One story; Faces south
- Construction: Frame construction; Built-Up reflective roof
- Exterior features: Covered patio; Shed(s)
Interior
- Kitchen: Refrigerator; Gas cooktop; Gas oven; Microwave
- Flooring: Carpet; Vinyl
- Bathrooms: 2 full bathrooms
- Heating & cooling: Forced air heating (natural gas); Central air conditioning
- Interior features: Furnished; Smoke detector(s)
- Laundry & utility: Washer
Neighborhood map
What this means for you Summary
Snapshot
- This is a 2-bed/2.0-bath manufactured listed at $105k.
Deal economics
- At list price, monthly cash flow is $219 ($3k/yr) — positive.
- The deal already cash-flows at list — no discount required.
- Meets the 1% rule at list price ($1k rent vs $105k).
- Recommended offer: $102k (3.0% below list) — sets the bar for market timing.
- Cap rate 8.8% vs local median 4.4% in Tucson Estates — top-decile yield for the area; either an underpriced asset or a hidden risk that comps aren't pricing in. Stress-test before assuming the spread holds.
Location & tenants
- Location reads 62/100 on livability (#137 in AZ) — a middle-class / working-renter tenant base. Strengths: cost of living A+, housing A+; Watch: crime D, amenities F, commute F.
- Tucson Unified District (4403) (urban): math 14% / reading 23% proficiency, ranked #190 of 249 in AZ (top 76%) — low school quality limits family demand, transient renter base, plan for 1-2y turnover.
- Zoned schools: Laura N. Banks Elementary (math 8% / reading 22%, grade F, #888 of 1,109 statewide, top 81%, 308 students, 70% FRL); Valencia Middle School (math 3% / reading 11%, grade F, #210 of 218 statewide, top 97%, 722 students, 79% FRL); Cholla High School (math 2% / reading 17%, grade F, #343 of 381 statewide, top 93%, 1,760 students, 62% FRL).
- Market conditions: Rents flat; 264 active listings in the ZIP; 6 comparable units currently listed for rent nearby; rentals lingering (median 44d on market — plan ~5-8 weeks vacancy on turnover, expect pricing pressure); 83% of comp listings sitting > 30 days — soft ceiling on asking rent; 5,268 units permitted in Pima County in 2024 (996 in 5+ unit buildings).
- This rent runs 31% of the median local income ($53k/yr) — at the standard rent-burdened threshold; future hikes will face affordability resistance.
Forward outlook
- Local home prices are declining (-3.0%/yr); year-one equity from $726 of loan paydown is wiped out by about $3k of value loss. Plan a longer hold.
- Pima County population projected at +8% by 2050 — modest demand growth; plan on rents tracking national, not racing it.
Negotiation context
- It's been on market 43 days — a 3% lower offer ($102k) is reasonable based on typical stale-listing flexibility.
- 5 sale attempts since 15y ago with the ask held roughly flat each time — persistent listings suggest the price (not the market) is what's stuck; bring a comps-based counter.
- Current owner paid $41k; list at $105k implies a 156% gain — meaningful room to come down on a strong offer.
Risks & watch-outs
- Climate carrying-cost: moderate wildfire risk; extreme-heat days projected 7→19/yr by 2055 (HVAC capex compounding) — expect insurance premiums to compound above CPI over the hold.
Questions for the listing agent
- It's been on market 43 days. Have you received any prior offers? Is the seller open to a 3% concession, seller financing, or rate buy-down credit?
- Built in 1971 — when were the roof, HVAC, electrical panel, plumbing, and water heater last replaced?
- What does the HOA fee cover, when was the last increase, and are there any pending special assessments or reserve-fund shortfalls?
- Is there a deadline driving the sale (1031 exchange, divorce, estate, relocation)? That informs how much negotiation room exists.
- Schools are F-rated, which usually means shorter tenancies and higher turnover. Who's the typical renter profile here, and what's been the actual vacancy rate?
- Crime grade is D in this area — have there been break-ins, vandalism, or insurance claims at this property in the last 3 years? What carrier currently insures it and at what premium?
- What's the average days-on-market for RENTAL listings here right now (not sales)? A rising rental-DOM trend means longer vacancies and softer asking-rent achievability than the comps imply.
- What's the recent tenant-quality profile in this submarket — average credit score on applications, eviction rate, late-payment / NSF rate, and stable-employment percentage? A property-management company in the area should have these aggregated.
- How much new for-sale + rental construction is in the pipeline within 1–3 miles? Heavy new supply typically softens prices + rents 12–24 months out; constrained supply supports both.
Investment metrics
- 1% rule
- 1.32% ✓
- Cap rate
- 8.80%
- Cash-on-cash
- 8.95%
- DSCR
- 1.40
- GRM
- 6.3
CMA / ARV
- ARV (median comp)
- $120,012
- List price
- $105,000
- Delta
- -12.51%
- Verdict
- UNDERPRICED
- Comps
- 20 within 1.0 mi
Projected returns pro-forma
-3.0% appreciation · 0.21% rent growth · sell at horizon
- IRR
- -6.4%
- Equity multiple
- 0.77×
- Total profit
- $-6,708
- Equity at exit
- $15,656
- IRR
- -1.2%
- Equity multiple
- 0.93×
- Total profit
- $-2,049
- Equity at exit
- $9,078
Cash invested: $29,400 (down + closing). Projections, not guarantees.
Landlord ↔ Tenant lean methodology
- Overall (STATE)
- 87 Strongly Landlord-Friendly
- State Arizona
- 87 Strongly Landlord-Friendly · R+3
- County
- — inherits STATE
- City
- — inherits STATE
ZIP-level market 85713
- Home prices YoY
- -24.5%
- Rents YoY
- 0.2%
- Active inventory
- 264
- Price-to-rent
- 6.3×
Monthly cashflow live
- Estimated rent
- $1,382 high interval (Pro) →
- Mortgage (P&I)
- −$551
- Tax from tax record
- −$70 /mo · $841/yr
- Insurance
- −$44
- HOA
- −$208
- Vacancy / Maint / Mgmt
- −$290
- Net cashflow
- $219
Break-even live
UW: 25.0% down · 7.5% · 30yr · 1.5% tax · 5.0% vac · 8.0% maint · 8.0% mgmt
Financing live
Cash to close
- Down payment
- $26,250
- Closing costs
- $3,150
- Reserves months
- —
- Total cash needed
- —
Loan-product check · same deal, 3 products live
Conventional
25% down · 7.5% · 30yr
- Down + closing
- —
- Monthly P&I
- —
- Monthly cashflow
- —
- DSCR
- —
- Eligible?
- —
Personal DTI + credit; lowest rate.
DSCR
20% down · 8.5% · 30yr
- Down + closing
- —
- Monthly P&I
- —
- Monthly cashflow
- —
- DSCR
- —
- Eligible?
- —
No personal income docs; deal must DSCR.
Hard money
10% down · 12.0% · 12mo
- Down + closing
- —
- Monthly P&I
- —
- Monthly cashflow
- —
- DSCR
- —
- Eligible?
- —
Short-term bridge; refi at stabilization.
Rent comps 6 comps
| Address | Beds | Baths | Sqft | Rent | $/sqft | DOM | Units | Dist |
|---|---|---|---|---|---|---|---|---|
| 5709 W Rocking Circle St Tucson, AZ | 2.0 | 2.0 | 1050 | $895 | $0.85 | 44d | 1 | 0.21mi |
| 5849 W Flying M St Tucson, AZ | 3.0 | 2.0 | 1200 | $1,625 | $1.35 | 44d | 1 | 0.38mi |
| 3156 S Three D Ct Tucson, AZ | 3.0 | 2.5 | 2238 | $1,995 | $0.89 | 44d | 1 | 0.38mi |
| 3923 S Amber Rock Ave Tucson, AZ | 3.0 | 3.0 | 2580 | $2,600 | $1.01 | 44d | 1 | 0.75mi |
| 6174 W Lazy Heart St Tucson, AZ | 2.0 | 2.0 | 1440 | $1,495 | $1.04 | 44d | 1 | 0.84mi |
| 4220 S Macy Cir Tucson, AZ | 3.0 | 2.0 | 2223 | $2,400 | $1.08 | 16d | 1 | 1.45mi |
HOA detail
- Monthly dues
- $208 · $2,496/yr
Listing history 26 events
-
2026-06-18days on market $105,000 Active 43 DOM
-
2026-06-17days on market $105,000 Active 42 DOM
-
2026-06-16days on market $105,000 Active 41 DOM
-
2026-06-15days on market $105,000 Active 40 DOM
-
2026-06-13days on market $105,000 Active 38 DOM
-
2026-06-10days on market $105,000 Active 35 DOM
-
2026-06-09days on market $105,000 Active 34 DOM
-
2026-06-08days on market $105,000 Active 33 DOM
-
2026-06-07days on market $105,000 Active 32 DOM
-
2026-06-05days on market $105,000 Active 29 DOM
-
2026-06-03days on market $105,000 Active 28 DOM
-
2026-06-02days on market $105,000 Active 27 DOM
-
2026-06-01days on market $105,000 Active 26 DOM
-
2026-05-31days on market $105,000 Active 25 DOM
-
2026-05-06$105,000 Active 480-char remark
-
2025-11-22status Active
-
2025-11-12status Pending
-
2025-11-12historical
-
2025-09-19$105,000 Active
-
2013-04-22soldstatus $41,000
Show marketing remark (120 chars)
Neat furnished home with split bedrooms Expanded living room and central air. Large storage shed and golf cart included.
-
2013-03-26historical
Show marketing remark (120 chars)
Neat furnished home with split bedrooms Expanded living room and central air. Large storage shed and golf cart included.
-
2012-11-29$49,000
Show marketing remark (120 chars)
Neat furnished home with split bedrooms Expanded living room and central air. Large storage shed and golf cart included.
-
2012-03-05historical
-
2011-11-29$54,900
-
1991-03-05soldstatus $30,000
-
1991-02-01soldstatus $30,000
ⓘ Source: listings_history table (triggers on properties + properties_extension) + one-shot
backfill from property_details.listing_events for pre-trigger history.
Tax reassessment forecast AZ · Resets to sale price
- Current annual tax
- $841 · $70/mo
- Projected year-2 tax
- $841 · $70/mo
- Expected delta
- $0/yr ($0/mo · 0.0%)
ⓘ Screening estimate from a state-policy table — verify with the county assessor before closing.
Climate risk First Street
- Flood 1/10 Low FEMA zone X (unshaded) · 0% chance over 30 yrs
- Wildfire 5/10 Major
- Heat 8/10 Severe 7 d/yr ≥106°F today · 19 d/yr by 30 yrs out
- Wind 1/10 Low
- Air quality 1/10 Low 0 unhealthy d/yr today · 0 by 30 yrs out
Nearby sold comps map
Loading sold comps map…
Walkable amenities ~0.75 mi
Loading nearby amenities…
Taxation est. · year 1
- Rental income
- $16,585
- − Mortgage interest
- −$5,882
- − Property taxes
- −$841
- − Insurance
- −$525
- − Repairs & maintenance
- −$1,327
- − Management
- −$1,327
- − HOA
- −$2,496
- − Depreciation
- −$3,055
- Taxable income
- $1,133
- Est. tax owed @ 24.0%
- −$272
- After-tax cash flow
- $2,360/yr
For passive investors: Depreciation is non-cash, so a rental often shows a tax loss while cash-flowing — sheltering income. Rental losses are passive: they offset passive income freely, and up to $25,000/yr can offset ordinary (W-2) income if you actively participate and your MAGI is under $100k (phasing out to $0 by $150k); unused losses carry forward. On sale, claimed depreciation is recaptured at up to 25%, and gains may owe capital-gains tax (a 1031 exchange can defer both). Figures are a year-1 estimate at your 24.0% rate — not tax advice; consult a CPA.
Schools (NCES district)
- District
- Tucson Unified District (4403)
- NCES district ID
- 0408800
- Math proficiency
- 14% ▼ -17.00%
- Reading proficiency
- 23% ▼ -11.00%
- Median HH income
- $40,962
- Composite
- 15.78/100
- National rank
- #9270
- State rank
- #190 of 249 in AZ
Livability — Tucson Estates
- Score
- 62/100
- State rank
- #137
- US rank
- #16650
Category grades
Schools grade is shown separately in the Schools card above.
Census & demographics
- Census place
- Tucson Estates, AZ
- County
- Pima County · 1,012,107 people
- Metro
- Tucson, AZ
- Population (ZIP)
- 46,439
- Household income
- $53,152
- Rent vs Own
- Severe rent burden
- 1517.0
Population outlook (Pima County) Hauer SSP2
- Today (2025)
- 1,066,056 people
- By 2030
- 1,086,684 · +1.9%
- By 2040
- 1,117,160 · +4.8%
- By 2050
- 1,149,778 · +7.9%
- By 2075
- 1,271,480 · +19.3%
- By 2100
- 1,321,160 · +23.9%
Race, ethnicity, and origin ACS 2023
- Neighborhood character
- Predominantly Hispanic (70%)
- Race & ethnicity
- Hispanic / Latino 70% Two or more races 30% White 21% Native American 5% Black 3% Asian 1%
- Hispanic origin (detail)
- Mexican 67%
- Common ancestry
- Italian 1% Lithuanian 1% Portuguese 1%
- Foreign-born
- 19% · Canada, China
- Languages at home
- 49% English-only · Spanish 49%
Political lean MEDSL · Pima
- 2024 margin
- D (+15.2) · D 57.0% · R 41.8% · Other 1.2%
- 2008→2024 swing
- +9.1pp toward D · 2008: 6.1pp · 2024: 15.2pp
- All cycles
- 2024: D+15.2 2020: D+18.7 2016: D+13.5 2012: D+5.8 2008: D+6.1
Not yet ingested
- Civics
- —
Market trends
- HPI YoY
- ▼ -107.07%
- Current HPI
- 329.8338
- Rent YoY
- ▲ 0.21%
- Metro
- Tucson, AZ
- State GDP YoY
- ▲ 4.54%
- F500 in state
- 20
Industry mix (Fortune 500 HQ in AZ)
| Industry | F500 HQs | Revenue |
|---|---|---|
| Technology | 2 | $13B |
|
||
| Mining / Metals | 1 | $23B |
|
||
| Environmental Services | 1 | $16B |
|
||
| Metals / Steel | 1 | $14B |
|
||
| Technology Distribution | 1 | $9B |
|
||
| Homebuilding | 1 | $8B |
|
||
Price history
+250.0% since first listed12 events — show timeline
- 2026-05-06 Listed $105,000 MLSSAZ
- 2025-11-22 Relisted — MLSSAZ
- 2025-11-12 Pending — MLSSAZ
- 2025-11-12 Listing Removed — MLSSAZ
- 2025-09-19 Listed $105,000 MLSSAZ
- 2013-04-22 Sold (MLS) $41,000 MLSSAZ
- 2013-03-26 Listing Removed — MLSSAZ
- 2012-11-29 Listed $49,000 MLSSAZ
- 2012-03-05 Listing Removed — MLSSAZ
- 2011-11-29 Listed $54,900 MLSSAZ
- 1991-03-05 Sold (Public Records) $30,000 Public Records
- 1991-02-01 Sold (Public Records) $30,000 Public Records
Property tax history
+2.1%/yrLatest (2025): $841 · +4.8% YoY. Source: county tax records.
Cash-flow waterfall
monthlySold comps — $/sqft
last 12 mo · ≤1 miLoading sold comps…