 Multi-family
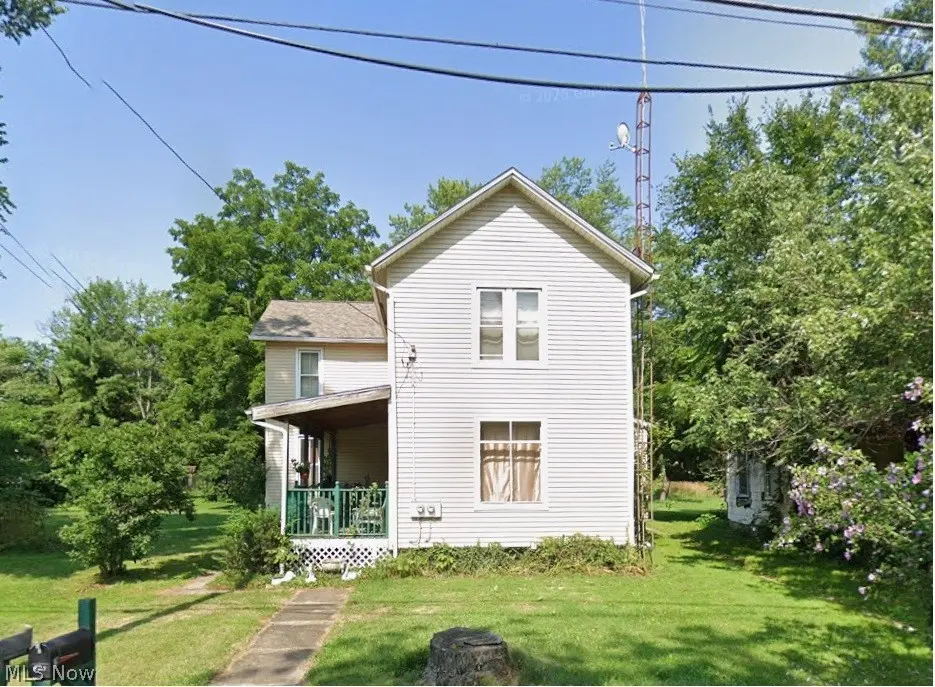
11371 Walnut Ave NE · Alliance, OH
Flood risk 1/10 · Minimal
- FEMA flood zone
- X (unshaded)
- Chance of flooding over 30 yrs
- 0.0%
- Est. flood insurance / yr
- $473 – $860
Fire risk 1/10 · Minimal
- Est. fire insurance / yr
- $713 – $1,323
Heat risk 3/10 · Minor
- Hot days now (above 97°F)
- 7 days/yr
- Hot days in 30 yrs
- 17 days/yr
Wind risk 1/10 · Minimal
- Chance of severe wind over 30 yrs
- —
Air-quality risk 2/10 · Minimal
- Unhealthy air days now
- 1 days/yr
- Unhealthy air days in 30 yrs
- 2 days/yr
Risk factors via First Street. Map © Google.
Why this score? — see what drove the C+ grade
The composite is a weighted blend of 9 inputs, each scored 0–100. Each bar is that input's sub-score; the figure is the points it added to the 100-point composite (weight × sub-score).
- Cash flow +30.0/30.0
- 1% rule +10.0/10.0
- DSCR +10.0/10.0
- Livability +3.9/5.0
- Schools +3.5/10.0
- Rent growth +2.5/5.0
- Condition / age +2.5/5.0
- ARV discount +0.0/15.0
- Appreciation +0.0/10.0
$125,000
🖨 Deal sheet 📄 Offer letter ✓ Due diligence
Multi-family units
County records classify this as Multi-Family (2-4 Unit). Listing-text estimate: 1 unit. estimate disagrees with records
Listing remarks
Great duplex in Lexington Township located on two parcels equaling 1.06 acres. One unit is 3 bedrooms, 1 bath on the main level. Second unit is 1 bedroom, 1 bath, and the full basement has laundry hookups. Two electrical boxes, separate entrances, and both units have large dining rooms. Very spacious units. Two large garages. Selling AS IS. Could be converted to single family!
Key facts
- Two parcels
- Large dining rooms
- Full basement
Tags
Property features AI
Finance
- Financial info: $2,123 annual tax (2025)
Exterior
- Parking: Detached garage; 2 garage spaces; Shared driveway
- Utilities: Public water; Public sewer; Gas service for heating
- Home design: 2-story home; Above-grade finished area approximately 2,250
- Construction: Vinyl siding; Shingle roof
- Exterior features: Lot approximately 1.06 acres
Interior
- Kitchen: Eat-in kitchen
- Bedrooms: 1 main-level bedroom
- Bathrooms: 2 full bathrooms; 1 main-level bathroom
- Heating & cooling: Gas heating
- Interior features: Eat-in kitchen; High ceilings; Walk-in closet(s); Full basement
- Laundry & utility: Laundry in basement
Neighborhood map
What this means for you Summary
Snapshot
- This is a 4-bed/2.0-bath multifamily listed at $125k.
Deal economics
- At list price, monthly cash flow is $696 ($8k/yr) — positive.
- The deal already cash-flows at list — no discount required.
- Meets the 1% rule at list price ($2k rent vs $125k).
- Cap rate 13.0% vs local median 4.8% in Alliance — top-decile yield for the area; either an underpriced asset or a hidden risk that comps aren't pricing in. Stress-test before assuming the spread holds.
Location & tenants
- Location reads 78/100 on livability (#175 in OH, #2,737 nationally) — a middle-class / working-renter tenant base. Strengths: commute A+, cost of living A+, housing A+; Watch: amenities F, employment F.
- Alliance City (town): math 39% / reading 45% proficiency, ranked #536 of 656 in OH (top 82%) — families likely to look elsewhere, expect single-tenant / working-renter base with shorter leases; 71% free/reduced lunch — lower-income household profile, screen leases tightly.
- Market conditions: 166 active listings in the ZIP; 528 units permitted in Stark County in 2024 (84 in 5+ unit buildings).
- This rent runs 37% of the median local income ($62k/yr) — at the standard rent-burdened threshold; future hikes will face affordability resistance.
Forward outlook
- Local home prices are declining (-3.0%/yr); year-one equity from $864 of loan paydown is wiped out by about $4k of value loss. Plan a longer hold.
- Stark County population projected to shrink 8% by 2050 — rents likely to lag national; underwrite the cash flow, not the appreciation.
- At projected returns (-3.0% appreciation + 3.0% rent growth), your $35k cash investment doubles in ~6 years — after that, you're playing with house money.
Negotiation context
- Only 6 days on market — expect competitive offers; lowballing is unlikely to land.
- 2 sale attempts with the ask held roughly flat each time — persistent listings suggest the price (not the market) is what's stuck; bring a comps-based counter.
- Current owner paid $24k; list at $125k implies a 430% gain — meaningful room to come down on a strong offer.
Risks & watch-outs
- Watch-outs: built in 1900 — expect roof / HVAC / electrical / plumbing capex.
Questions for the listing agent
- Built in 1900 — when were the roof, HVAC, electrical panel, plumbing, and water heater last replaced?
- Is there a deadline driving the sale (1031 exchange, divorce, estate, relocation)? That informs how much negotiation room exists.
- Schools are B-rated — typically a magnet for longer-tenancy family renters. What's the average tenant stay here, and is there a school-zone premium baked into asking?
- What's the average days-on-market for RENTAL listings here right now (not sales)? A rising rental-DOM trend means longer vacancies and softer asking-rent achievability than the comps imply.
- What's the recent tenant-quality profile in this submarket — average credit score on applications, eviction rate, late-payment / NSF rate, and stable-employment percentage? A property-management company in the area should have these aggregated.
- How much new apartment / multifamily construction is in the pipeline within 1–3 miles? Heavy new supply (>2% of stock underway) typically softens rents 12–24 months out; light construction supports rent growth.
Investment metrics
- 1% rule
- 1.51% ✓
- Cap rate
- 12.98%
- Cash-on-cash
- 23.87%
- DSCR
- 2.06
- GRM
- 5.5
CMA / ARV
- ARV (median comp)
- $102,586
- List price
- $125,000
- Delta
- 60.74%
- Verdict
- OVERPRICED
- Comps
- 3 within 1.0 mi
Projected returns pro-forma
-3.0% appreciation · 3.0% rent growth · sell at horizon
- IRR
- 17.1%
- Equity multiple
- 1.69×
- Total profit
- $24,081
- Equity at exit
- $18,638
- IRR
- 25.6%
- Equity multiple
- 3.23×
- Total profit
- $78,021
- Equity at exit
- $10,808
Cash invested: $35,000 (down + closing). Projections, not guarantees.
Landlord ↔ Tenant lean methodology
- Overall (STATE)
- 73 Landlord-Friendly
- State Ohio
- 73 Landlord-Friendly · R+6
- County
- — inherits STATE
- City
- — inherits STATE
ZIP-level market 44601
- Active inventory
- 166
- Price-to-rent
- 10.1×
Monthly cashflow live
- Estimated rent
- $1,888 medium interval (Pro) →
- Mortgage (P&I)
- −$656
- Tax from tax record
- −$88 /mo · $1,051/yr
- Insurance
- −$52
- HOA
- −$0
- Vacancy / Maint / Mgmt
- −$396
- Net cashflow
- $696
Break-even live
2-unit breakdown (identical units grouped — click to expand)
| Units | Beds | Baths | Est. rent |
|---|---|---|---|
| 1× unit | 2 | 1 | $1,035 |
| 1× unit | 1 | 1 | $854 |
| Total (2 units) | $1,888 | ||
UW: 25.0% down · 7.5% · 30yr · 1.5% tax · 5.0% vac · 8.0% maint · 8.0% mgmt
Financing live
Cash to close
- Down payment
- $31,250
- Closing costs
- $3,750
- Reserves months
- —
- Total cash needed
- —
Loan-product check · same deal, 3 products live
Conventional
25% down · 7.5% · 30yr
- Down + closing
- —
- Monthly P&I
- —
- Monthly cashflow
- —
- DSCR
- —
- Eligible?
- —
Personal DTI + credit; lowest rate.
DSCR
20% down · 8.5% · 30yr
- Down + closing
- —
- Monthly P&I
- —
- Monthly cashflow
- —
- DSCR
- —
- Eligible?
- —
No personal income docs; deal must DSCR.
Hard money
10% down · 12.0% · 12mo
- Down + closing
- —
- Monthly P&I
- —
- Monthly cashflow
- —
- DSCR
- —
- Eligible?
- —
Short-term bridge; refi at stabilization.
Listing history 12 events
-
2026-06-09status $125,000 Pending 6 DOM
-
2026-06-08days on market $125,000 Active 6 DOM
-
2026-06-07days on market $125,000 Active 5 DOM
-
2026-06-03remarks 379-char remark
-
2026-06-03pricedays on market $125,000 Active 1 DOM
-
2026-06-02days on market $164,900 Active 41 DOM
-
2026-06-01days on market $164,900 Active 40 DOM
-
2026-05-31days on market $164,900 Active 39 DOM
-
2026-05-30days on market $164,900 Active 38 DOM
-
2026-05-14price $164,900 342-char remark
-
2026-04-22$169,900 Active 342-char remark
-
1995-03-28soldstatus $23,600
ⓘ Source: listings_history table (triggers on properties + properties_extension) + one-shot
backfill from property_details.listing_events for pre-trigger history.
Tax reassessment forecast OH · Partial reset (capped growth)
- Current annual tax
- $1,051 · $88/mo
- Projected year-2 tax
- $1,501 · $125/mo
- Expected delta
- +$449/yr (+$37/mo · 42.8%)
ⓘ Screening estimate from a state-policy table — verify with the county assessor before closing.
Climate risk First Street
- Flood 1/10 Low FEMA zone X (unshaded) · 0% chance over 30 yrs
- Wildfire 1/10 Low
- Heat 3/10 Moderate 7 d/yr ≥97°F today · 17 d/yr by 30 yrs out
- Wind 1/10 Low
- Air quality 2/10 Low 1 unhealthy d/yr today · 2 by 30 yrs out
Nearby sold comps map
Loading sold comps map…
Walkable amenities ~0.75 mi
Loading nearby amenities…
Taxation est. · year 1
- Rental income
- $22,656
- − Mortgage interest
- −$7,002
- − Property taxes
- −$1,051
- − Insurance
- −$625
- − Repairs & maintenance
- −$1,812
- − Management
- −$1,812
- − Depreciation
- −$3,636
- Taxable income
- $6,717
- Est. tax owed @ 24.0%
- −$1,612
- After-tax cash flow
- $6,744/yr
For passive investors: Depreciation is non-cash, so a rental often shows a tax loss while cash-flowing — sheltering income. Rental losses are passive: they offset passive income freely, and up to $25,000/yr can offset ordinary (W-2) income if you actively participate and your MAGI is under $100k (phasing out to $0 by $150k); unused losses carry forward. On sale, claimed depreciation is recaptured at up to 25%, and gains may owe capital-gains tax (a 1031 exchange can defer both). Figures are a year-1 estimate at your 24.0% rate — not tax advice; consult a CPA.
Schools (NCES district)
- District
- Alliance City
- NCES district ID
- 3904349
- Math proficiency
- 39% ▼ -9.00%
- Reading proficiency
- 45% ▼ -5.00%
- Median HH income
- $33,326
- Composite
- 34.54/100
- National rank
- #5176
- State rank
- #536 of 656 in OH
Livability — Alliance
- Score
- 78/100
- State rank
- #175
- US rank
- #2737
Category grades
Schools grade is shown separately in the Schools card above.
Census & demographics
- County
- Stark County · 272,865 people
- City population
- 32,696
- Metro
- Canton-Massillon, OH
- Population (ZIP)
- 32,696
- Household income
- $61,965
- Rent vs Own
- Severe rent burden
- 780.0
Population outlook (Stark County) Hauer SSP2
- Today (2025)
- 373,708 people
- By 2030
- 371,245 · -0.7%
- By 2040
- 361,331 · -3.3%
- By 2050
- 345,290 · -7.6%
- By 2075
- 302,669 · -19.0%
- By 2100
- 238,870 · -36.1%
Race, ethnicity, and origin ACS 2023
- Neighborhood character
- Predominantly White (87%)
- Race & ethnicity
- White 87% Black 6% Two or more races 5% Hispanic / Latino 1%
- Common ancestry
- Italian 3% Lithuanian 2% Slovak 2%
- Foreign-born
- 1%
- Languages at home
- 98% English-only · Spanish 1%
Political lean MEDSL · Stark
- 2024 margin
- Strong R (+21.9) · D 38.6% · R 60.5%
- 2008→2024 swing
- -27.4pp toward R · 2008: 5.5pp · 2024: -21.9pp
- All cycles
- 2024: R+21.9 2020: R+18.5 2016: R+17.4 2012: R+0.4 2008: D+5.5
Not yet ingested
- Civics
- —
Market trends
- HPI YoY
- ▼ -174.62%
- Current HPI
- 224.9507
- Rent YoY
- —
- Metro
- Canton-Massillon, OH
- State GDP YoY
- ▲ 1.98%
- F500 in state
- 48
Industry mix (Fortune 500 HQ in OH)
| Industry | F500 HQs | Revenue |
|---|---|---|
| Insurance | 3 | $145B |
|
||
| Industrial Machinery | 3 | $49B |
|
||
| Financial Services | 3 | $24B |
|
||
| Consumer Goods | 2 | $93B |
|
||
| Aerospace / Defense | 2 | $47B |
|
||
| Utilities | 2 | $33B |
|
||
Price history
+429.7% since first listed7 events — show timeline
- 2026-06-08 Pending — MLSNOW
- 2026-06-08 Listing Removed — MLSNOW
- 2026-06-02 Price Changed $125,000 MLSNOW
- 2026-06-02 Listed $125,000 MLSNOW
- 2026-05-14 Price Changed $164,900 MLSNOW
- 2026-04-22 Listed $169,900 MLSNOW
- 1995-03-28 Sold (Public Records) $23,600 Public Records
Property tax history
+2.1%/yrLatest (2024): $1,051 · +67.5% YoY. Source: county tax records.
Cash-flow waterfall
monthlySold comps — $/sqft
last 12 mo · ≤1 miLoading sold comps…