5011 Bowie St · Amarillo, TX
Flood risk 1/10 · Minimal
- FEMA flood zone
- X (unshaded)
- Chance of flooding over 30 yrs
- 0.0%
- Est. flood insurance / yr
- $507 – $1,088
Fire risk 9/10 · Severe
- Est. fire insurance / yr
- $1,222 – $2,270
Heat risk 4/10 · Minor
- Hot days now (above 97°F)
- 7 days/yr
- Hot days in 30 yrs
- 20 days/yr
Wind risk 2/10 · Minimal
- Chance of severe wind over 30 yrs
- —
Air-quality risk 2/10 · Minimal
- Unhealthy air days now
- 1 days/yr
- Unhealthy air days in 30 yrs
- 1 days/yr
Risk factors via First Street. Map © Google.
Why this score? — see what drove the D grade
The composite is a weighted blend of 9 inputs, each scored 0–100. Each bar is that input's sub-score; the figure is the points it added to the 100-point composite (weight × sub-score).
- Cash flow +12.8/30.0
- ARV discount +7.5/15.0
- Rent growth +4.0/5.0
- DSCR +3.8/10.0
- Schools +3.6/10.0
- Livability +3.3/5.0
- 1% rule +3.2/10.0
- Condition / age +2.5/5.0
- Appreciation +0.0/10.0
$181,000
🖨 Deal sheet (PDF) 📄 Offer letter ✓ Due diligence
Listing remarks MLS
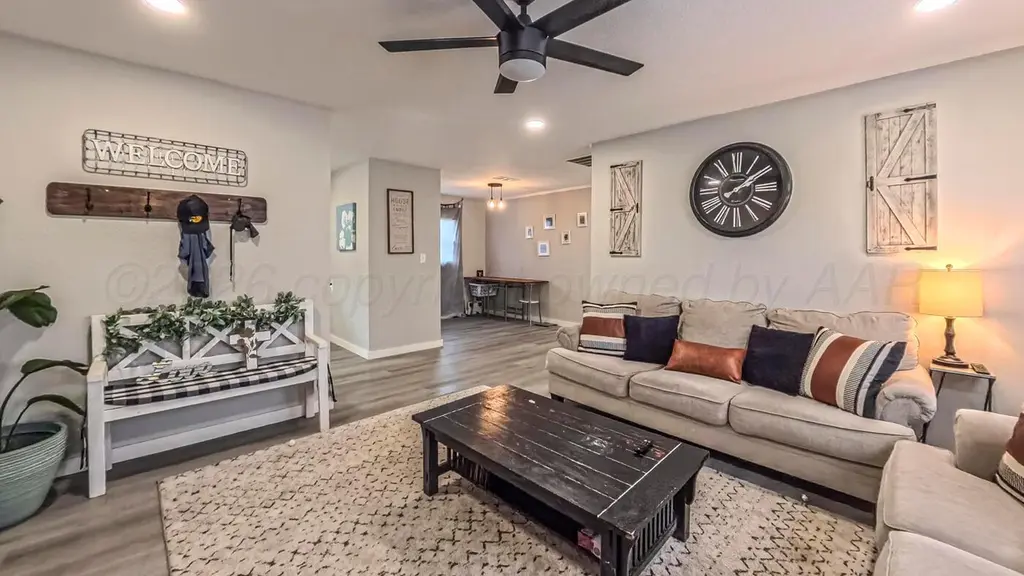
Check out this beautiful starter home today! Whether it's for a first time homebuyer, a family or an investment property this home is ready to go! New plumbing under the house, new electrical, newer windows & new appliances (per seller)
Key facts
- New plumbing lines
- New ac unit
- New water heater
Tags
Property features AI
Finance
- Other: Living area approximately 1,172
- Financial info: Financial details not provided
- HOA & community: HOA details not provided
Exterior
- Parking: Parking details not provided
- Security: Security details not provided
- Utilities: Utility details not provided
- Home design: Single-family residential property; Located in Southeast Amarillo within city limits
- Construction: Construction details not provided
- Exterior features: Directions: Go South on Georgia, turn on Douglas Dr, make a left on Bowie and the property will be to the right.
Interior
- Kitchen: Kitchen details not provided
- Bedrooms: Bedroom count not provided
- Flooring: Flooring details not provided
- Bathrooms: 1 full bathroom
- Heating & cooling: Heating and cooling details not provided
- Interior features: Interior details not provided
- Laundry & utility: Laundry details not provided
Neighborhood map
What this means for you Summary
Snapshot
- This is a 3-bed/1.0-bath single-family listed at $181k.
Deal economics
- At list price, monthly cash flow is $-16 ($-189/yr) — negative.
- To cash-flow at today's rent, offer at most $178k (1.5% below list).
- To meet the 1% rule (rent ≥ 1% of price), the offer needs to be $148k (18.3% below list).
- Recommended offer: $148k (18.3% below list) — sets the bar for 1% rule.
Location & tenants
- Location reads 66/100 on livability (#624 in TX) — a middle-class / working-renter tenant base. Strengths: cost of living A+, housing A+; Watch: amenities C-, crime F, commute F.
- Amarillo ISD (urban): math 44% / reading 41% proficiency, ranked #336 of 826 in TX (top 41%) — families likely to look elsewhere, expect single-tenant / working-renter base with shorter leases.
- Zoned schools: George Washington Carver Early Childhood Academy (338 students, 68% FRL); Fannin Middle (math 36% / reading 30%, grade F, #930 of 1,662 statewide, top 57%, 657 students, 79% FRL); Amtech Career Academy (3 students, 0% FRL).
- Market conditions: Rents rising fast (+6.0%/yr); 65 active listings in the ZIP; 20 comparable units currently listed for rent nearby; rentals at typical pace (median 23d on market — plan ~3-4 weeks tenant-placement turnaround); 45 units permitted in Randall County in 2024 (0 in 5+ unit buildings).
Forward outlook
- Local home prices are declining (-3.0%/yr); year-one equity from $1k of loan paydown is wiped out by about $5k of value loss. Plan a longer hold.
- Randall County population projected at +36% by 2050 — long-run rental-demand tailwind backs the buy-and-hold thesis.
Negotiation context
- It's been on market 17 days — a 2% lower offer ($178k) is reasonable based on typical stale-listing flexibility.
- 4 sale attempts since 2y ago with the ask held roughly flat each time — persistent listings suggest the price (not the market) is what's stuck; bring a comps-based counter.
Risks & watch-outs
- Watch-outs: built in 1958 — expect roof / HVAC / electrical / plumbing capex.
- Climate carrying-cost: severe wildfire risk — expect insurance premiums to compound above CPI over the hold.
Questions for the listing agent
- What do current leases actually rent for vs. the listed asking? Can we see a recent rent roll and the last 12 months of T-12 income?
- Built in 1958 — when were the roof, HVAC, electrical panel, plumbing, and water heater last replaced?
- Is there a deadline driving the sale (1031 exchange, divorce, estate, relocation)? That informs how much negotiation room exists.
- Schools are D-rated, which usually means shorter tenancies and higher turnover. Who's the typical renter profile here, and what's been the actual vacancy rate?
- Crime grade is F in this area — have there been break-ins, vandalism, or insurance claims at this property in the last 3 years? What carrier currently insures it and at what premium?
- The area grade is low — what's the realistic commute time and amenity access for the typical tenant pool here? Any planned neighborhood developments (good or bad) we should know about?
- What's the average days-on-market for RENTAL listings here right now (not sales)? A rising rental-DOM trend means longer vacancies and softer asking-rent achievability than the comps imply.
- What's the recent tenant-quality profile in this submarket — average credit score on applications, eviction rate, late-payment / NSF rate, and stable-employment percentage? A property-management company in the area should have these aggregated.
- How much new for-sale + rental construction is in the pipeline within 1–3 miles? Heavy new supply typically softens prices + rents 12–24 months out; constrained supply supports both.
Investment metrics
- 1% rule
- 0.82% ✗
- Cap rate
- 6.19%
- Cash-on-cash
- -0.37%
- DSCR
- 0.98
- GRM
- 10.2
CMA / ARV
No comps found within radius.
Projected returns pro-forma
-3.0% appreciation · 6.04% rent growth · sell at horizon
- IRR
- -13.8%
- Equity multiple
- 0.49×
- Total profit
- $-25,693
- Equity at exit
- $26,988
- IRR
- -0.9%
- Equity multiple
- 0.93×
- Total profit
- $-3,386
- Equity at exit
- $15,650
Cash invested: $50,680 (down + closing). Projections, not guarantees.
Landlord ↔ Tenant lean methodology
- Overall (STATE)
- 87 Strongly Landlord-Friendly
- State Texas
- 87 Strongly Landlord-Friendly · R+5
- County
- — inherits STATE
- City
- — inherits STATE
ZIP-level market 79110
- Rents YoY
- 6.0%
- Active inventory
- 65
- Price-to-rent
- 10.2×
Monthly cashflow live
- Estimated rent
- $1,479 high interval (Pro) →
- Mortgage (P&I)
- −$949
- Tax from tax record
- −$159 /mo · $1,912/yr
- Insurance
- −$75
- HOA
- −$0
- Vacancy / Maint / Mgmt
- −$311
- Net cashflow
- $-16
Break-even live
Sensitivity live
| Price | -10% $87 | -5% $35 | +0% $-16 | +5% $-67 | +10% $-118 |
|---|---|---|---|---|---|
| Rent | -10% $-133 | -5% $-74 | +0% $-16 | +5% $43 | +10% $101 |
| Rate | -1.0pp $75 | -0.5pp $30 | base $-16 | +0.5pp $-63 | +1.0pp $-110 |
UW: 25.0% down · 7.5% · 30yr · 1.5% tax · 5.0% vac · 8.0% maint · 8.0% mgmt
Financing live
Cash to close
- Down payment
- $45,250
- Closing costs
- $5,430
- Reserves months
- —
- Total cash needed
- —
Loan-product check · same deal, 3 products live
Conventional
25% down · 7.5% · 30yr
- Down + closing
- —
- Monthly P&I
- —
- Monthly cashflow
- —
- DSCR
- —
- Eligible?
- —
Personal DTI + credit; lowest rate.
DSCR
20% down · 8.5% · 30yr
- Down + closing
- —
- Monthly P&I
- —
- Monthly cashflow
- —
- DSCR
- —
- Eligible?
- —
No personal income docs; deal must DSCR.
Hard money
10% down · 12.0% · 12mo
- Down + closing
- —
- Monthly P&I
- —
- Monthly cashflow
- —
- DSCR
- —
- Eligible?
- —
Short-term bridge; refi at stabilization.
Rent comps 20 comps
| Address | Beds | Baths | Sqft | Rent | $/sqft | DOM | Units | Dist |
|---|---|---|---|---|---|---|---|---|
| 5315 Allen St Amarillo, TX | 3.0 | 1.0 | 891 | $1,200 | $1.35 | 22d | 1 | 0.32mi |
| 4623 Crockett St Amarillo, TX | 2.0 | 1.0 | 720 | $1,100 | $1.53 | 22d | 1 | 0.38mi |
| 5142 Crockett St Amarillo, TX | 3.0 | 2.0 | 1030 | $1,495 | $1.45 | 15d | 1 | 0.40mi |
| 4003 S Bowie St Amarillo, TX | 2.0 | 1.0 | 890 | $995 | $1.12 | 15d | 1 | 0.42mi |
| 4611 Cline Rd Amarillo, TX | 4.0 | 1.5 | 1500 | $1,500 | $1.00 | 22d | 1 | 0.46mi |
| 4615 S Lipscomb St Amarillo, TX | 3.0 | 2.0 | 1168 | $1,000 | $0.86 | 15d | 1 | 0.51mi |
| 4620 S Hayden St Amarillo, TX | 3.0 | 1.0 | 1036 | $1,475 | $1.42 | 22d | 1 | 0.57mi |
| 4316 S Hayden St Amarillo, TX | 3.0 | 1.5 | 1356 | $1,650 | $1.22 | 45d | 1 | 0.82mi |
| 5146 Susan Dr Amarillo, TX | 3.0 | 2.0 | 1244 | $1,675 | $1.35 | 22d | 1 | 0.98mi |
| 4308 S Jackson St Amarillo, TX | 3.0 | 1.0 | 1302 | $1,490 | $1.14 | 22d | 1 | 1.00mi |
| 4108 Crockett St Amarillo, TX | 3.0 | 1.0 | 1373 | $1,525 | $1.11 | 45d | 1 | 1.06mi |
| 6904 Mercury Trl Amarillo, TX | 3.0 | 2.0 | 1480 | $2,100 | $1.42 | 22d | 1 | 1.12mi |
| 6711 Athens St Amarillo, TX | 3.0 | 2.0 | 1350 | $1,975 | $1.46 | 15d | 1 | 1.14mi |
| 307 Mikeska St Amarillo, TX | 3.0 | 2.0 | 1250 | $1,800 | $1.44 | 22d | 1 | 1.17mi |
| 4205 S Tyler St Amarillo, TX | 2.0 | 1.0 | 852 | $925 | $1.09 | 45d | 1 | 1.25mi |
| 3813 S Washington St Unit B Amarillo, TX | 2.0 | 2.0 | 954 | $1,050 | $1.10 | 45d | 1 | 1.36mi |
| 4101 SW 45th Ave Amarillo, TX | 1.0–2.0 | 1.0 | 767 | $955 | $1.24 | 15d | 3 | 1.42mi |
| 608 Lochridge Amarillo, TX | 3.0 | 2.0 | 1455 | $1,900 | $1.31 | 45d | 1 | 1.42mi |
| 4109 Tucson Dr Amarillo, TX | 3.0 | 2.0 | 1395 | $1,950 | $1.40 | 22d | 1 | 1.47mi |
| 3703 S Monroe St Amarillo, TX | 2.0 | 1.0 | 750 | $1,100 | $1.47 | 22d | 1 | 1.50mi |
Listing history 13 events
-
2026-06-21days on market $181,000 Active 17 DOM
-
2026-06-18price $181,000 Active 14 DOM
-
2026-06-18days on market $182,000 Active 14 DOM
-
2026-06-17days on market $182,000 Active 13 DOM
-
2026-06-16days on market $182,000 Active 12 DOM
-
2026-06-15days on market $182,000 Active 11 DOM
-
2026-06-14days on market $182,000 Active 9 DOM
-
2026-06-13days on market $182,000 Active 8 DOM
-
2026-06-10days on market $182,000 Active 6 DOM
-
2026-06-09days on market $182,000 Active 5 DOM
-
2026-06-08days on market $182,000 Active 4 DOM
-
2026-06-07remarks 699-char remark
-
2026-06-07$182,000 Active 3 DOM
ⓘ Source: listings_history table (triggers on properties + properties_extension) + one-shot
backfill from property_details.listing_events for pre-trigger history.
Tax reassessment forecast TX · Resets to sale price
- Current annual tax
- $1,912 · $159/mo
- Projected year-2 tax
- $3,312 · $276/mo
- Expected delta
- +$1,400/yr (+$117/mo · 73.2%)
ⓘ Screening estimate from a state-policy table — verify with the county assessor before closing.
Climate risk First Street
- Flood 1/10 Low FEMA zone X (unshaded) · 0% chance over 30 yrs
- Wildfire 9/10 Extreme
- Heat 4/10 Moderate 7 d/yr ≥97°F today · 20 d/yr by 30 yrs out
- Wind 2/10 Low
- Air quality 2/10 Low 1 unhealthy d/yr today · 1 by 30 yrs out
Nearby sold comps map
Loading sold comps map…
Walkable amenities ~0.75 mi
Loading nearby amenities…
Taxation est. · year 1
- Rental income
- $17,744
- − Mortgage interest
- −$10,139
- − Property taxes
- −$1,912
- − Insurance
- −$905
- − Repairs & maintenance
- −$1,420
- − Management
- −$1,420
- − Depreciation
- −$5,265
- Taxable loss
- −$3,316
- Est. tax savings @ 24.0%
- +$796
- After-tax cash flow
- $607/yr
For passive investors: Depreciation is non-cash, so a rental often shows a tax loss while cash-flowing — sheltering income. Rental losses are passive: they offset passive income freely, and up to $25,000/yr can offset ordinary (W-2) income if you actively participate and your MAGI is under $100k (phasing out to $0 by $150k); unused losses carry forward. On sale, claimed depreciation is recaptured at up to 25%, and gains may owe capital-gains tax (a 1031 exchange can defer both). Figures are a year-1 estimate at your 24.0% rate — not tax advice; consult a CPA.
Schools (NCES district)
- District
- Amarillo ISD
- NCES district ID
- 4808130
- Math proficiency
- 44% ▼ -9.00%
- Reading proficiency
- 41% ▼ -3.00%
- Median HH income
- $43,478
- Composite
- 35.96/100
- National rank
- #4798
- State rank
- #336 of 826 in TX
Livability — Amarillo
- Score
- 66/100
- State rank
- #624
- US rank
- #11876
Category grades
Schools grade is shown separately in the Schools card above.
Census & demographics
- Census place
- Amarillo, TX
- County
- Randall County · 137,351 people
- City population
- 185,802
- Metro
- Amarillo, TX
- Population (ZIP)
- 16,994
- Household income
- $66,683
- Rent vs Own
- Severe rent burden
- 208.0
Population outlook (Randall County) Hauer SSP2
- Today (2025)
- 152,140 people
- By 2030
- 163,107 · +7.2%
- By 2040
- 184,999 · +21.6%
- By 2050
- 206,948 · +36.0%
- By 2075
- 260,204 · +71.0%
- By 2100
- 294,980 · +93.9%
Race, ethnicity, and origin ACS 2023
- Neighborhood character
- Majority White (61%)
- Race & ethnicity
- White 61% Hispanic / Latino 32% Two or more races 13% Black 4% Asian 1%
- Hispanic origin (detail)
- Mexican 29%
- Common ancestry
- Italian 2% Slovak 1% Lithuanian 1%
- Foreign-born
- 5% · Canada, Vietnam
- Languages at home
- 83% English-only · Spanish 13% Other Indo-European 2% Other Asian/Pacific 1%
Political lean MEDSL · Randall
- 2024 margin
- Solid R (+60.4) · D 19.4% · R 79.8%
- 2008→2024 swing
- +2.3pp toward D · 2008: -62.7pp · 2024: -60.4pp
- All cycles
- 2024: R+60.4 2020: R+58.8 2016: R+65.1 2012: R+68.2 2008: R+62.7
Not yet ingested
- Civics
- —
Market trends
- HPI YoY
- ▼ -226.16%
- Current HPI
- 180.2164
- Rent YoY
- ▲ 6.04%
- Metro
- Amarillo, TX
- State GDP YoY
- ▲ 3.95%
- F500 in state
- 110
Industry mix (Fortune 500 HQ in TX)
| Industry | F500 HQs | Revenue |
|---|---|---|
| Energy | 16 | $1,198B |
|
||
| Technology | 5 | $198B |
|
||
| Engineering / Construction | 4 | $72B |
|
||
| Energy Services | 3 | $60B |
|
||
| Utilities | 3 | $41B |
|
||
| Healthcare | 2 | $330B |
|
||
Price history
+73.3% since first listed13 events — show timeline
- 2026-06-05 Listed $182,000 AARMLS
- 2025-04-10 Sold (MLS) — AARMLS
- 2025-04-08 Sold (Public Records) — Public Records
- 2025-03-14 Contingent — AARMLS
- 2025-02-05 Price Changed $169,900 AARMLS
- 2025-02-05 Listed $164,900 AARMLS
- 2024-11-13 Sold (Public Records) — Public Records
- 2024-11-13 Sold (MLS) — AARMLS
- 2024-11-06 Contingent — AARMLS
- 2024-11-01 Relisted — AARMLS
- 2024-10-28 Contingent — AARMLS
- 2024-10-21 Listed $105,000 AARMLS
- 2005-06-13 Sold (Public Records) — Public Records
Property tax history
+1.8%/yrLatest (2025): $1,912 · -14.9% YoY. Source: county tax records.
Cash-flow waterfall
monthlySold comps — $/sqft
last 12 mo · ≤1 miLoading sold comps…