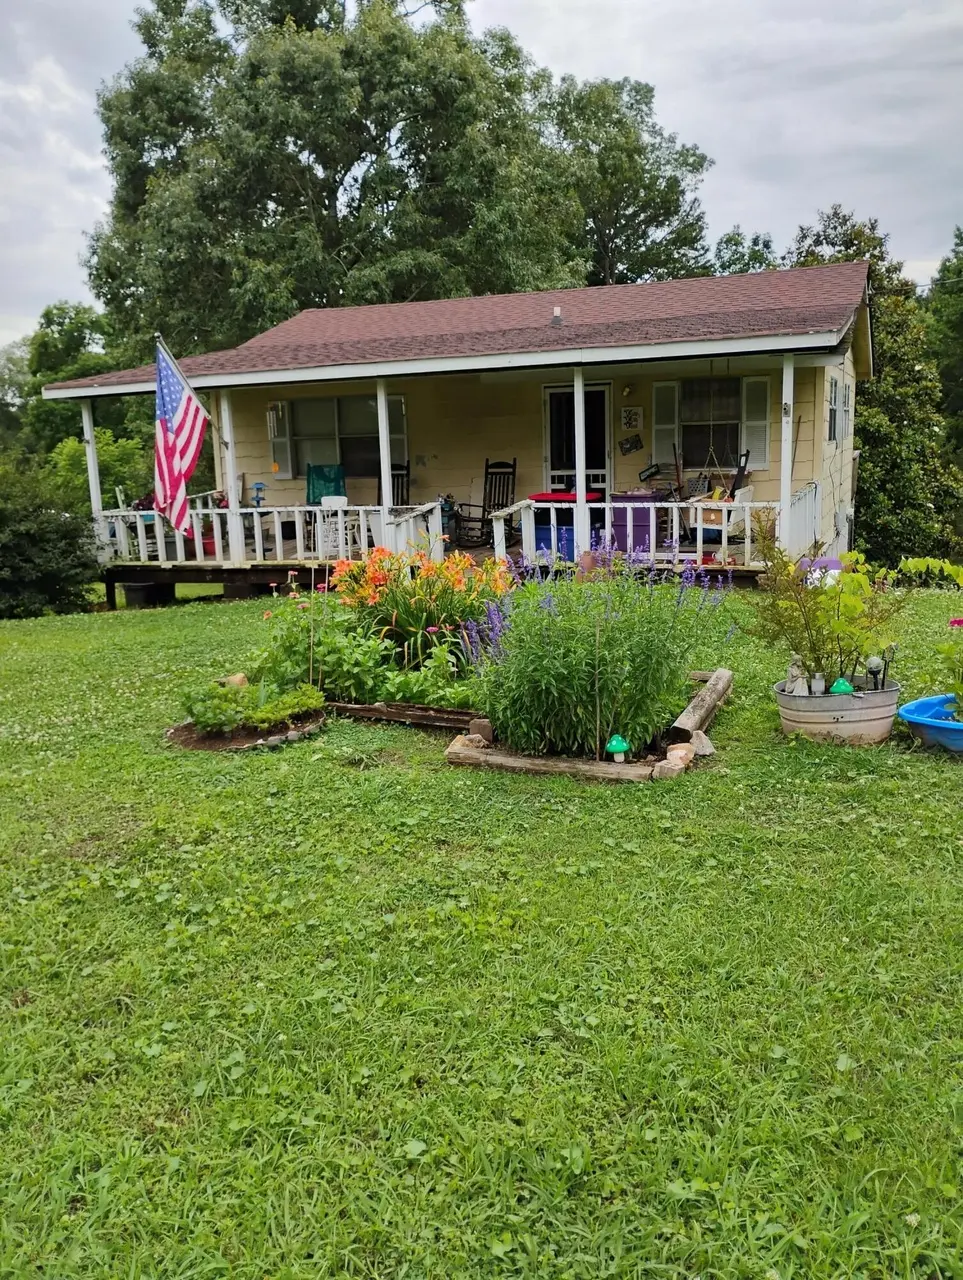
508 Pineywood Dr · Ringgold, GA
Flood risk 1/10 · Minimal
- FEMA flood zone
- X (unshaded)
- Chance of flooding over 30 yrs
- 0.0%
- Est. flood insurance / yr
- $507 – $1,088
Fire risk 4/10 · Minor
- Est. fire insurance / yr
- $963 – $1,789
Heat risk 5/10 · Moderate
- Hot days now (above 104°F)
- 7 days/yr
- Hot days in 30 yrs
- 19 days/yr
Wind risk 4/10 · Minor
- Chance of severe wind over 30 yrs
- 10.0%
Air-quality risk 3/10 · Minor
- Unhealthy air days now
- 2 days/yr
- Unhealthy air days in 30 yrs
- 2 days/yr
Risk factors via First Street. Map © Google.
Why this score? — see what drove the C+ grade
The composite is a weighted blend of 9 inputs, each scored 0–100. Each bar is that input's sub-score; the figure is the points it added to the 100-point composite (weight × sub-score).
- Cash flow +25.5/30.0
- DSCR +8.4/10.0
- ARV discount +7.5/15.0
- 1% rule +6.7/10.0
- Rent growth +4.2/5.0
- Livability +3.8/5.0
- Schools +3.3/10.0
- Condition / age +2.5/5.0
- Appreciation +0.0/10.0
$115,000
🖨 Deal sheet (PDF) 📄 Offer letter ✓ Due diligence
Listing remarks
By appointment only. Buyer to verify all information. No showings before June 12, 2026 More photos to follow
Key facts
- 0.74 acre lot
- Built 1987
- Listed 13 days
Property features AI
Finance
- Financial info: Tax annual amount listed
Exterior
- Parking: Driveway; Off-street parking
- Utilities: Public water; Septic tank; Electricity connected; Phone available; Water connected
- Home design: Single-family residence; One level; Fixer condition
- Construction: Wood siding; Shingle roof; Slab foundation; Built on a 0.74-acre lot (approximately 138 x 235)
- Exterior features: Deck; Covered porch
Interior
- Kitchen: Oven; Free-standing electric oven; Electric range; Electric oven
- Bedrooms: Total of 5 rooms (bedroom count not specified)
- Flooring: Carpet; Hardwood; Vinyl
- Bathrooms: 1 full bathroom
- Heating & cooling: Space heater; Window air conditioning unit(s)
- Interior features: Walk-in closet(s); Wood window frames; Unfinished basement
- Laundry & utility: Washer hookup; Electric dryer hookup; Inside laundry closet on the main level
Neighborhood map
What this means for you Summary
Snapshot
- This is a 2-bed/1.0-bath single-family listed at $115k.
Deal economics
- At list price, monthly cash flow is $268 ($3k/yr) — positive.
- The deal already cash-flows at list — no discount required.
- Meets the 1% rule at list price ($1k rent vs $115k).
- Cap rate 9.1% vs local median 3.2% in Ringgold — top-decile yield for the area; either an underpriced asset or a hidden risk that comps aren't pricing in. Stress-test before assuming the spread holds.
Location & tenants
- Location reads 76/100 on livability (#28 in GA, #3,772 nationally) — a middle-class / working-renter tenant base. Strengths: cost of living A+, health & safety A+, housing B; Watch: amenities C-, commute F, employment D-.
- Catoosa County (suburban): math 36% / reading 41% proficiency, ranked #49 of 174 in GA (top 28%) — families likely to look elsewhere, expect single-tenant / working-renter base with shorter leases.
- Zoned schools: Woodstation Elementary School (math 42% / reading 47%, grade F, #336 of 1,228 statewide, top 29%, 400 students, 42% FRL); Heritage Middle School (math 44% / reading 52%, grade C-, #80 of 470 statewide, top 17%, 882 students, 31% FRL); Heritage High School (math 38% / reading 45%, grade F, #52 of 424 statewide, top 12%, 1,242 students, 23% FRL).
- Market conditions: Rents rising fast (+6.8%/yr); 362 active listings in the ZIP; solid renter incomes; 848 units permitted in Catoosa County in 2024 (256 in 5+ unit buildings).
Forward outlook
- Local home prices are declining (-3.0%/yr); year-one equity from $795 of loan paydown is wiped out by about $3k of value loss. Plan a longer hold.
- Catoosa County population projected at +5% by 2050 — modest demand growth; plan on rents tracking national, not racing it.
- At projected returns (-3.0% appreciation + 6.8% rent growth), your $32k cash investment doubles in ~8 years — after that, you're playing with house money.
Negotiation context
- Only 13 days on market — expect competitive offers; lowballing is unlikely to land.
Risks & watch-outs
- Climate carrying-cost: extreme-heat days projected 7→19/yr by 2055 (HVAC capex compounding) — expect insurance premiums to compound above CPI over the hold.
Questions for the listing agent
- Is there a deadline driving the sale (1031 exchange, divorce, estate, relocation)? That informs how much negotiation room exists.
- What's the average days-on-market for RENTAL listings here right now (not sales)? A rising rental-DOM trend means longer vacancies and softer asking-rent achievability than the comps imply.
- What's the recent tenant-quality profile in this submarket — average credit score on applications, eviction rate, late-payment / NSF rate, and stable-employment percentage? A property-management company in the area should have these aggregated.
- How much new for-sale + rental construction is in the pipeline within 1–3 miles? Heavy new supply typically softens prices + rents 12–24 months out; constrained supply supports both.
Investment metrics
- 1% rule
- 1.17% ✓
- Cap rate
- 9.09%
- Cash-on-cash
- 9.99%
- DSCR
- 1.44
- GRM
- 7.1
CMA / ARV
No comps found within radius.
Projected returns pro-forma
-3.0% appreciation · 6.84% rent growth · sell at horizon
- IRR
- 3.0%
- Equity multiple
- 1.12×
- Total profit
- $3,856
- Equity at exit
- $17,147
- IRR
- 15.9%
- Equity multiple
- 2.53×
- Total profit
- $49,401
- Equity at exit
- $9,943
Cash invested: $32,200 (down + closing). Projections, not guarantees.
Landlord ↔ Tenant lean methodology
- Overall (STATE)
- 90 Strongly Landlord-Friendly
- State Georgia
- 90 Strongly Landlord-Friendly · R+3
- County
- — inherits STATE
- City
- — inherits STATE
ZIP-level market 30736
- Home prices YoY
- -21.9%
- Rents YoY
- 6.8%
- Active inventory
- 362
- Price-to-rent
- 7.1×
Monthly cashflow live
- Estimated rent
- $1,345 medium interval (Pro) →
- Mortgage (P&I)
- −$603
- Tax est. 1.5%
- −$144 /mo · $1,725/yr
- Insurance
- −$48
- HOA
- −$0
- Vacancy / Maint / Mgmt
- −$283
- Net cashflow
- $268
Break-even live
Sensitivity live
| Price | -10% $348 | -5% $308 | +0% $268 | +5% $228 | +10% $189 |
|---|---|---|---|---|---|
| Rent | -10% $162 | -5% $215 | +0% $268 | +5% $321 | +10% $374 |
| Rate | -1.0pp $326 | -0.5pp $297 | base $268 | +0.5pp $238 | +1.0pp $208 |
UW: 25.0% down · 7.5% · 30yr · 1.5% tax · 5.0% vac · 8.0% maint · 8.0% mgmt
Financing live
Cash to close
- Down payment
- $28,750
- Closing costs
- $3,450
- Reserves months
- —
- Total cash needed
- —
Loan-product check · same deal, 3 products live
Conventional
25% down · 7.5% · 30yr
- Down + closing
- —
- Monthly P&I
- —
- Monthly cashflow
- —
- DSCR
- —
- Eligible?
- —
Personal DTI + credit; lowest rate.
DSCR
20% down · 8.5% · 30yr
- Down + closing
- —
- Monthly P&I
- —
- Monthly cashflow
- —
- DSCR
- —
- Eligible?
- —
No personal income docs; deal must DSCR.
Hard money
10% down · 12.0% · 12mo
- Down + closing
- —
- Monthly P&I
- —
- Monthly cashflow
- —
- DSCR
- —
- Eligible?
- —
Short-term bridge; refi at stabilization.
Listing history 9 events
-
2026-06-21days on market $115,000 Active 13 DOM
-
2026-06-18pricedays on market $115,000 Active 10 DOM
-
2026-06-17days on market $120,000 Active 9 DOM
-
2026-06-16days on market $120,000 Active 8 DOM
-
2026-06-15days on market $120,000 Active 7 DOM
-
2026-06-14days on market $120,000 Active 5 DOM
-
2026-06-10days on market $120,000 Active 2 DOM
-
2026-06-09remarks 111-char remark
-
2026-06-09$120,000 Active 1 DOM
ⓘ Source: listings_history table (triggers on properties + properties_extension) + one-shot
backfill from property_details.listing_events for pre-trigger history.
Climate risk First Street
- Flood 1/10 Low FEMA zone X (unshaded) · 0% chance over 30 yrs
- Wildfire 4/10 Moderate
- Heat 5/10 Major 7 d/yr ≥104°F today · 19 d/yr by 30 yrs out
- Wind 4/10 Moderate 10% chance of damaging wind over 30 yrs
- Air quality 3/10 Moderate 2 unhealthy d/yr today · 2 by 30 yrs out
Nearby sold comps map
Loading sold comps map…
Walkable amenities ~0.75 mi
Loading nearby amenities…
Taxation est. · year 1
- Rental income
- $16,144
- − Mortgage interest
- −$6,442
- − Property taxes
- −$1,725
- − Insurance
- −$575
- − Repairs & maintenance
- −$1,291
- − Management
- −$1,291
- − Depreciation
- −$3,345
- Taxable income
- $1,473
- Est. tax owed @ 24.0%
- −$354
- After-tax cash flow
- $2,863/yr
For passive investors: Depreciation is non-cash, so a rental often shows a tax loss while cash-flowing — sheltering income. Rental losses are passive: they offset passive income freely, and up to $25,000/yr can offset ordinary (W-2) income if you actively participate and your MAGI is under $100k (phasing out to $0 by $150k); unused losses carry forward. On sale, claimed depreciation is recaptured at up to 25%, and gains may owe capital-gains tax (a 1031 exchange can defer both). Figures are a year-1 estimate at your 24.0% rate — not tax advice; consult a CPA.
Schools (NCES district)
- District
- Catoosa County
- NCES district ID
- 1300930
- Math proficiency
- 36% ▼ -15.00%
- Reading proficiency
- 41% ▼ -8.00%
- Median HH income
- $48,913
- Composite
- 33.13/100
- National rank
- #5558
- State rank
- #49 of 174 in GA
Livability — Ringgold
- Score
- 76/100
- State rank
- #28
- US rank
- #3772
Category grades
Schools grade is shown separately in the Schools card above.
Census & demographics
- County
- Catoosa County · 52,244 people
- City population
- 44,499
- Metro
- Chattanooga, TN-GA
- Population (ZIP)
- 44,499
- Household income
- $83,821
- Rent vs Own
- Severe rent burden
- 559.0
Population outlook (Catoosa County) Hauer SSP2
- Today (2025)
- 70,112 people
- By 2030
- 71,621 · +2.2%
- By 2040
- 73,595 · +5.0%
- By 2050
- 73,921 · +5.4%
- By 2075
- 72,135 · +2.9%
- By 2100
- 65,979 · -5.9%
Race, ethnicity, and origin ACS 2023
- Neighborhood character
- Predominantly White (89%)
- Race & ethnicity
- White 89% Two or more races 5% Hispanic / Latino 3% Black 2% Asian 1%
- Common ancestry
- Slovak 2% Italian 2% Serbian 2%
- Foreign-born
- 2% · Canada
- Languages at home
- 96% English-only · Spanish 2% Russian/Polish/Slavic 1%
Political lean MEDSL · Catoosa
- 2024 margin
- Solid R (+55.5) · D 22.0% · R 77.5%
- 2008→2024 swing
- -5.7pp toward R · 2008: -49.8pp · 2024: -55.5pp
- All cycles
- 2024: R+55.5 2020: R+56.0 2016: R+60.7 2012: R+52.8 2008: R+49.8
Not yet ingested
- Civics
- —
Market trends
- HPI YoY
- ▼ -70.42%
- Current HPI
- 251.8824
- Rent YoY
- ▲ 6.84%
- Metro
- Chattanooga, TN-GA
- State GDP YoY
- ▲ 2.66%
- F500 in state
- 28
Industry mix (Fortune 500 HQ in GA)
| Industry | F500 HQs | Revenue |
|---|---|---|
| Paper / Packaging | 2 | $29B |
|
||
| Retail | 1 | $160B |
|
||
| Transportation / Logistics | 1 | $91B |
|
||
| Airlines | 1 | $62B |
|
||
| Consumer Goods | 1 | $47B |
|
||
| Utilities | 1 | $25B |
|
||
Price history
1 event — show timeline
- 2026-06-08 Listed $120,000 GCAR
Property tax history
-7.9%/yrLatest (2022): $225 · -0.3% YoY. Source: county tax records.
Cash-flow waterfall
monthlySold comps — $/sqft
last 12 mo · ≤1 miLoading sold comps…