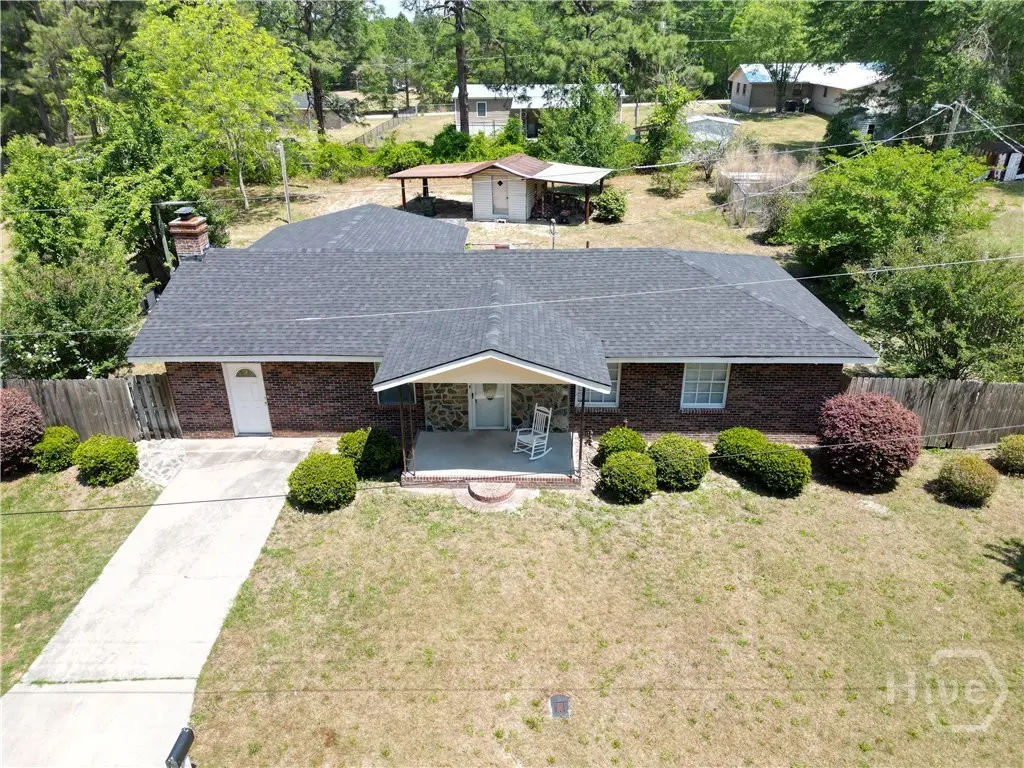
113 Elm St · Hagan, GA
Flood risk 1/10 · Minimal
- FEMA flood zone
- X (unshaded)
- Chance of flooding over 30 yrs
- 0.0%
- Est. flood insurance / yr
- $507 – $1,088
Fire risk 6/10 · Moderate
- Est. fire insurance / yr
- $963 – $1,789
Heat risk 8/10 · Major
- Hot days now (above 108°F)
- 7 days/yr
- Hot days in 30 yrs
- 18 days/yr
Wind risk 8/10 · Major
- Chance of severe wind over 30 yrs
- 80.0%
Air-quality risk 2/10 · Minimal
- Unhealthy air days now
- 1 days/yr
- Unhealthy air days in 30 yrs
- 1 days/yr
Risk factors via First Street. Map © Google.
Why this score? — see what drove the C- grade
The composite is a weighted blend of 9 inputs, each scored 0–100. Each bar is that input's sub-score; the figure is the points it added to the 100-point composite (weight × sub-score).
- Cash flow +17.6/30.0
- ARV discount +10.7/15.0
- DSCR +5.5/10.0
- Appreciation +5.0/10.0
- 1% rule +4.0/10.0
- Livability +3.2/5.0
- Rent growth +2.5/5.0
- Condition / age +2.5/5.0
- Schools +1.3/10.0
$166,900
🖨 Deal sheet (PDF) 📄 Offer letter ✓ Due diligence
Listing remarks
Beautiful brick and stone home with great curb appeal and major updates already completed! This 3-bedroom, 1.5-bath home offers 1,622 square feet of living space, a brand-new roof, brand-new HVAC system, brand-new water heater, new LVP flooring, and new kitchen appliances. The home features a classic brick exterior with an attractive stone front porch area that adds character and charm. Inside, you’ll find a spacious layout with a large addition off the back of the home, giving you extra living space and flexibility. The enclosed garage has exposed brick walls that create a warm, unique look and make the space ideal for a bonus room, den, office, or second living area. The primary bed
Key facts
- Brand new roof
- New lvp flooring
- 0.34 acre lot
Tags
Property features AI
Finance
- Other: Property listed by Rawls Realty; Directions: Take 280 to Firetower Rd, turn on Firetower to Delaoch Mill Rd, continue to Elm St
Exterior
- Utilities: Public water; Public sewer; Underground utilities
- Home design: Single-family residence; One story; Located in Groveland Heights subdivision
- Construction: Brick and stone construction
- Exterior features: Underground utilities; Public water; Public sewer
Interior
- Bathrooms: 1 full bathroom; 1 half bathroom
- Heating & cooling: Central heating (electric); Central air conditioning (electric)
- Interior features: Electric water heater
- Laundry & utility: Washer hookup
Neighborhood map
What this means for you Summary
Snapshot
- This is a 3-bed/1.5-bath single-family listed at $167k.
Deal economics
- At list price, monthly cash flow is $132 ($2k/yr) — positive.
- The deal already cash-flows at list — no discount required.
- To meet the 1% rule (rent ≥ 1% of price), the offer needs to be $150k (10.1% below list).
- Recommended offer: $150k (10.1% below list) — sets the bar for 1% rule.
Location & tenants
- Location reads 65/100 on livability (#223 in GA) — a middle-class / working-renter tenant base. Strengths: crime A+, cost of living A+, housing A+; Watch: schools F, amenities F, commute F.
- Evans County (rural): math 13% / reading 19% proficiency, ranked #153 of 174 in GA (top 88%) — low school quality limits family demand, transient renter base, plan for 1-2y turnover; 73% free/reduced lunch — lower-income household profile, screen leases tightly.
- Market conditions: 1 active listings in the ZIP; 1 comparable units currently listed for rent nearby; 26 units permitted in Evans County in 2024 (0 in 5+ unit buildings).
Forward outlook
- In year one you build about $6k of equity ($1k loan paydown + $5k appreciation (3.0% local appreciation)).
- Evans County population projected at -16% by 2050 — secular population decline; favor cash flow + early exit over multi-decade hold.
- At projected returns (3.0% appreciation + 3.0% rent growth), your $47k cash investment doubles in ~6 years — after that, you're playing with house money.
- By year 6, paydown + projected appreciation supports a ~$33k cash-out refi (75% LTV) — recoverable capital for the next deal without selling this one.
Negotiation context
- It's been on market 39 days — a 3% lower offer ($162k) is reasonable based on typical stale-listing flexibility.
- 3 sale attempts since 4y ago; this cycle's ask is 11027% above the opening price — seller raised mid-cycle; expect resistance to lowballs.
- Current owner paid $38k; list at $167k implies a 345% gain — meaningful room to come down on a strong offer.
Risks & watch-outs
- Climate carrying-cost: severe wind risk, 80% chance of damaging wind over 30y; major wildfire risk; extreme-heat days projected 7→18/yr by 2055 (HVAC capex compounding) — expect insurance premiums to compound above CPI over the hold.
Questions for the listing agent
- It's been on market 39 days. Have you received any prior offers? Is the seller open to a 10% concession, seller financing, or rate buy-down credit?
- Built in 1972 — when were the roof, HVAC, electrical panel, plumbing, and water heater last replaced?
- Is there a deadline driving the sale (1031 exchange, divorce, estate, relocation)? That informs how much negotiation room exists.
- Schools are F-rated, which usually means shorter tenancies and higher turnover. Who's the typical renter profile here, and what's been the actual vacancy rate?
- What's the average days-on-market for RENTAL listings here right now (not sales)? A rising rental-DOM trend means longer vacancies and softer asking-rent achievability than the comps imply.
- What's the recent tenant-quality profile in this submarket — average credit score on applications, eviction rate, late-payment / NSF rate, and stable-employment percentage? A property-management company in the area should have these aggregated.
- How much new for-sale + rental construction is in the pipeline within 1–3 miles? Heavy new supply typically softens prices + rents 12–24 months out; constrained supply supports both.
Investment metrics
- 1% rule
- 0.90% ✗
- Cap rate
- 7.24%
- Cash-on-cash
- 3.39%
- DSCR
- 1.15
- GRM
- 9.3
CMA / ARV
- ARV (median comp)
- $179,781
- List price
- $166,900
- Delta
- -7.16%
- Verdict
- FAIR
- Comps
- 4 within 1.0 mi
Projected returns pro-forma
3.0% appreciation · 3.0% rent growth · sell at horizon
- IRR
- 10.6%
- Equity multiple
- 1.61×
- Total profit
- $28,475
- Equity at exit
- $75,045
- IRR
- 12.9%
- Equity multiple
- 2.92×
- Total profit
- $89,557
- Equity at exit
- $115,654
Cash invested: $46,732 (down + closing). Projections, not guarantees.
Landlord ↔ Tenant lean methodology
- Overall (STATE)
- 90 Strongly Landlord-Friendly
- State Georgia
- 90 Strongly Landlord-Friendly · R+3
- County
- — inherits STATE
- City
- — inherits STATE
ZIP-level market 30414
- Active inventory
- 1
- Price-to-rent
- 9.3×
Monthly cashflow live
- Estimated rent
- $1,500 medium interval (Pro) →
- Mortgage (P&I)
- −$875
- Tax from tax record
- −$108 /mo · $1,298/yr
- Insurance
- −$70
- HOA
- −$0
- Vacancy / Maint / Mgmt
- −$315
- Net cashflow
- $132
Break-even live
Sensitivity live
| Price | -10% $227 | -5% $179 | +0% $132 | +5% $85 | +10% $38 |
|---|---|---|---|---|---|
| Rent | -10% $14 | -5% $73 | +0% $132 | +5% $191 | +10% $251 |
| Rate | -1.0pp $216 | -0.5pp $174 | base $132 | +0.5pp $89 | +1.0pp $45 |
UW: 25.0% down · 7.5% · 30yr · 1.5% tax · 5.0% vac · 8.0% maint · 8.0% mgmt
Financing live
Cash to close
- Down payment
- $41,725
- Closing costs
- $5,007
- Reserves months
- —
- Total cash needed
- —
Loan-product check · same deal, 3 products live
Conventional
25% down · 7.5% · 30yr
- Down + closing
- —
- Monthly P&I
- —
- Monthly cashflow
- —
- DSCR
- —
- Eligible?
- —
Personal DTI + credit; lowest rate.
DSCR
20% down · 8.5% · 30yr
- Down + closing
- —
- Monthly P&I
- —
- Monthly cashflow
- —
- DSCR
- —
- Eligible?
- —
No personal income docs; deal must DSCR.
Hard money
10% down · 12.0% · 12mo
- Down + closing
- —
- Monthly P&I
- —
- Monthly cashflow
- —
- DSCR
- —
- Eligible?
- —
Short-term bridge; refi at stabilization.
Rent comps 1 comps
| Address | Beds | Baths | Sqft | Rent | $/sqft | DOM | Units | Dist |
|---|---|---|---|---|---|---|---|---|
| 4151 U.S. 280 Claxton, GA | 3.0 | 2.0 | 1300 | $1,500 | $1.15 | 44d | 1 | 1.25mi |
Listing history 11 events
-
2026-06-02days on market $166,900 Active 39 DOM
-
2026-06-01days on market $166,900 Active 38 DOM
-
2026-05-31days on market $166,900 Active 37 DOM
-
2026-05-30days on market $166,900 Active 36 DOM
-
2026-05-11price $173,900 1657-char remark
-
2026-04-24$178,900 Active 1657-char remark
-
2025-11-06soldstatus $37,500
-
2025-11-06soldstatus $37,500
-
2022-02-01historical
-
2022-01-11$70,000 New
-
2005-12-29soldstatus $45,500
ⓘ Source: listings_history table (triggers on properties + properties_extension) + one-shot
backfill from property_details.listing_events for pre-trigger history.
Tax reassessment forecast GA · Resets to sale price
- Current annual tax
- $1,298 · $108/mo
- Projected year-2 tax
- $1,535 · $128/mo
- Expected delta
- +$237/yr (+$20/mo · 18.3%)
ⓘ Screening estimate from a state-policy table — verify with the county assessor before closing.
Climate risk First Street
- Flood 1/10 Low FEMA zone X (unshaded) · 0% chance over 30 yrs
- Wildfire 6/10 Major
- Heat 8/10 Severe 7 d/yr ≥108°F today · 18 d/yr by 30 yrs out
- Wind 8/10 Severe 80% chance of damaging wind over 30 yrs
- Air quality 2/10 Low 1 unhealthy d/yr today · 1 by 30 yrs out
Nearby sold comps map
Loading sold comps map…
Walkable amenities ~0.75 mi
Loading nearby amenities…
Taxation est. · year 1
- Rental income
- $18,000
- − Mortgage interest
- −$9,349
- − Property taxes
- −$1,298
- − Insurance
- −$834
- − Repairs & maintenance
- −$1,440
- − Management
- −$1,440
- − Depreciation
- −$4,855
- Taxable loss
- −$1,217
- Est. tax savings @ 24.0%
- +$292
- After-tax cash flow
- $1,876/yr
For passive investors: Depreciation is non-cash, so a rental often shows a tax loss while cash-flowing — sheltering income. Rental losses are passive: they offset passive income freely, and up to $25,000/yr can offset ordinary (W-2) income if you actively participate and your MAGI is under $100k (phasing out to $0 by $150k); unused losses carry forward. On sale, claimed depreciation is recaptured at up to 25%, and gains may owe capital-gains tax (a 1031 exchange can defer both). Figures are a year-1 estimate at your 24.0% rate — not tax advice; consult a CPA.
Schools (NCES district)
- District
- Evans County
- NCES district ID
- 1302070
- Math proficiency
- 13% ▼ -16.00%
- Reading proficiency
- 19% ▼ -10.00%
- Median HH income
- $38,397
- Composite
- 13.47/100
- National rank
- #9520
- State rank
- #153 of 174 in GA
Livability — Hagan
- Score
- 65/100
- State rank
- #223
- US rank
- #13161
Category grades
Schools grade is shown separately in the Schools card above.
Census & demographics
- Census place
- Hagan, GA
- City population
- 135
- Population (ZIP)
- 57
Population outlook (Evans County) Hauer SSP2
- Today (2025)
- 10,146 people
- By 2030
- 9,833 · -3.1%
- By 2040
- 9,202 · -9.3%
- By 2050
- 8,554 · -15.7%
- By 2075
- 7,123 · -29.8%
- By 2100
- 5,471 · -46.1%
Race, ethnicity, and origin ACS 2023
- Neighborhood character
- Predominantly White (100%)
- Race & ethnicity
- White 100%
Political lean MEDSL · Evans
- 2024 margin
- Solid R (+42.3) · D 28.6% · R 71.0%
- 2008→2024 swing
- -14.1pp toward R · 2008: -28.2pp · 2024: -42.3pp
- All cycles
- 2024: R+42.3 2020: R+36.8 2016: R+35.4 2012: R+28.1 2008: R+28.2
Not yet ingested
- Civics
- —
Market trends
- HPI YoY
- —
- Current HPI
- —
- Rent YoY
- —
- Metro
- —
- State GDP YoY
- ▲ 2.66%
- F500 in state
- 28
Industry mix (Fortune 500 HQ in GA)
| Industry | F500 HQs | Revenue |
|---|---|---|
| Paper / Packaging | 2 | $29B |
|
||
| Retail | 1 | $160B |
|
||
| Transportation / Logistics | 1 | $91B |
|
||
| Airlines | 1 | $62B |
|
||
| Consumer Goods | 1 | $47B |
|
||
| Utilities | 1 | $25B |
|
||
Price history
-96.7% since first listed10 events — show timeline
- 2026-06-03 Listed for Rent $1,500 APPFOLIO
- 2026-06-02 Listing Removed — Hive MLS
- 2026-05-23 Price Changed $166,900 Hive MLS
- 2026-05-11 Price Changed $173,900 Hive MLS
- 2026-04-24 Listed $178,900 Hive MLS
- 2025-11-06 Sold (Public Records) $37,500 Public Records
- 2025-11-06 Sold (Public Records) $37,500 Public Records
- 2022-02-01 Listing Removed — GAMLS
- 2022-01-11 Listed $70,000 GAMLS
- 2005-12-29 Sold (Public Records) $45,500 Public Records
Property tax history
+8.5%/yrLatest (2025): $1,298 · +8.8% YoY. Source: county tax records.
Cash-flow waterfall
monthlySold comps — $/sqft
last 12 mo · ≤1 miLoading sold comps…