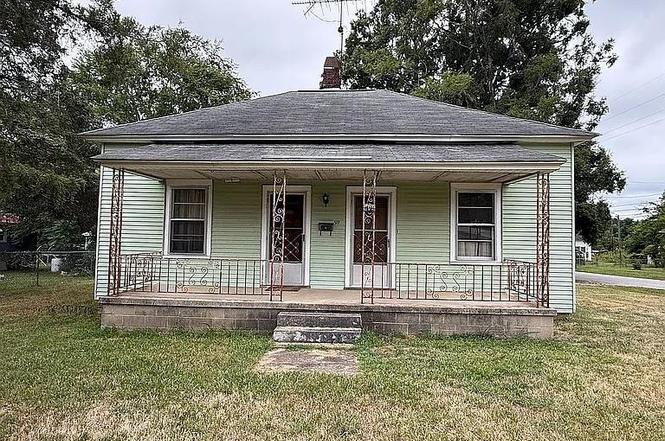
517 Barnwell St · Calhoun Falls, SC
Flood risk 1/10 · Minimal
- FEMA flood zone
- X (unshaded)
- Chance of flooding over 30 yrs
- 0.0%
- Est. flood insurance / yr
- $507 – $1,088
Fire risk 4/10 · Minor
- Est. fire insurance / yr
- $783 – $1,453
Heat risk 6/10 · Moderate
- Hot days now (above 106°F)
- 7 days/yr
- Hot days in 30 yrs
- 18 days/yr
Wind risk 6/10 · Moderate
- Chance of severe wind over 30 yrs
- 27.0%
Air-quality risk 3/10 · Minor
- Unhealthy air days now
- 2 days/yr
- Unhealthy air days in 30 yrs
- 4 days/yr
Risk factors via First Street. Map © Google.
Why this score? — see what drove the C grade
The composite is a weighted blend of 9 inputs, each scored 0–100. Each bar is that input's sub-score; the figure is the points it added to the 100-point composite (weight × sub-score).
- Cash flow +20.3/30.0
- Appreciation +9.8/10.0
- DSCR +6.4/10.0
- ARV discount +5.1/15.0
- 1% rule +4.9/10.0
- Schools +4.1/10.0
- Livability +3.2/5.0
- Rent growth +2.5/5.0
- Condition / age +2.5/5.0
$94,000
🖨 Deal sheet (PDF) 📄 Offer letter ✓ Due diligence
Listing remarks
2-bedroom, 1-bath home in Ware Shoals, SC! Sitting on a 0.27-acre corner lot, this property offers slightly more than 1,000 square foot of space. It's a fantastic opportunity for a rental property or personal residence. Located just minutes from Lake Secession and less than 20 minutes from Abbeville, you'll enjoy both outdoor recreation and easy access to nearby towns.
Key facts
- Corner lot
- 0.27 acre lot
- Built 1945
Tags
Property features AI
Exterior
- Utilities: Connected to sewer
- Home design: Single-family detached residence; Residential property
- Exterior features: Cleared lot
Interior
- Flooring: Hardwood
- Bathrooms: 1 full bathroom
- Heating & cooling: Central air; Electric heat
- Interior features: Hardwood flooring; Central air conditioning; Electric heating
Neighborhood map
What this means for you Summary
Snapshot
- This is a 2-bed/2.0-bath single-family listed at $94k.
Deal economics
- At list price, monthly cash flow is $121 ($1k/yr) — positive.
- The deal already cash-flows at list — no discount required.
- To meet the 1% rule (rent ≥ 1% of price), the offer needs to be $93k (1.0% below list).
- Recommended offer: $83k (12.0% below list) — sets the bar for market timing.
Location & tenants
- Location reads 63/100 on livability (#174 in SC) — a middle-class / working-renter tenant base. Strengths: cost of living A+, housing A+, crime A-; Watch: health & safety C-, amenities F, commute F.
- Abbeville 60 (rural): math 50% / reading 49% proficiency, ranked #15 of 80 in SC (top 19%) — families likely to look elsewhere, expect single-tenant / working-renter base with shorter leases.
- Zoned schools: John C. Calhoun Elementary (math 37% / reading 32%, grade F, #344 of 597 statewide, top 60%, 149 students, 100% FRL); Wright Middle (math 37% / reading 39%, grade F, #86 of 229 statewide, top 39%, 346 students, 100% FRL); Abbeville High (math 77% / reading 77%, grade A-, #28 of 196 statewide, top 16%, 473 students, 74% FRL) — zoned schools average 91% FRL vs 57% district-wide (35 pts higher); higher-poverty schools than district average — tighter screening recommended.
- Market conditions: 25 active listings in the ZIP; 145 units permitted in Abbeville County in 2024 (0 in 5+ unit buildings).
Forward outlook
- In year one you build about $10k of equity ($650 loan paydown + $9k appreciation (9.5% local appreciation)).
- Abbeville County population projected at -17% by 2050 — secular population decline; favor cash flow + early exit over multi-decade hold.
- At projected returns (9.5% appreciation + 3.0% rent growth), your $26k cash investment doubles in ~3 years — after that, you're playing with house money.
- By year 4, paydown + projected appreciation supports a ~$34k cash-out refi (75% LTV) — recoverable capital for the next deal without selling this one.
Negotiation context
- It's been on market 263 days — a 12% lower offer ($83k) is reasonable based on typical stale-listing flexibility.
- 2 sale attempts; this cycle's ask has dropped $16k (15%) from the opening price — seller is motivated, your offer sets the floor, not the list.
- Current owner paid $24k; list at $94k implies a 300% gain — meaningful room to come down on a strong offer.
Risks & watch-outs
- Watch-outs: built in 1945 — expect roof / HVAC / electrical / plumbing capex.
- Climate carrying-cost: major wind risk, 27% chance of damaging wind over 30y; extreme-heat days projected 7→18/yr by 2055 (HVAC capex compounding) — expect insurance premiums to compound above CPI over the hold.
Questions for the listing agent
- It's been on market 263 days. Have you received any prior offers? Is the seller open to a 12% concession, seller financing, or rate buy-down credit?
- Built in 1945 — when were the roof, HVAC, electrical panel, plumbing, and water heater last replaced?
- Why hasn't it sold? Are there any deal-killer items the seller is aware of (foundation, flood, title, zoning, code violations)?
- Is there a deadline driving the sale (1031 exchange, divorce, estate, relocation)? That informs how much negotiation room exists.
- Schools are D-rated, which usually means shorter tenancies and higher turnover. Who's the typical renter profile here, and what's been the actual vacancy rate?
- What's the average days-on-market for RENTAL listings here right now (not sales)? A rising rental-DOM trend means longer vacancies and softer asking-rent achievability than the comps imply.
- What's the recent tenant-quality profile in this submarket — average credit score on applications, eviction rate, late-payment / NSF rate, and stable-employment percentage? A property-management company in the area should have these aggregated.
- How much new for-sale + rental construction is in the pipeline within 1–3 miles? Heavy new supply typically softens prices + rents 12–24 months out; constrained supply supports both.
Investment metrics
- 1% rule
- 0.99% ✗
- Cap rate
- 7.83%
- Cash-on-cash
- 5.50%
- DSCR
- 1.24
- GRM
- 8.4
CMA / ARV
- ARV (on-the-fly)
- $89,232
- Comps found
- 9
Show comp detail 9 sales within ~0.75 mi
| Address | Dist | Beds/Ba | Sqft | Sold | Price | $/sf | Match |
|---|---|---|---|---|---|---|---|
| 453 Marion St | 0.37mi | 2/2.0 | 1,020 (+1%) | 4mo | $70,000 | $69 | 78 |
| 614 and 618 Aiken St | 0.36mi | 2/1.0 | 1,062 (+5%) | 1mo | $94,000 | $89 | 70 |
| 342 N Hampton Ave | 0.27mi | 2/1.0 | 904 (-11%) | 1mo | $132,000 | $146 | 64 |
| 634 Anderson St | 0.15mi | 2/1.0 | 1,104 (+9%) | 14mo | $95,000 | $86 | 62 |
| 109 S Butler Ave | 0.48mi | 3/1.5 (+1) | 1,000 (-1%) | 11mo | $52,500 | $53 | 59 |
| 145 E Savannah St | 0.43mi | 2/1.0 | 990 (-2%) | 21mo | $13,000 | $13 | 54 |
| 314 Washington St | 0.36mi | 2/1.0 | 914 (-10%) | 11mo | $98,500 | $108 | 54 |
| 342 N Hampton Ave | 0.28mi | 2/1.0 | 904 (-11%) | 15mo | $80,000 | $88 | 52 |
| 165 Tugaloo St St S | 0.65mi | 3/1.0 (+1) | 984 (-3%) | 16mo | $130,000 | $132 | 42 |
Match score weights: distance 35% · size 25% · config 20% · recency 20%. Top-matched comps best support the ARV.
Projected returns pro-forma
9.51% appreciation · 3.0% rent growth · sell at horizon
- IRR
- 27.3%
- Equity multiple
- 3.12×
- Total profit
- $55,739
- Equity at exit
- $81,345
- IRR
- 24.0%
- Equity multiple
- 6.98×
- Total profit
- $157,327
- Equity at exit
- $171,991
Cash invested: $26,320 (down + closing). Projections, not guarantees.
Landlord ↔ Tenant lean methodology
- Overall (STATE)
- 90 Strongly Landlord-Friendly
- State South Carolina
- 90 Strongly Landlord-Friendly · R+6
- County
- — inherits STATE
- City
- — inherits STATE
ZIP-level market 29628
- Home prices YoY
- 4.5%
- Active inventory
- 25
- Price-to-rent
- 8.4×
Monthly cashflow live
- Estimated rent
- $931 medium interval (Pro) →
- Mortgage (P&I)
- −$493
- Tax from tax record
- −$82 /mo · $988/yr
- Insurance
- −$39
- HOA
- −$0
- Vacancy / Maint / Mgmt
- −$195
- Net cashflow
- $121
Break-even live
Sensitivity live
| Price | -10% $174 | -5% $147 | +0% $121 | +5% $94 | +10% $68 |
|---|---|---|---|---|---|
| Rent | -10% $47 | -5% $84 | +0% $121 | +5% $157 | +10% $194 |
| Rate | -1.0pp $168 | -0.5pp $145 | base $121 | +0.5pp $96 | +1.0pp $72 |
UW: 25.0% down · 7.5% · 30yr · 1.5% tax · 5.0% vac · 8.0% maint · 8.0% mgmt
Financing live
Cash to close
- Down payment
- $23,500
- Closing costs
- $2,820
- Reserves months
- —
- Total cash needed
- —
Loan-product check · same deal, 3 products live
Conventional
25% down · 7.5% · 30yr
- Down + closing
- —
- Monthly P&I
- —
- Monthly cashflow
- —
- DSCR
- —
- Eligible?
- —
Personal DTI + credit; lowest rate.
DSCR
20% down · 8.5% · 30yr
- Down + closing
- —
- Monthly P&I
- —
- Monthly cashflow
- —
- DSCR
- —
- Eligible?
- —
No personal income docs; deal must DSCR.
Hard money
10% down · 12.0% · 12mo
- Down + closing
- —
- Monthly P&I
- —
- Monthly cashflow
- —
- DSCR
- —
- Eligible?
- —
Short-term bridge; refi at stabilization.
Listing history 20 events
-
2026-06-22days on market $94,000 Active 263 DOM
-
2026-06-18days on market $94,000 Active 260 DOM
-
2026-06-17days on market $94,000 Active 259 DOM
-
2026-06-16days on market $94,000 Active 258 DOM
-
2026-06-15days on market $94,000 Active 257 DOM
-
2026-06-13days on market $94,000 Active 255 DOM
-
2026-06-10days on market $94,000 Active 252 DOM
-
2026-06-09days on market $94,000 Active 251 DOM
-
2026-06-08days on market $94,000 Active 250 DOM
-
2026-06-07days on market $94,000 Active 249 DOM
-
2026-06-03days on market $94,000 Active 245 DOM
-
2026-06-03days on market $94,000 Active 244 DOM
-
2026-06-01days on market $94,000 Active 243 DOM
-
2026-05-31days on market $94,000 Active 242 DOM
-
2026-03-20status Active
-
2026-03-20price $94,000
-
2026-03-12historical
-
2025-11-07price $99,900
-
2025-09-22$110,000 Active
-
2009-06-10soldstatus $23,500
ⓘ Source: listings_history table (triggers on properties + properties_extension) + one-shot
backfill from property_details.listing_events for pre-trigger history.
Tax reassessment forecast SC · Resets to sale price
- Current annual tax
- $988 · $82/mo
- Projected year-2 tax
- $988 · $82/mo
- Expected delta
- $0/yr ($0/mo · 0.0%)
ⓘ Screening estimate from a state-policy table — verify with the county assessor before closing.
Climate risk First Street
- Flood 1/10 Low FEMA zone X (unshaded) · 0% chance over 30 yrs
- Wildfire 4/10 Moderate
- Heat 6/10 Major 7 d/yr ≥106°F today · 18 d/yr by 30 yrs out
- Wind 6/10 Major 27% chance of damaging wind over 30 yrs
- Air quality 3/10 Moderate 2 unhealthy d/yr today · 4 by 30 yrs out
Nearby sold comps map
Loading sold comps map…
Walkable amenities ~0.75 mi
Loading nearby amenities…
Taxation est. · year 1
- Rental income
- $11,167
- − Mortgage interest
- −$5,265
- − Property taxes
- −$988
- − Insurance
- −$470
- − Repairs & maintenance
- −$893
- − Management
- −$893
- − Depreciation
- −$2,735
- Taxable loss
- −$78
- Est. tax savings @ 24.0%
- +$19
- After-tax cash flow
- $1,467/yr
For passive investors: Depreciation is non-cash, so a rental often shows a tax loss while cash-flowing — sheltering income. Rental losses are passive: they offset passive income freely, and up to $25,000/yr can offset ordinary (W-2) income if you actively participate and your MAGI is under $100k (phasing out to $0 by $150k); unused losses carry forward. On sale, claimed depreciation is recaptured at up to 25%, and gains may owe capital-gains tax (a 1031 exchange can defer both). Figures are a year-1 estimate at your 24.0% rate — not tax advice; consult a CPA.
Schools (NCES district)
- District
- Abbeville 60
- NCES district ID
- 4500690
- Math proficiency
- 50% ▼ -12.00%
- Reading proficiency
- 49% ▼ -7.00%
- Median HH income
- $34,522
- Composite
- 40.9/100
- National rank
- #3618
- State rank
- #15 of 80 in SC
Livability — Calhoun Falls
- Score
- 63/100
- State rank
- #174
- US rank
- #15527
Category grades
Schools grade is shown separately in the Schools card above.
Census & demographics
- Census place
- Calhoun Falls, SC
- Population (ZIP)
- 2,405
Population outlook (Abbeville County) Hauer SSP2
- Today (2025)
- 24,141 people
- By 2030
- 23,446 · -2.9%
- By 2040
- 21,768 · -9.8%
- By 2050
- 20,098 · -16.7%
- By 2075
- 16,518 · -31.6%
- By 2100
- 13,125 · -45.6%
Race, ethnicity, and origin ACS 2023
- Neighborhood character
- Majority Black (53%)
- Race & ethnicity
- Black 53% White 43% Two or more races 4%
- Common ancestry
- Italian 1% Lithuanian 1% Serbian 1%
Political lean MEDSL · Abbeville
- 2024 margin
- Solid R (+42.4) · D 28.2% · R 70.6% · Other 1.2%
- 2008→2024 swing
- -27.2pp toward R · 2008: -15.2pp · 2024: -42.4pp
- All cycles
- 2024: R+42.4 2020: R+33.1 2016: R+28.3 2012: R+13.4 2008: R+15.2
Not yet ingested
- Civics
- —
Market trends
- HPI YoY
- ▲ 9.51%
- Current HPI
- 218.3679
- Rent YoY
- —
- Metro
- —
- State GDP YoY
- ▲ 4.51%
- F500 in state
- 2
Industry mix (Fortune 500 HQ in SC)
| Industry | F500 HQs | Revenue |
|---|---|---|
| Packaging | 1 | $7B |
|
||
Price history
+300.0% since first listed6 events — show timeline
- 2026-03-20 Relisted — GAOR
- 2026-03-20 Price Changed $94,000 GAOR
- 2026-03-12 Delisted — GAOR
- 2025-11-07 Price Changed $99,900 GAOR
- 2025-09-22 Listed $110,000 GAOR
- 2009-06-10 Sold (Public Records) $23,500 Public Records
Property tax history
+3.1%/yrLatest (2025): $988 · +34.0% YoY. Source: county tax records.
Cash-flow waterfall
monthlySold comps — $/sqft
last 12 mo · ≤1 miLoading sold comps…