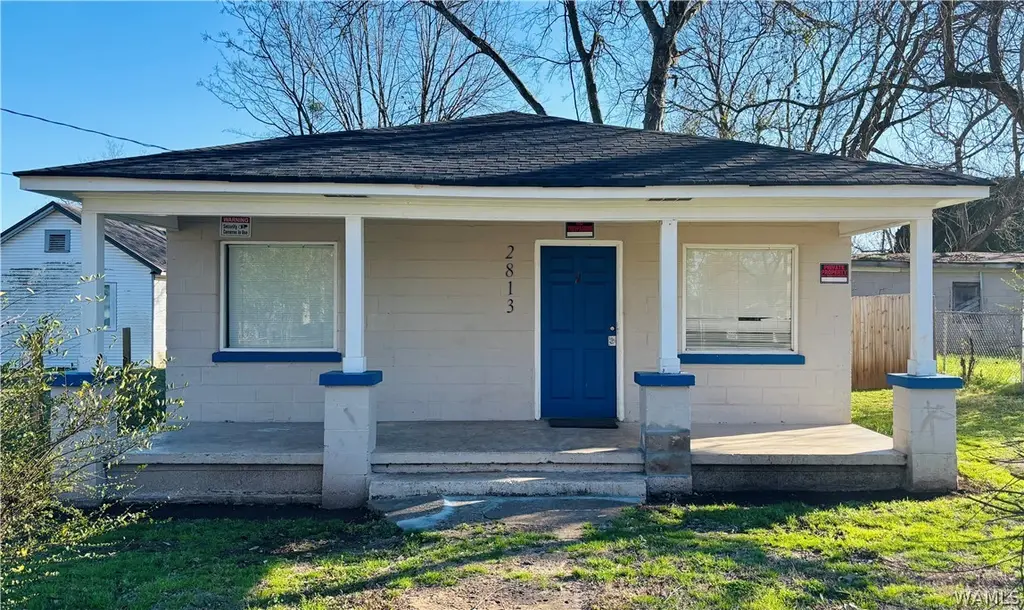
2813 Short 20th St St · Tuscaloosa, AL
Flood risk 1/10 · Minimal
- FEMA flood zone
- X (unshaded)
- Chance of flooding over 30 yrs
- 0.0%
- Est. flood insurance / yr
- $507 – $1,088
Fire risk 2/10 · Minimal
- Est. fire insurance / yr
- $916 – $1,700
Heat risk 7/10 · Major
- Hot days now (above 108°F)
- 7 days/yr
- Hot days in 30 yrs
- 20 days/yr
Wind risk 6/10 · Moderate
- Chance of severe wind over 30 yrs
- 56.0%
Air-quality risk 1/10 · Minimal
- Unhealthy air days now
- 0 days/yr
- Unhealthy air days in 30 yrs
- 0 days/yr
Risk factors via First Street. Map © Google.
Why this score? — see what drove the C grade
The composite is a weighted blend of 9 inputs, each scored 0–100. Each bar is that input's sub-score; the figure is the points it added to the 100-point composite (weight × sub-score).
- Cash flow +29.5/30.0
- DSCR +10.0/10.0
- 1% rule +7.2/10.0
- Rent growth +4.1/5.0
- Livability +3.9/5.0
- Schools +2.5/10.0
- Condition / age +2.5/5.0
- ARV discount +0.0/15.0
- Appreciation +0.0/10.0
$105,900
🖨 Deal sheet (PDF) 📄 Offer letter ✓ Due diligence
Listing remarks MLS
For Sale! Great Opportunity for First-Time Buyers or Investors! Charming older 3-bedroom, 1-bath home full of potential! This property is a great opportunity for first-time homebuyers looking to build equity or investors searching for their next project. The home offers three bedrooms, one full bathroom, and plenty of room to make it your own. With a little updating and personal touch, this house could truly shine. Whether you're looking for an affordable place to call home or a property to renovate and add to your investment portfolio, this one is worth a look!
Key facts
- 4,356 sq ft lot
- Built 1920
- Listed 100 days
Neighborhood map
What this means for you Summary
Snapshot
- This is a 3-bed/1.0-bath single-family listed at $106k.
Deal economics
- At list price, monthly cash flow is $380 ($5k/yr) — positive.
- The deal already cash-flows at list — no discount required.
- Meets the 1% rule at list price ($1k rent vs $106k).
- Recommended offer: $96k (9.0% below list) — sets the bar for market timing.
- Cap rate 10.6% vs local median 3.4% in Tuscaloosa — top-decile yield for the area; either an underpriced asset or a hidden risk that comps aren't pricing in. Stress-test before assuming the spread holds.
Location & tenants
- Location reads 77/100 on livability (#9 in AL, #2,909 nationally) — a middle-class / working-renter tenant base. Strengths: amenities A+, health & safety A+, cost of living A; Watch: crime F, employment D-.
- Tuscaloosa City (urban): math 19% / reading 40% proficiency, ranked #74 of 129 in AL (top 57%) — low school quality limits family demand, transient renter base, plan for 1-2y turnover.
- Zoned schools: Martin L King Jr Elementary School (math 2% / reading 22%, grade F, #536 of 627 statewide, top 88%, 503 students, 82% FRL); Westlawn Middle School (math 0% / reading 18%, grade F, #235 of 257 statewide, top 93%, 534 students, 93% FRL); Central High School (math 12% / reading 17%, grade F, #220 of 305 statewide, top 77%, 783 students, 84% FRL) — zoned schools average 86% FRL vs 59% district-wide (27 pts higher); higher-poverty schools than district average — tighter screening recommended.
- Zoned-school proficiency averages 12% at this address vs 30% district-wide (-18 pts) — the specific schools serving this property underperform the Tuscaloosa City average; the district grade overstates school quality for this exact location.
- Market conditions: Rents rising fast (+6.3%/yr); 307 active listings in the ZIP; 22 comparable units currently listed for rent nearby; rentals lingering (median 46d on market — plan ~5-8 weeks vacancy on turnover, expect pricing pressure); 59% of comp listings sitting > 30 days — soft ceiling on asking rent; lower-income renter base — watch delinquency; 622 units permitted in Tuscaloosa County in 2024 (69 in 5+ unit buildings).
Forward outlook
- Local home prices are declining (-3.0%/yr); year-one equity from $732 of loan paydown is wiped out by about $3k of value loss. Plan a longer hold.
- Tuscaloosa County population projected at +26% by 2050 — long-run rental-demand tailwind backs the buy-and-hold thesis.
- At projected returns (-3.0% appreciation + 6.3% rent growth), your $30k cash investment doubles in ~7 years — after that, you're playing with house money.
Negotiation context
- It's been on market 100 days — a 9% lower offer ($96k) is reasonable based on typical stale-listing flexibility.
- 3 sale attempts since 3y ago with the ask held roughly flat each time — persistent listings suggest the price (not the market) is what's stuck; bring a comps-based counter.
Risks & watch-outs
- Watch-outs: built in 1920 — expect roof / HVAC / electrical / plumbing capex.
- Climate carrying-cost: major wind risk, 56% chance of damaging wind over 30y; extreme-heat days projected 7→20/yr by 2055 (HVAC capex compounding) — expect insurance premiums to compound above CPI over the hold.
Questions for the listing agent
- It's been on market 100 days. Have you received any prior offers? Is the seller open to a 9% concession, seller financing, or rate buy-down credit?
- Built in 1920 — when were the roof, HVAC, electrical panel, plumbing, and water heater last replaced?
- Why hasn't it sold? Are there any deal-killer items the seller is aware of (foundation, flood, title, zoning, code violations)?
- Is there a deadline driving the sale (1031 exchange, divorce, estate, relocation)? That informs how much negotiation room exists.
- Crime grade is F in this area — have there been break-ins, vandalism, or insurance claims at this property in the last 3 years? What carrier currently insures it and at what premium?
- What's the average days-on-market for RENTAL listings here right now (not sales)? A rising rental-DOM trend means longer vacancies and softer asking-rent achievability than the comps imply.
- What's the recent tenant-quality profile in this submarket — average credit score on applications, eviction rate, late-payment / NSF rate, and stable-employment percentage? A property-management company in the area should have these aggregated.
- How much new for-sale + rental construction is in the pipeline within 1–3 miles? Heavy new supply typically softens prices + rents 12–24 months out; constrained supply supports both.
Investment metrics
- 1% rule
- 1.22% ✓
- Cap rate
- 10.60%
- Cash-on-cash
- 15.38%
- DSCR
- 1.68
- GRM
- 6.8
CMA / ARV
- ARV (median comp)
- $72,861
- List price
- $105,900
- Delta
- 45.35%
- Verdict
- OVERPRICED
- Comps
- 20 within 1.0 mi
Show comp detail 12 sales within ~0.75 mi
| Address | Dist | Beds/Ba | Sqft | Sold | Price | $/sf | Match |
|---|---|---|---|---|---|---|---|
| 3018 20th St | 0.17mi | 2/1.0 (-1) | 1,062 (+2%) | 10mo | $60,000 | $56 | 75 |
| 2409 Ty Rogers Jr Ave | 0.29mi | 3/1.0 | 1,050 (+1%) | 18mo | $110,000 | $105 | 70 |
| 3009 Short 19th | 0.17mi | 3/1.5 | 1,145 (+10%) | 8mo | $66,122 | $58 | 67 |
| 1927 M L K Jr Blvd | 0.30mi | 3/1.0 | 1,008 (-3%) | 22mo | $65,000 | $64 | 63 |
| 2921 23rd St | 0.18mi | 3/1.5 | 984 (-5%) | 21mo | $75,000 | $76 | 63 |
| 2832 26th St | 0.29mi | 3/1.0 | 1,120 (+8%) | 16mo | $125,900 | $112 | 61 |
| 2826 24th St | 0.19mi | 3/2.0 | 1,112 (+7%) | 22mo | $190,000 | $171 | 57 |
| 1917 Fosters Ferry Rd | 0.60mi | 3/1.0 | 928 (-11%) | 6mo | $59,900 | $65 | 49 |
| 1608 Ty Rogers Jr. Ave | 0.34mi | 3/1.0 | 1,172 (+13%) | 20mo | $65,000 | $55 | 46 |
| 2622 20th St | 0.42mi | 2/2.0 (-1) | 1,164 (+12%) | 8mo | $40,900 | $35 | 45 |
| 2317 Herman Ave | 0.68mi | 3/2.0 | 1,196 (+15%) | 14mo | $170,000 | $142 | 28 |
| 3619 19th St | 0.71mi | 2/1.0 (-1) | 888 (-15%) | 18mo | $78,500 | $88 | 23 |
Match score weights: distance 35% · size 25% · config 20% · recency 20%. Top-matched comps best support the ARV.
Projected returns pro-forma
-3.0% appreciation · 6.29% rent growth · sell at horizon
- IRR
- 9.5%
- Equity multiple
- 1.39×
- Total profit
- $11,436
- Equity at exit
- $15,790
- IRR
- 21.0%
- Equity multiple
- 3.04×
- Total profit
- $60,414
- Equity at exit
- $9,156
Cash invested: $29,652 (down + closing). Projections, not guarantees.
Landlord ↔ Tenant lean methodology
- Overall (STATE)
- 90 Strongly Landlord-Friendly
- State Alabama
- 90 Strongly Landlord-Friendly · R+15
- County
- — inherits STATE
- City
- — inherits STATE
ZIP-level market 35401
- Rents YoY
- 6.3%
- Active inventory
- 307
- Price-to-rent
- 6.8×
Monthly cashflow live
- Estimated rent
- $1,294 high interval (Pro) →
- Mortgage (P&I)
- −$555
- Tax from tax record
- −$43 /mo · $515/yr
- Insurance
- −$44
- HOA
- −$0
- Vacancy / Maint / Mgmt
- −$272
- Net cashflow
- $380
Break-even live
Sensitivity live
| Price | -10% $440 | -5% $410 | +0% $380 | +5% $350 | +10% $320 |
|---|---|---|---|---|---|
| Rent | -10% $278 | -5% $329 | +0% $380 | +5% $431 | +10% $482 |
| Rate | -1.0pp $433 | -0.5pp $407 | base $380 | +0.5pp $353 | +1.0pp $325 |
UW: 25.0% down · 7.5% · 30yr · 1.5% tax · 5.0% vac · 8.0% maint · 8.0% mgmt
Financing live
Cash to close
- Down payment
- $26,475
- Closing costs
- $3,177
- Reserves months
- —
- Total cash needed
- —
Loan-product check · same deal, 3 products live
Conventional
25% down · 7.5% · 30yr
- Down + closing
- —
- Monthly P&I
- —
- Monthly cashflow
- —
- DSCR
- —
- Eligible?
- —
Personal DTI + credit; lowest rate.
DSCR
20% down · 8.5% · 30yr
- Down + closing
- —
- Monthly P&I
- —
- Monthly cashflow
- —
- DSCR
- —
- Eligible?
- —
No personal income docs; deal must DSCR.
Hard money
10% down · 12.0% · 12mo
- Down + closing
- —
- Monthly P&I
- —
- Monthly cashflow
- —
- DSCR
- —
- Eligible?
- —
Short-term bridge; refi at stabilization.
Rent comps 22 comps
| Address | Beds | Baths | Sqft | Rent | $/sqft | DOM | Units | Dist |
|---|---|---|---|---|---|---|---|---|
| 2712 22nd St Tuscaloosa, AL | 4.0 | 2.0 | 1008 | $1,000 | $0.99 | 45d | 1 | 0.14mi |
| 2683 21st St Tuscaloosa, AL | 3.0 | 1.0 | 1324 | $895 | $0.68 | 23d | 1 | 0.22mi |
| 2720 21st St Tuscaloosa, AL | 4.0 | 1.0 | 1148 | $1,100 | $0.96 | 23d | 1 | 0.22mi |
| 2825 25th St Tuscaloosa, AL | 2.0 | 1.0 | 708 | $835 | $1.18 | 45d | 1 | 0.28mi |
| 3524 20th St Tuscaloosa, AL | 3.0 | 1.0 | 1050 | $1,100 | $1.05 | 45d | 1 | 0.61mi |
| 3316 16th St Tuscaloosa, AL | 3.0 | 1.0 | 1120 | $1,100 | $0.98 | 15d | 1 | 0.63mi |
| 3560 21st St Tuscaloosa, AL | 3.0 | 2.0 | 1230 | $1,570 | $1.28 | 23d | 1 | 0.63mi |
| 2405 Herman Ave Tuscaloosa, AL | 4.0 | 1.0 | 971 | $1,100 | $1.13 | 45d | 1 | 0.71mi |
| 3008 7th St Tuscaloosa, AL | 2.0 | 1.0 | 840 | $900 | $1.07 | 45d | 1 | 0.84mi |
| 1505 18th St Tuscaloosa, AL | 2.0 | 2.0 | 700 | $1,000 | $1.43 | 45d | 1 | 0.84mi |
| 2209 9th St #401 Tuscaloosa, AL | 2.0 | 2.0 | 1304 | $1,650 | $1.27 | 45d | 1 | 0.94mi |
| 711 36th Ave Tuscaloosa, AL | 2.0 | 1.0 | 920 | $900 | $0.98 | 15d | 1 | 0.95mi |
| 13 Meadowlawn Tuscaloosa, AL | 3.0 | 1.5 | 1260 | $1,100 | $0.87 | 45d | 1 | 1.09mi |
| 3416 36th Ct Tuscaloosa, AL | 3.0 | 2.0 | 1206 | $1,395 | $1.16 | 45d | 1 | 1.12mi |
| 1510 9th St #113 Tuscaloosa, AL | 2.0 | 2.0 | 1025 | $1,625 | $1.59 | 23d | 1 | 1.28mi |
| 900 Hargrove Rd Tuscaloosa, AL | 1.0–2.0 | 1.0–2.0 | 836 | $1,089 | $1.30 | 45d | 1 | 1.30mi |
| 917 Homewood Dr Tuscaloosa, AL | 3.0 | 3.0 | 1500 | $3,600 | $2.40 | 45d | 1 | 1.40mi |
| 1018 42nd Ave Tuscaloosa, AL | 3.0 | 1.0 | 1080 | $1,375 | $1.27 | 15d | 1 | 1.43mi |
| 1805 8th Ave Tuscaloosa, AL | 1.0–2.0 | 1.0–2.0 | 1175 | $1,380 | $1.17 | 45d | 1 | 1.45mi |
| 301 19th Ave Tuscaloosa, AL | 2.0 | 2.5 | 1200 | $2,200 | $1.83 | 23d | 1 | 1.47mi |
| 1925 8th Ave Tuscaloosa, AL | 1.0–2.0 | 1.0 | 794 | $1,054 | $1.33 | 15d | 1 | 1.47mi |
| 4342 Tari St Tuscaloosa, AL | 3.0 | 2.0 | 1340 | $1,750 | $1.31 | 45d | 1 | 1.48mi |
Listing history 24 events
-
2026-06-21days on market $105,900 Active 100 DOM
-
2026-06-18days on market $105,900 Active 97 DOM
-
2026-06-17days on market $105,900 Active 96 DOM
-
2026-06-16days on market $105,900 Active 95 DOM
-
2026-06-15days on market $105,900 Active 94 DOM
-
2026-06-14days on market $105,900 Active 92 DOM
-
2026-06-13days on market $105,900 Active 91 DOM
-
2026-06-10days on market $105,900 Active 89 DOM
-
2026-06-09days on market $105,900 Active 88 DOM
-
2026-06-08days on market $105,900 Active 87 DOM
-
2026-06-07days on market $105,900 Active 86 DOM
-
2026-06-05days on market $105,900 Active 83 DOM
-
2026-06-03days on market $105,900 Active 82 DOM
-
2026-06-02days on market $105,900 Active 81 DOM
-
2026-06-01days on market $105,900 Active 80 DOM
-
2026-05-31days on market $105,900 Active 79 DOM
-
2026-05-30days on market $105,900 Active 78 DOM
-
2026-03-13$105,900 Active 570-char remark
Show marketing remark (570 chars)
For Sale! Great Opportunity for First-Time Buyers or Investors! Charming older 3-bedroom, 1-bath home full of potential! This property is a great opportunity for first-time homebuyers looking to build equity or investors searching for their next project. The home offers three bedrooms, one full bathroom, and plenty of room to make it your own. With a little updating and personal touch, this house could truly shine. Whether you're looking for an affordable place to call home or a property to renovate and add to your investment portfolio, this one is worth a look!
-
2023-11-13soldstatus $103,500
-
2023-11-10soldstatus $103,500 Closed 408-char remark
Show marketing remark (408 chars)
Check out this completely renovated beautiful property. This property can be a great investment property or a first-time starter home for a lucky family. This home NEW floors, NEW HVAC unit, NEW screened windows, NEW plumbing, NEW roof, NEW bathroom, NEW kitchen, NEW cabinets and countertops throughout the house, and FRESH NEW paint! Come and view this property TODAY! Don't miss out on this beautiful gem!
-
2023-09-06$109,900 Active 408-char remark
Show marketing remark (408 chars)
Check out this completely renovated beautiful property. This property can be a great investment property or a first-time starter home for a lucky family. This home NEW floors, NEW HVAC unit, NEW screened windows, NEW plumbing, NEW roof, NEW bathroom, NEW kitchen, NEW cabinets and countertops throughout the house, and FRESH NEW paint! Come and view this property TODAY! Don't miss out on this beautiful gem!
-
2023-03-10soldstatus $41,000 Closed
-
2023-02-03status Pending
-
2023-01-25$49,900 Active
ⓘ Source: listings_history table (triggers on properties + properties_extension) + one-shot
backfill from property_details.listing_events for pre-trigger history.
Tax reassessment forecast AL · Resets to sale price
- Current annual tax
- $515 · $43/mo
- Projected year-2 tax
- $515 · $43/mo
- Expected delta
- $0/yr ($0/mo · 0.0%)
ⓘ Screening estimate from a state-policy table — verify with the county assessor before closing.
Climate risk First Street
- Flood 1/10 Low FEMA zone X (unshaded) · 0% chance over 30 yrs
- Wildfire 2/10 Low
- Heat 7/10 Severe 7 d/yr ≥108°F today · 20 d/yr by 30 yrs out
- Wind 6/10 Major 56% chance of damaging wind over 30 yrs
- Air quality 1/10 Low 0 unhealthy d/yr today · 0 by 30 yrs out
Nearby sold comps map
Loading sold comps map…
Walkable amenities ~0.75 mi
Loading nearby amenities…
Taxation est. · year 1
- Rental income
- $15,531
- − Mortgage interest
- −$5,932
- − Property taxes
- −$515
- − Insurance
- −$530
- − Repairs & maintenance
- −$1,242
- − Management
- −$1,242
- − Depreciation
- −$3,081
- Taxable income
- $2,989
- Est. tax owed @ 24.0%
- −$717
- After-tax cash flow
- $3,843/yr
For passive investors: Depreciation is non-cash, so a rental often shows a tax loss while cash-flowing — sheltering income. Rental losses are passive: they offset passive income freely, and up to $25,000/yr can offset ordinary (W-2) income if you actively participate and your MAGI is under $100k (phasing out to $0 by $150k); unused losses carry forward. On sale, claimed depreciation is recaptured at up to 25%, and gains may owe capital-gains tax (a 1031 exchange can defer both). Figures are a year-1 estimate at your 24.0% rate — not tax advice; consult a CPA.
Schools (NCES district)
- District
- Tuscaloosa City
- NCES district ID
- 0103360
- Math proficiency
- 19% ▼ -24.00%
- Reading proficiency
- 40% ▼ -1.00%
- Median HH income
- $37,474
- Composite
- 24.51/100
- National rank
- #7647
- State rank
- #74 of 129 in AL
Livability — Tuscaloosa
- Score
- 77/100
- State rank
- #9
- US rank
- #2909
Category grades
Schools grade is shown separately in the Schools card above.
Census & demographics
- Census place
- Tuscaloosa, AL
- County
- Tuscaloosa County · 206,491 people
- City population
- 134,228
- Metro
- Tuscaloosa, AL
- Population (ZIP)
- 43,459
- Household income
- $29,152
- Rent vs Own
- Severe rent burden
- 3997.0
Population outlook (Tuscaloosa County) Hauer SSP2
- Today (2025)
- 228,293 people
- By 2030
- 240,551 · +5.4%
- By 2040
- 263,856 · +15.6%
- By 2050
- 286,491 · +25.5%
- By 2075
- 335,783 · +47.1%
- By 2100
- 370,520 · +62.3%
Race, ethnicity, and origin ACS 2023
- Neighborhood character
- Diverse neighborhood (Simpson 0.58)
- Race & ethnicity
- Black 47% White 44% Hispanic / Latino 5% Two or more races 4% Asian 2%
- Common ancestry
- Slovak 2% Italian 1% Romanian 1%
- Foreign-born
- 3% · Canada, China
- Languages at home
- 96% English-only · Spanish 2% Other Indo-European 1% Chinese 1%
Political lean MEDSL · Tuscaloosa
- 2024 margin
- Strong R (+20.4) · D 39.4% · R 59.8%
- 2008→2024 swing
- -4.4pp toward R · 2008: -16.0pp · 2024: -20.4pp
- All cycles
- 2024: R+20.4 2020: R+14.8 2016: R+19.5 2012: R+17.4 2008: R+16.0
Not yet ingested
- Civics
- —
Market trends
- HPI YoY
- ▼ -191.40%
- Current HPI
- 179.8335
- Rent YoY
- ▲ 6.29%
- Metro
- Tuscaloosa, AL
- State GDP YoY
- ▲ 2.94%
- F500 in state
- 4
Industry mix (Fortune 500 HQ in AL)
| Industry | F500 HQs | Revenue |
|---|---|---|
| Financial Services | 1 | $8B |
|
||
| Healthcare | 1 | $5B |
|
||
Price history
+112.2% since first listed7 events — show timeline
- 2026-03-13 Listed $105,900 WAMLS
- 2023-11-13 Sold (Public Records) $103,500 Public Records
- 2023-11-10 Sold (MLS) $103,500 WAMLS
- 2023-09-06 Listed $109,900 WAMLS
- 2023-03-10 Sold (MLS) $41,000 WAMLS
- 2023-02-03 Pending — WAMLS
- 2023-01-25 Listed $49,900 WAMLS
Property tax history
+5.0%/yrLatest (2025): $515 · +36.6% YoY. Source: county tax records.
Cash-flow waterfall
monthlySold comps — $/sqft
last 12 mo · ≤1 miLoading sold comps…