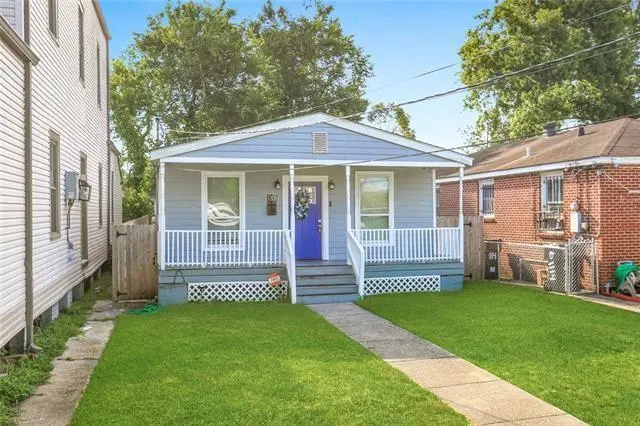
1108 Sumner St · New Orleans, LA
Flood risk 8/10 · Major
- FEMA flood zone
- X
- Chance of flooding over 30 yrs
- 0.6%
- Est. flood insurance / yr
- $507 – $1,088
Fire risk 1/10 · Minimal
- Est. fire insurance / yr
- $1,269 – $2,357
Heat risk 10/10 · Severe
- Hot days now (above 108°F)
- 7 days/yr
- Hot days in 30 yrs
- 21 days/yr
Wind risk 10/10 · Severe
- Chance of severe wind over 30 yrs
- 99.0%
Air-quality risk 2/10 · Minimal
- Unhealthy air days now
- 2 days/yr
- Unhealthy air days in 30 yrs
- 2 days/yr
Risk factors via First Street. Map © Google.
Why this score? — see what drove the C grade
The composite is a weighted blend of 9 inputs, each scored 0–100. Each bar is that input's sub-score; the figure is the points it added to the 100-point composite (weight × sub-score).
- Cash flow +25.0/30.0
- ARV discount +8.7/15.0
- DSCR +8.2/10.0
- 1% rule +6.0/10.0
- Livability +4.0/5.0
- Condition / age +2.5/5.0
- Rent growth +2.3/5.0
- Schools +1.6/10.0
- Appreciation +0.0/10.0
$150,000
🖨 Deal sheet (PDF) 📄 Offer letter ✓ Due diligence
Listing remarks MLS
Move-In Ready Algiers Cottage Priced to Sell at Just $150,000! Qualifies for 100% Financing & Down Payment Assistance Programs! <br><br> Why rent when you can own? This beautifully maintained 3-bedroom, 1.5-bath cottage offers an incredible opportunity for first-time homebuyers, investors, or anyone looking to build wealth through homeownership. <br><br> Step inside to discover a bright and inviting interior featuring updated flooring, neutral finishes, and a spacious living area filled with natural light. The renovated kitchen boasts granite countertops, rich wood cabinetry, Energy Star appliances, and plenty of workspace for everyday living and entertaining. <br><br> The thoughtfully designed floor plan includes three comfortable bedrooms and updated bathrooms with stylish finishes and marble accents. Outside, enjoy a large fully fenced backyard with plenty of room for pets, gardening, outdoor gatherings, or future improvements. <br><br> Located in desirable Flood Zone X, this home offers affordability without sacrificing comfort or location. <br><br> Even better: The property is currently equipped with window units for heating and cooling, and the seller is willing to assist with the costs toward installation of a central HVAC system with an acceptable offer. <br><br> This is an ideal starter home and a smart long-term investment. Live in the property for a year, build equity, then convert it into an income-producing rental while purchasing your next home--a proven strategy for creating long-term wealth through real estate. <br><br>
Key facts
- Off street parking
- Renovated bathrooms
- Refreshed kitchen
Tags
Property features AI
Exterior
- Parking: Driveway; Off-street parking; Three or more parking spaces
- Security: Closed-circuit camera(s)
- Utilities: Public water; Public sewer
- Home design: Single-story; Shingle roof; Vinyl siding; Raised foundation; Property in excellent condition
- Construction: Vinyl siding construction; Shingle roof; Raised foundation; Built on a 0.0992-acre lot
- Exterior features: Fence; City lot with rectangular shape (32 x 135)
Interior
- Kitchen: Dishwasher; Microwave; Oven; Range; ENERGY STAR qualified appliances
- Bedrooms: Total rooms: 9
- Bathrooms: 1 full bathroom; 1 half bathroom
- Heating & cooling: Has heating with multiple heating units and window unit; Has cooling with attic fan and window unit(s)
- Interior features: Attic; Ceiling fan(s); Granite counters; Pull-down attic stairs; Smart home features
Neighborhood map
What this means for you Summary
Snapshot
- This is a 3-bed/1.5-bath single-family listed at $150k.
Deal economics
- At list price, monthly cash flow is $261 ($3k/yr) — positive.
- The deal already cash-flows at list — no discount required.
- Meets the 1% rule at list price ($2k rent vs $150k).
- Cap rate 8.9% vs local median 4.4% in New Orleans — top-decile yield for the area; either an underpriced asset or a hidden risk that comps aren't pricing in. Stress-test before assuming the spread holds.
Location & tenants
- Location reads 81/100 on livability (#3 in LA, #1,383 nationally) — a professional / high-income tenant draw. Strengths: amenities A+, commute A+, health & safety A+; Watch: crime C-, employment D.
- Orleans Parish (urban): math 11% / reading 27% proficiency, ranked #69 of 98 in LA (top 70%) — low school quality limits family demand, transient renter base, plan for 1-2y turnover; 68% free/reduced lunch — lower-income household profile, screen leases tightly.
- Market conditions: Rents soft (-0.7%/yr); 265 active listings in the ZIP; 40 comparable units currently listed for rent nearby; rentals at typical pace (median 24d on market — plan ~3-4 weeks tenant-placement turnaround); lower-income renter base — watch delinquency; 710 units permitted in Orleans Parish in 2024 (244 in 5+ unit buildings).
- At $1,651/mo this rent would consume 46% of the median local household income ($43k/yr) (locally 2240% of renters already pay >50% of income on rent) — very limited rent-growth headroom before tenants either downsize or default.
Forward outlook
- Local home prices are declining (-3.0%/yr); year-one equity from $1k of loan paydown is wiped out by about $4k of value loss. Plan a longer hold.
- Orleans County population projected at +61% by 2050 — long-run rental-demand tailwind backs the buy-and-hold thesis.
Negotiation context
- Only 9 days on market — expect competitive offers; lowballing is unlikely to land.
- 20 sale attempts since 16y ago with the ask held roughly flat each time — persistent listings suggest the price (not the market) is what's stuck; bring a comps-based counter.
- Current owner paid $73k; list at $150k implies a 104% gain — meaningful room to come down on a strong offer.
Risks & watch-outs
- Watch-outs: flood insurance adds $66/mo.
- Climate carrying-cost: severe flood risk; severe wind risk, 99% chance of damaging wind over 30y; extreme-heat days projected 7→21/yr by 2055 (HVAC capex compounding) — expect insurance premiums to compound above CPI over the hold.
Questions for the listing agent
- Built in 1975 — when were the roof, HVAC, electrical panel, plumbing, and water heater last replaced?
- What's the actual annual flood-insurance premium (NFIP or private), and is the property in a SFHA with mandatory coverage?
- Is there a deadline driving the sale (1031 exchange, divorce, estate, relocation)? That informs how much negotiation room exists.
- What's the average days-on-market for RENTAL listings here right now (not sales)? A rising rental-DOM trend means longer vacancies and softer asking-rent achievability than the comps imply.
- What's the recent tenant-quality profile in this submarket — average credit score on applications, eviction rate, late-payment / NSF rate, and stable-employment percentage? A property-management company in the area should have these aggregated.
- How much new for-sale + rental construction is in the pipeline within 1–3 miles? Heavy new supply typically softens prices + rents 12–24 months out; constrained supply supports both.
Investment metrics
- 1% rule
- 1.10% ✓
- Cap rate
- 8.91%
- Cash-on-cash
- 9.35%
- DSCR
- 1.42
- GRM
- 7.6
CMA / ARV
- ARV (median comp)
- $154,275
- List price
- $150,000
- Delta
- 0.47%
- Verdict
- FAIR
- Comps
- 20 within 1.0 mi
Show comp detail 12 sales within ~0.75 mi
| Address | Dist | Beds/Ba | Sqft | Sold | Price | $/sf | Match |
|---|---|---|---|---|---|---|---|
| 1410 Hendee St | 0.24mi | 3/2.5 | 1,150 (-4%) | 0mo | $90,000 | $78 | 78 |
| 1056 Farragut St | 0.24mi | 3/1.0 | 1,279 (+7%) | 1mo | $85,000 | $66 | 75 |
| 2024 Lamarque St | 0.13mi | 3/2.0 | 1,350 (+12%) | 6mo | $151,500 | $112 | 66 |
| 1327 Shirley Dr | 0.39mi | 3/2.0 | 1,274 (+6%) | 6mo | $70,000 | $55 | 65 |
| 250 Wagner St | 0.64mi | 3/2.0 | 1,174 (-2%) | 7mo | $212,000 | $181 | 58 |
| 1518 Leboeuf St | 0.39mi | 2/1.0 (-1) | 1,095 (-9%) | 3mo | $15,000 | $14 | 58 |
| 1240 Merrill St | 0.72mi | 3/1.0 | 1,192 (-1%) | 9mo | $150,000 | $126 | 56 |
| 613 Pacific Ave | 0.65mi | 2/1.0 (-1) | 1,246 (+4%) | 2mo | $215,000 | $173 | 55 |
| 1416 Pace Blvd | 0.67mi | 3/1.0 | 1,118 (-7%) | 1mo | $140,000 | $125 | 54 |
| 1513 Shirley Dr | 0.51mi | 3/1.0 | 1,341 (+12%) | 2mo | $185,000 | $138 | 52 |
| 1623 Shirley Dr | 0.62mi | 2/2.0 (-1) | 1,275 (+6%) | 8mo | $70,000 | $55 | 46 |
| 532 Elmira Ave | 0.71mi | 2/2.0 (-1) | 1,300 (+8%) | 1mo | $350,000 | $269 | 46 |
Match score weights: distance 35% · size 25% · config 20% · recency 20%. Top-matched comps best support the ARV.
Projected returns pro-forma
-3.0% appreciation · 0.0% rent growth · sell at horizon
- IRR
- -8.4%
- Equity multiple
- 0.70×
- Total profit
- $-12,505
- Equity at exit
- $22,365
- IRR
- -3.3%
- Equity multiple
- 0.81×
- Total profit
- $-8,082
- Equity at exit
- $12,969
Cash invested: $42,000 (down + closing). Projections, not guarantees.
Landlord ↔ Tenant lean methodology
- Overall (STATE)
- 90 Strongly Landlord-Friendly
- State Louisiana
- 90 Strongly Landlord-Friendly · R+12
- County
- — inherits STATE
- City
- — inherits STATE
ZIP-level market 70114
- Rents YoY
- -0.7%
- Active inventory
- 265
- Price-to-rent
- 7.6×
Monthly cashflow live
- Estimated rent
- $1,651 high interval (Pro) →
- Mortgage (P&I)
- −$787
- Tax from tax record
- −$128 /mo · $1,535/yr
- Insurance
- −$62
- Flood insurance flood zone
- −$66 /mo · $798/yr
- HOA
- −$0
- Vacancy / Maint / Mgmt
- −$347
- Net cashflow
- $261
Break-even live
Sensitivity live
| Price | -10% $346 | -5% $303 | +0% $261 | +5% $218 | +10% $176 |
|---|---|---|---|---|---|
| Rent | -10% $130 | -5% $196 | +0% $261 | +5% $326 | +10% $391 |
| Rate | -1.0pp $336 | -0.5pp $299 | base $261 | +0.5pp $222 | +1.0pp $182 |
UW: 25.0% down · 7.5% · 30yr · 1.5% tax · 5.0% vac · 8.0% maint · 8.0% mgmt
Financing live
Cash to close
- Down payment
- $37,500
- Closing costs
- $4,500
- Reserves months
- —
- Total cash needed
- —
Loan-product check · same deal, 3 products live
Conventional
25% down · 7.5% · 30yr
- Down + closing
- —
- Monthly P&I
- —
- Monthly cashflow
- —
- DSCR
- —
- Eligible?
- —
Personal DTI + credit; lowest rate.
DSCR
20% down · 8.5% · 30yr
- Down + closing
- —
- Monthly P&I
- —
- Monthly cashflow
- —
- DSCR
- —
- Eligible?
- —
No personal income docs; deal must DSCR.
Hard money
10% down · 12.0% · 12mo
- Down + closing
- —
- Monthly P&I
- —
- Monthly cashflow
- —
- DSCR
- —
- Eligible?
- —
Short-term bridge; refi at stabilization.
Rent comps 40 comps
| Address | Beds | Baths | Sqft | Rent | $/sqft | DOM | Units | Dist |
|---|---|---|---|---|---|---|---|---|
| 1108 Sumner St New Orleans, LA | 3.0 | 1.5 | 1197 | $1,500 | $1.25 | 12d | 1 | 0.03mi |
| 810 Whitney Ave New Orleans, LA | 2.0 | 1.0 | 900 | $1,250 | $1.39 | 12d | 1 | 0.25mi |
| 1418 Behrman Ave New Orleans, LA | 2.0 | 1.0 | 876 | $1,400 | $1.60 | 16d | 1 | 0.27mi |
| 807 Whitney Ave Unit 1 New Orleans, LA | 3.0 | 2.0 | 1262 | $1,500 | $1.19 | 4d | 1 | 0.28mi |
| 701 Behrman Ave New Orleans, LA | 3.0 | 2.0 | 1368 | $2,300 | $1.68 | 4d | 1 | 0.28mi |
| 1421 Numa St Unit 1421 New Orleans, LA | 3.0 | 2.0 | 861 | $1,400 | $1.63 | 24d | 1 | 0.29mi |
| 1510 Sumner St New Orleans, LA | 2.0 | 1.0 | 950 | $1,474 | $1.55 | 16d | 1 | 0.31mi |
| 1421 23 Numa St New Orleans, LA | 3.0 | 2.0 | 861 | $1,400 | $1.63 | 2d | 1 | 0.32mi |
| 1421 23 Numa St New Orleans, LA | 3.0 | 2.0 | 861 | $1,400 | $1.63 | 15d | 1 | 0.32mi |
| 740 Thayer Unit 2A New Orleans, LA | 2.0 | 2.0 | 950 | $1,350 | $1.42 | 24d | 1 | 0.38mi |
| 909 Atlantic Ave New Orleans, LA | 2.0 | 1.0 | 741 | $1,200 | $1.62 | 24d | 1 | 0.48mi |
| 1625 Lauradale Dr New Orleans, LA | 3.0 | 2.0 | 1029 | $1,700 | $1.65 | 4d | 1 | 0.52mi |
| 625 Atlantic Ave New Orleans, LA | 2.0 | 1.0 | 780 | $1,400 | $1.79 | 17d | 1 | 0.56mi |
| 718 Majestic Pl New Orleans, LA | 3.0 | 2.0 | 1164 | $1,785 | $1.53 | 22d | 1 | 0.57mi |
| 335 Whitney Ave New Orleans, LA | 2.0 | 1.0 | 1100 | $1,575 | $1.43 | 24d | 1 | 0.58mi |
| 543 Atlantic Ave New Orleans, LA | 2.0 | 2.5 | 1430 | $2,200 | $1.54 | 24d | 1 | 0.59mi |
| 733 Elmira Ave New Orleans, LA | 2.0 | 1.0 | 864 | $1,100 | $1.27 | 24d | 1 | 0.62mi |
| 537 Pacific Ave New Orleans, LA | 2.0 | 1.0 | 750 | $1,400 | $1.87 | 4d | 1 | 0.65mi |
| 537 Pacific Ave New Orleans, LA | 2.0 | 1.0 | 750 | $1,400 | $1.87 | 3d | 1 | 0.65mi |
| 606 Drum St New Orleans, LA | 3.0 | 2.0 | 1131 | $2,350 | $2.08 | 24d | 1 | 0.70mi |
| 724 Evelina St Unit B New Orleans, LA | 2.0 | 1.0 | 1000 | $1,600 | $1.60 | 17d | 1 | 0.75mi |
| 620 Opelousas Ave Unit 103 New Orleans, LA | 2.0 | 1.5 | 1000 | $1,650 | $1.65 | 3d | 1 | 0.76mi |
| 507 Newton St New Orleans, LA | 2.0 | 2.0 | 1150 | $1,400 | $1.22 | 24d | 1 | 0.77mi |
| 336 Elmira Ave New Orleans, LA | 3.0 | 1.0 | 1250 | $1,825 | $1.46 | 24d | 1 | 0.78mi |
| 601 Vallette St New Orleans, LA | 2.0 | 1.0 | 815 | $1,600 | $1.96 | 3d | 1 | 0.79mi |
| 1200 Southlawn Blvd New Orleans, LA | 3.0 | 2.0 | 950 | $1,725 | $1.82 | 24d | 1 | 0.80mi |
| 325 Elmira Ave Unit 325 New Orleans, LA | 3.0 | 1.5 | 1050 | $1,525 | $1.45 | 24d | 1 | 0.81mi |
| 1140 Teche St Apt B New Orleans, LA | 3.0 | 1.0 | 1100 | $1,850 | $1.68 | 24d | 1 | 0.84mi |
| 1719 Pace Blvd New Orleans, LA | 3.0 | 1.0 | 1178 | $2,000 | $1.70 | 12d | 1 | 0.84mi |
| 329 Belleville St New Orleans, LA | 2.0 | 1.0 | 1014 | $1,500 | $1.48 | 24d | 1 | 0.85mi |
| 2243 Kraft Pl New Orleans, LA | 2.0 | 1.0 | 865 | $1,200 | $1.39 | 24d | 1 | 0.86mi |
| 1622 Jo Ann Pl New Orleans, LA | 3.0 | 1.5 | 1301 | $1,500 | $1.15 | 2d | 1 | 0.86mi |
| 400 Park Blvd Unit A New Orleans, LA | 4.0 | 1.5 | 1275 | $2,200 | $1.73 | 24d | 1 | 0.87mi |
| 1565 Murl St Unit B New Orleans, LA | 2.0 | 2.0 | 1100 | $1,100 | $1.00 | 24d | 1 | 0.88mi |
| 1136 Brooklyn Ave New Orleans, LA | 3.0 | 1.0 | 913 | $1,600 | $1.75 | 24d | 1 | 0.90mi |
| 3000 Americus St New Orleans, LA | 3.0 | 2.0 | 1280 | $1,400 | $1.09 | 24d | 1 | 0.95mi |
| 3102 Lawrence St New Orleans, LA | 2.0 | 1.0 | 950 | $1,500 | $1.58 | 24d | 1 | 0.96mi |
| 119 Vallette St New Orleans, LA | 3.0 | 2.5 | 1500 | $2,100 | $1.40 | 24d | 1 | 0.99mi |
| 519 Bouny St New Orleans, LA | 2.0 | 1.0 | 950 | $1,400 | $1.47 | 24d | 1 | 1.01mi |
| 521 Bouny St New Orleans, LA | 2.0 | 1.0 | 950 | $1,400 | $1.47 | 24d | 1 | 1.01mi |
Listing history 46 events
-
2026-06-18days on market $150,000 Active 9 DOM
-
2026-06-17days on market $150,000 Active 8 DOM
-
2026-06-16days on market $150,000 Active 7 DOM
-
2026-06-15days on market $150,000 Active 6 DOM
-
2026-06-13days on market $150,000 Active 4 DOM
-
2026-06-10remarks 695-char remark
-
2026-06-10pricedays on market $150,000 Active 1 DOM
-
2026-06-05days on market $155,000 Active 179 DOM
-
2026-06-03days on market $155,000 Active 178 DOM
-
2026-06-02days on market $155,000 Active 177 DOM
-
2026-06-01days on market $155,000 Active 176 DOM
-
2026-05-31days on market $155,000 Active 175 DOM
-
2026-05-20$1,500
-
2026-01-26price $155,000 796-char remark
-
2026-01-26price $155,000 1006-char remark
-
2025-12-06$159,000 Active 796-char remark
-
2025-12-06$159,000 Active 1006-char remark
-
2025-08-31$159,900 Active
-
2025-07-12price $169,000
-
2025-07-12price $169,000
-
2025-03-31$179,900 Active
-
2023-11-22historical $1,850
-
2023-08-04price $199,900
-
2023-07-18$1,850
-
2023-06-01$199,900
-
2022-08-16price $219,900
-
2022-08-08price $229,900
-
2022-08-08$219,900
-
2022-06-20$229,900
-
2017-06-13soldstatus $73,472
-
2017-06-09soldstatus $73,472 Sold
-
2017-04-21historical Pending Continue to Show
-
2017-04-18$72,500 Active
-
2017-04-17$72,500
-
2017-03-31historical
-
2016-12-06$87,500 Active
-
2016-12-01$87,500
-
2016-04-05historical
-
2016-01-06$43,500 Active
-
2016-01-06$43,500
-
2014-11-13$58,900
-
2014-11-13$58,900
-
2010-02-22$97,500
-
2010-02-22$97,500
-
1992-03-17soldstatus $10,000
-
1991-08-26soldstatus $26,045
ⓘ Source: listings_history table (triggers on properties + properties_extension) + one-shot
backfill from property_details.listing_events for pre-trigger history.
Tax reassessment forecast LA · Resets to sale price
- Current annual tax
- $1,535 · $128/mo
- Projected year-2 tax
- $1,535 · $128/mo
- Expected delta
- $0/yr ($0/mo · 0.0%)
ⓘ Screening estimate from a state-policy table — verify with the county assessor before closing.
Climate risk First Street
- Flood 8/10 Severe FEMA zone X · 60% chance over 30 yrs
- Wildfire 1/10 Low
- Heat 10/10 Extreme 7 d/yr ≥108°F today · 21 d/yr by 30 yrs out
- Wind 10/10 Extreme 99% chance of damaging wind over 30 yrs
- Air quality 2/10 Low 2 unhealthy d/yr today · 2 by 30 yrs out
Nearby sold comps map
Loading sold comps map…
Walkable amenities ~0.75 mi
Loading nearby amenities…
Taxation est. · year 1
- Rental income
- $19,812
- − Mortgage interest
- −$8,402
- − Property taxes
- −$1,535
- − Insurance
- −$1,547
- − Repairs & maintenance
- −$1,585
- − Management
- −$1,585
- − Depreciation
- −$4,364
- Taxable income
- $794
- Est. tax owed @ 24.0%
- −$190
- After-tax cash flow
- $2,939/yr
For passive investors: Depreciation is non-cash, so a rental often shows a tax loss while cash-flowing — sheltering income. Rental losses are passive: they offset passive income freely, and up to $25,000/yr can offset ordinary (W-2) income if you actively participate and your MAGI is under $100k (phasing out to $0 by $150k); unused losses carry forward. On sale, claimed depreciation is recaptured at up to 25%, and gains may owe capital-gains tax (a 1031 exchange can defer both). Figures are a year-1 estimate at your 24.0% rate — not tax advice; consult a CPA.
Schools (NCES district)
- District
- Orleans Parish
- NCES district ID
- 2201170
- Math proficiency
- 11% ▼ -52.00%
- Reading proficiency
- 27% ▼ -46.00%
- Median HH income
- $37,011
- Composite
- 15.78/100
- National rank
- #9271
- State rank
- #69 of 98 in LA
Livability — New Orleans
- Score
- 81/100
- State rank
- #3
- US rank
- #1383
Category grades
Schools grade is shown separately in the Schools card above.
Census & demographics
- Census place
- New Orleans, LA
- County
- Orleans Parish · 338,817 people
- City population
- 338,817
- Metro
- New Orleans-Metairie, LA
- Population (ZIP)
- 22,659
- Household income
- $43,493
- Rent vs Own
- Severe rent burden
- 2240.0
Population outlook (Orleans County) Hauer SSP2
- Today (2025)
- 513,025 people
- By 2030
- 575,781 · +12.2%
- By 2040
- 700,174 · +36.5%
- By 2050
- 826,541 · +61.1%
- By 2075
- 1,123,374 · +119.0%
- By 2100
- 1,355,609 · +164.2%
Race, ethnicity, and origin ACS 2023
- Neighborhood character
- Predominantly Black (72%)
- Race & ethnicity
- Black 72% White 16% Hispanic / Latino 8% Two or more races 5%
- Hispanic origin (detail)
- Mexican 2% Puerto Rican 1%
- Common ancestry
- Lithuanian 3% Slovak 1% Italian 1%
- Foreign-born
- 5% · Canada
- Languages at home
- 91% English-only · Spanish 6% French/Haitian/Cajun 2% Other Indo-European 1%
Political lean MEDSL · Orleans
- 2024 margin
- Solid D (+67.0) · D 82.2% · R 15.2% · Other 2.7%
- 2008→2024 swing
- +6.7pp toward D · 2008: 60.3pp · 2024: 67.0pp
- All cycles
- 2024: D+67.0 2020: D+68.2 2016: D+66.2 2012: D+62.5 2008: D+60.3
Not yet ingested
- Civics
- —
Market trends
- HPI YoY
- ▼ -98.56%
- Current HPI
- 149.0172
- Rent YoY
- ▼ -0.72%
- Metro
- New Orleans-Metairie, LA
- State GDP YoY
- ▲ 3.29%
- F500 in state
- 10
Industry mix (Fortune 500 HQ in LA)
| Industry | F500 HQs | Revenue |
|---|---|---|
| Telecommunications | 2 | $23B |
|
||
| Utilities | 1 | $12B |
|
||
| Wholesale / Distribution | 1 | $5B |
|
||
| Advertising | 1 | $2B |
|
||
Price history
-94.3% since first listed36 events — show timeline
- 2026-06-09 Price Changed $1,475 GSREIN
- 2026-06-09 Listed $150,000 GSREIN
- 2026-06-09 Listed $150,000 AcadianaMLS
- 2026-05-20 Listed for Rent $1,500 GSREIN
- 2026-01-26 Price Changed $155,000 AcadianaMLS
- 2026-01-26 Price Changed $155,000 GSREIN
- 2025-12-06 Listed $159,000 AcadianaMLS
- 2025-08-31 Listed $159,900 AcadianaMLS
- 2025-07-12 Price Changed $169,000 AcadianaMLS
- 2025-07-12 Price Changed $169,000 GSREIN
- 2025-03-31 Listed $179,900 AcadianaMLS
- 2023-11-22 Rental Removed $1,850 GSREIN
- 2023-08-04 Price Changed $199,900 GSREIN
- 2023-07-18 Listed for Rent $1,850 GSREIN
- 2023-06-01 Listed $199,900 AcadianaMLS
- 2022-08-16 Price Changed $219,900 GSREIN
- 2022-08-08 Price Changed $229,900 GSREIN
- 2022-08-08 Listed $219,900 AcadianaMLS
- 2022-06-20 Listed $229,900 AcadianaMLS
- 2017-06-13 Sold (Public Records) $73,472 Public Records
- 2017-06-09 Sold (MLS) $73,472 GSREIN
- 2017-04-21 Contingent — GSREIN
- 2017-04-18 Listed $72,500 GSREIN
- 2017-04-17 Listed $72,500 AcadianaMLS
- 2017-03-31 Listing Removed — GSREIN
- 2016-12-06 Listed $87,500 GSREIN
- 2016-12-01 Listed $87,500 AcadianaMLS
- 2016-04-05 Listing Removed — GSREIN
- 2016-01-06 Listed $43,500 GSREIN
- 2016-01-06 Listed $43,500 AcadianaMLS
- 2014-11-13 Listed $58,900 GSREIN
- 2014-11-13 Listed $58,900 AcadianaMLS
- 2010-02-22 Listed $97,500 GSREIN
- 2010-02-22 Listed $97,500 AcadianaMLS
- 1992-03-17 Sold (Public Records) $10,000 Public Records
- 1991-08-26 Sold (Public Records) $26,045 Public Records
Property tax history
+2.3%/yrLatest (2026): $1,535 · +0.0% YoY. Source: county tax records.
Cash-flow waterfall
monthlySold comps — $/sqft
last 12 mo · ≤1 miLoading sold comps…