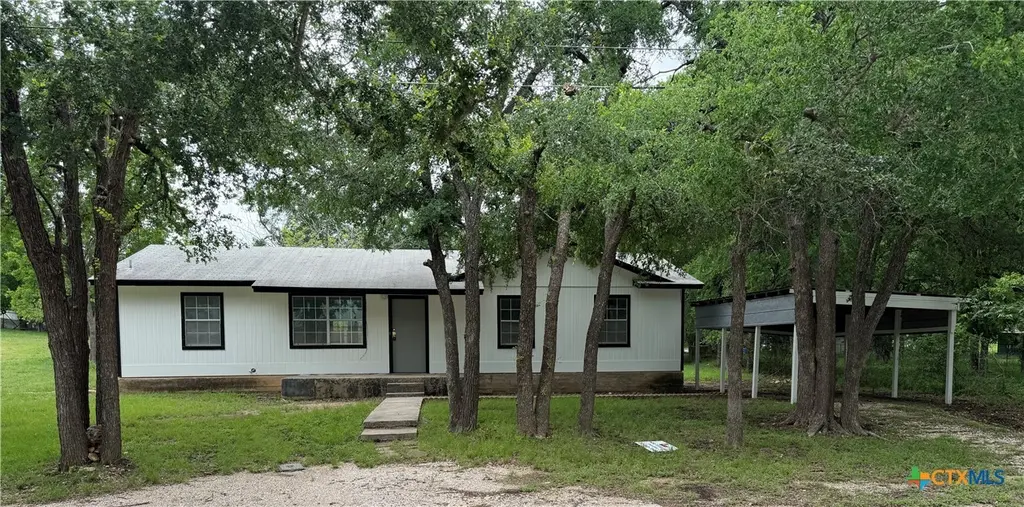
408 N Spring St · Lampasas, TX
Flood risk 1/10 · Minimal
- FEMA flood zone
- X
- Chance of flooding over 30 yrs
- 0.0%
- Est. flood insurance / yr
- $507 – $1,088
Fire risk 5/10 · Moderate
- Est. fire insurance / yr
- $1,222 – $2,270
Heat risk 7/10 · Major
- Hot days now (above 106°F)
- 7 days/yr
- Hot days in 30 yrs
- 22 days/yr
Wind risk 6/10 · Moderate
- Chance of severe wind over 30 yrs
- 48.0%
Air-quality risk 1/10 · Minimal
- Unhealthy air days now
- 0 days/yr
- Unhealthy air days in 30 yrs
- 0 days/yr
Risk factors via First Street. Map © Google.
Why this score? — see what drove the C grade
The composite is a weighted blend of 9 inputs, each scored 0–100. Each bar is that input's sub-score; the figure is the points it added to the 100-point composite (weight × sub-score).
- Cash flow +20.0/30.0
- ARV discount +15.0/15.0
- DSCR +6.3/10.0
- 1% rule +5.8/10.0
- Schools +3.8/10.0
- Livability +3.8/5.0
- Rent growth +2.5/5.0
- Condition / age +2.2/5.0
- Appreciation +0.0/10.0
$165,000
🖨 Deal sheet 📄 Offer letter ✓ Due diligence
Listing remarks MLS
3-bedroom, 1.5-bath home on a spacious lot in Lampasas offering a great opportunity for buyers looking to make a home their own. Functional layout with comfortable living space and a large yard with mature trees. Property includes a 1-car carport and plenty of outdoor space for additional use or future improvements. Convenient location with easy access to town amenities. Ideal for buyers seeking value and potential.
Key facts
- 8,973 sq ft lot
- Parking
- Built 1984
Neighborhood map
What this means for you Summary
Snapshot
- This is a 3-bed/1.5-bath single-family listed at $165k. Condition is rated fair.
Deal economics
- At list price, monthly cash flow is $202 ($2k/yr) — positive.
- The deal already cash-flows at list — no discount required.
- Meets the 1% rule at list price ($2k rent vs $165k).
- Recommended offer: $160k (3.0% below list) — sets the bar for market timing.
- Cap rate 7.8% vs local median 2.0% in Lampasas — top-decile yield for the area; either an underpriced asset or a hidden risk that comps aren't pricing in. Stress-test before assuming the spread holds.
Location & tenants
- Location reads 75/100 on livability (#123 in TX, #3,832 nationally) — a middle-class / working-renter tenant base. Strengths: cost of living A+, housing A+, health & safety A+; Watch: schools D+, employment D, crime F.
- Lampasas ISD (rural): math 42% / reading 46% proficiency, ranked #278 of 826 in TX (top 34%) — families likely to look elsewhere, expect single-tenant / working-renter base with shorter leases.
- Market conditions: 342 active listings in the ZIP; 3 comparable units currently listed for rent nearby; rentals leasing fast (median 14d on market — plan ~1-2 weeks tenant-placement turnaround); 18 units permitted in Lampasas County in 2024 (0 in 5+ unit buildings).
Forward outlook
- Local home prices are declining (-3.0%/yr); year-one equity from $1k of loan paydown is wiped out by about $5k of value loss. Plan a longer hold.
- Lampasas County population projected at +10% by 2050 — modest demand growth; plan on rents tracking national, not racing it.
Negotiation context
- It's been on market 59 days — a 3% lower offer ($160k) is reasonable based on typical stale-listing flexibility.
- 4 sale attempts with the ask held roughly flat each time — persistent listings suggest the price (not the market) is what's stuck; bring a comps-based counter.
Risks & watch-outs
- Climate carrying-cost: major wind risk, 48% chance of damaging wind over 30y; moderate wildfire risk; extreme-heat days projected 7→22/yr by 2055 (HVAC capex compounding) — expect insurance premiums to compound above CPI over the hold.
Questions for the listing agent
- It's been on market 59 days. Have you received any prior offers? Is the seller open to a 3% concession, seller financing, or rate buy-down credit?
- Have any recent inspections been done? Can we get a copy of the seller's disclosures and any deferred-maintenance estimates?
- Is there a deadline driving the sale (1031 exchange, divorce, estate, relocation)? That informs how much negotiation room exists.
- Schools are D-rated, which usually means shorter tenancies and higher turnover. Who's the typical renter profile here, and what's been the actual vacancy rate?
- Crime grade is F in this area — have there been break-ins, vandalism, or insurance claims at this property in the last 3 years? What carrier currently insures it and at what premium?
- What's the average days-on-market for RENTAL listings here right now (not sales)? A rising rental-DOM trend means longer vacancies and softer asking-rent achievability than the comps imply.
- What's the recent tenant-quality profile in this submarket — average credit score on applications, eviction rate, late-payment / NSF rate, and stable-employment percentage? A property-management company in the area should have these aggregated.
- How much new for-sale + rental construction is in the pipeline within 1–3 miles? Heavy new supply typically softens prices + rents 12–24 months out; constrained supply supports both.
Investment metrics
- 1% rule
- 1.08% ✓
- Cap rate
- 7.76%
- Cash-on-cash
- 5.25%
- DSCR
- 1.23
- GRM
- 7.7
CMA / ARV
- ARV (median comp)
- $222,819
- List price
- $165,000
- Delta
- -25.95%
- Verdict
- UNDERPRICED
- Comps
- 20 within 1.0 mi
Show comp detail 12 sales within ~0.75 mi
| Address | Dist | Beds/Ba | Sqft | Sold | Price | $/sf | Match |
|---|---|---|---|---|---|---|---|
| 708 W Avenue A | 0.18mi | 3/2.0 | 1,512 (+1%) | 1mo | $185,000 | $122 | 88 |
| 1105 W 1st St | 0.40mi | 3/2.0 | 1,520 (+1%) | 1mo | $339,000 | $223 | 76 |
| 802 W 1st St | 0.33mi | 3/2.0 | 1,588 (+6%) | 1mo | $255,000 | $161 | 72 |
| 1209 W Avenue A | 0.54mi | 3/2.0 | 1,569 (+5%) | 2mo | $125,000 | $80 | 64 |
| 1047 Fieldstone Dr | 0.57mi | 3/2.0 | 1,567 (+4%) | 1mo | $315,000 | $201 | 63 |
| 1172 Limestone Dr | 0.58mi | 3/2.0 | 1,620 (+8%) | 1mo | $330,000 | $204 | 57 |
| 1077 Fieldstone Dr | 0.63mi | 3/2.0 | 1,565 (+4%) | 8mo | $297,500 | $190 | 54 |
| 502 N Ridge St | 0.20mi | 2/1.5 (-1) | 1,359 (-9%) | 21mo | $264,000 | $194 | 52 |
| 1017 Fieldstone Dr | 0.54mi | 3/2.0 | 1,695 (+13%) | 14mo | $359,340 | $212 | 39 |
| 1405 W North Ave | 0.73mi | 3/2.0 | 1,680 (+12%) | 10mo | $300,000 | $179 | 36 |
| 506 S Arnold St | 0.56mi | 2/2.0 (-1) | 1,328 (-12%) | 16mo | $215,000 | $162 | 34 |
| 1315 W Avenue B | 0.65mi | 4/2.0 (+1) | 1,286 (-14%) | 7mo | $210,000 | $163 | 33 |
Match score weights: distance 35% · size 25% · config 20% · recency 20%. Top-matched comps best support the ARV.
Projected returns pro-forma
-3.0% appreciation · 3.0% rent growth · sell at horizon
- IRR
- -8.1%
- Equity multiple
- 0.70×
- Total profit
- $-13,803
- Equity at exit
- $24,602
- IRR
- 1.5%
- Equity multiple
- 1.10×
- Total profit
- $4,833
- Equity at exit
- $14,266
Cash invested: $46,200 (down + closing). Projections, not guarantees.
Landlord ↔ Tenant lean methodology
- Overall (STATE)
- 87 Strongly Landlord-Friendly
- State Texas
- 87 Strongly Landlord-Friendly · R+5
- County
- — inherits STATE
- City
- — inherits STATE
ZIP-level market 76550
- Home prices YoY
- -22.3%
- Active inventory
- 342
- Price-to-rent
- 7.7×
Monthly cashflow live
- Estimated rent
- $1,790 medium interval (Pro) →
- Mortgage (P&I)
- −$865
- Tax from tax record
- −$278 /mo · $3,333/yr
- Insurance
- −$69
- HOA
- −$0
- Vacancy / Maint / Mgmt
- −$376
- Net cashflow
- $202
Break-even live
UW: 25.0% down · 7.5% · 30yr · 1.5% tax · 5.0% vac · 8.0% maint · 8.0% mgmt
Financing live
Cash to close
- Down payment
- $41,250
- Closing costs
- $4,950
- Reserves months
- —
- Total cash needed
- —
Loan-product check · same deal, 3 products live
Conventional
25% down · 7.5% · 30yr
- Down + closing
- —
- Monthly P&I
- —
- Monthly cashflow
- —
- DSCR
- —
- Eligible?
- —
Personal DTI + credit; lowest rate.
DSCR
20% down · 8.5% · 30yr
- Down + closing
- —
- Monthly P&I
- —
- Monthly cashflow
- —
- DSCR
- —
- Eligible?
- —
No personal income docs; deal must DSCR.
Hard money
10% down · 12.0% · 12mo
- Down + closing
- —
- Monthly P&I
- —
- Monthly cashflow
- —
- DSCR
- —
- Eligible?
- —
Short-term bridge; refi at stabilization.
Rent comps 3 comps
| Address | Beds | Baths | Sqft | Rent | $/sqft | DOM | Units | Dist |
|---|---|---|---|---|---|---|---|---|
| 207 N Ridge St Unit B Lampasas, TX | 3.0 | 2.0 | 1267 | $1,875 | $1.48 | 4d | 1 | 0.30mi |
| 106 N Fairview St Lampasas, TX | 3.0 | 1.5 | 1392 | $1,700 | $1.22 | 13d | 1 | 0.50mi |
| 1109 East Avenue F Unit F Lampasas, TX | 3.0 | 2.0 | 1356 | $1,700 | $1.25 | 43d | 1 | 1.14mi |
Listing history 22 events
-
2026-06-18days on market $165,000 Active 59 DOM
-
2026-06-17days on market $165,000 Active 58 DOM
-
2026-06-16days on market $165,000 Active 57 DOM
-
2026-06-15status $165,000 Active 56 DOM
-
2026-06-15days on market $165,000 Active Under Contract 56 DOM
-
2026-06-14days on market $165,000 Active Under Contract 54 DOM
-
2026-06-13days on market $165,000 Active Under Contract 53 DOM
-
2026-06-10days on market $165,000 Active Under Contract 51 DOM
-
2026-06-09days on market $165,000 Active Under Contract 50 DOM
-
2026-06-08days on market $165,000 Active Under Contract 49 DOM
-
2026-06-07statusdays on market $165,000 Active Under Contract 48 DOM
-
2026-06-03days on market $165,000 Active 44 DOM
-
2026-06-02days on market $165,000 Active 43 DOM
-
2026-06-01days on market $165,000 Active 42 DOM
-
2026-05-31days on market $165,000 Active 41 DOM
-
2026-05-30days on market $165,000 Active 40 DOM
-
2026-04-20$165,000 Active 419-char remark
Show marketing remark (419 chars)
3-bedroom, 1.5-bath home on a spacious lot in Lampasas offering a great opportunity for buyers looking to make a home their own. Functional layout with comfortable living space and a large yard with mature trees. Property includes a 1-car carport and plenty of outdoor space for additional use or future improvements. Convenient location with easy access to town amenities. Ideal for buyers seeking value and potential.
-
2026-04-19$165,000 Active
-
2025-08-01status Active
-
2025-07-17historical Active Under Contract
-
2025-06-13price
-
2025-05-29Active
ⓘ Source: listings_history table (triggers on properties + properties_extension) + one-shot
backfill from property_details.listing_events for pre-trigger history.
Tax reassessment forecast TX · Resets to sale price
- Current annual tax
- $3,333 · $278/mo
- Projected year-2 tax
- $3,333 · $278/mo
- Expected delta
- $0/yr ($0/mo · 0.0%)
ⓘ Screening estimate from a state-policy table — verify with the county assessor before closing.
Climate risk First Street
- Flood 1/10 Low FEMA zone X · 0% chance over 30 yrs
- Wildfire 5/10 Major
- Heat 7/10 Severe 7 d/yr ≥106°F today · 22 d/yr by 30 yrs out
- Wind 6/10 Major 48% chance of damaging wind over 30 yrs
- Air quality 1/10 Low 0 unhealthy d/yr today · 0 by 30 yrs out
Nearby sold comps map
Loading sold comps map…
Walkable amenities ~0.75 mi
Loading nearby amenities…
Taxation est. · year 1
- Rental income
- $21,474
- − Mortgage interest
- −$9,243
- − Property taxes
- −$3,333
- − Insurance
- −$825
- − Repairs & maintenance
- −$1,718
- − Management
- −$1,718
- − Depreciation
- −$4,800
- Taxable loss
- −$162
- Est. tax savings @ 24.0%
- +$39
- After-tax cash flow
- $2,462/yr
For passive investors: Depreciation is non-cash, so a rental often shows a tax loss while cash-flowing — sheltering income. Rental losses are passive: they offset passive income freely, and up to $25,000/yr can offset ordinary (W-2) income if you actively participate and your MAGI is under $100k (phasing out to $0 by $150k); unused losses carry forward. On sale, claimed depreciation is recaptured at up to 25%, and gains may owe capital-gains tax (a 1031 exchange can defer both). Figures are a year-1 estimate at your 24.0% rate — not tax advice; consult a CPA.
Condition & rehab AI · 12 photos
This home requires significant repairs and updates to improve its condition and value. The exterior, interior, and HVAC systems are in poor condition, and the landscaping is sparse. With proper repairs and updates, the property has the potential to become a move-in-ready home with increased value.
Repairs flagged
- Major Exterior siding — Significant damage and wear.
- Major Roof — Visible signs of damage.
- Major Flooring — Old and in need of replacement.
- Major Interior walls/paint — Significant wear and tear.
- Major HVAC unit — Appears old and may need replacement.
- Major Landscaping — Sparse and in need of maintenance.
Value-add opportunities
- Both Paint interior walls and ceilings — Fresh paint enhances curb appeal and interior aesthetics.
- Both Replace flooring in kitchen and bathrooms — New flooring improves functionality and aesthetics.
- Both Replace HVAC unit — A new HVAC system improves comfort and energy efficiency.
- Both Landscaping maintenance — Well-maintained landscaping enhances curb appeal and property value.
Renovation cost estimate screening
| Repair item | Severity | Est. cost |
|---|---|---|
| Exterior siding · Significant damage and wear. | Major | $15,000–50,000 |
| Roof · Visible signs of damage. | Major | $15,000–50,000 |
| Flooring · Old and in need of replacement. | Major | $15,000–50,000 |
| Interior walls/paint · Significant wear and tear. | Major | $15,000–50,000 |
| HVAC unit · Appears old and may need replacement. | Major | $15,000–50,000 |
| Landscaping · Sparse and in need of maintenance. | Major | $15,000–50,000 |
| Total estimated repair cost · 6 items | $90,000–300,000 |
Value-add ROI direction
- Both Paint interior walls and ceilings — Fresh paint enhances curb appeal and interior aesthetics. ↑
- Both Replace flooring in kitchen and bathrooms — New flooring improves functionality and aesthetics. ↑
- Both Replace HVAC unit — A new HVAC system improves comfort and energy efficiency. ↑
- Both Landscaping maintenance — Well-maintained landscaping enhances curb appeal and property value. ↑
ⓘ Cost ranges are severity-bucket heuristics (US national rule-of-thumb). Get contractor quotes + a written scope before underwriting a rehab budget.
Schools (NCES district)
- District
- Lampasas ISD
- NCES district ID
- 4826640
- Math proficiency
- 42% ▼ -3.00%
- Reading proficiency
- 46% ▬ 0.00%
- Median HH income
- $51,042
- Composite
- 37.9/100
- National rank
- #4314
- State rank
- #278 of 826 in TX
Livability — Lampasas
- Score
- 75/100
- State rank
- #123
- US rank
- #3832
Category grades
Schools grade is shown separately in the Schools card above.
Census & demographics
- Census place
- Lampasas, TX
- Population (ZIP)
- 13,699
Population outlook (Lampasas County) Hauer SSP2
- Today (2025)
- 22,114 people
- By 2030
- 22,779 · +3.0%
- By 2040
- 23,812 · +7.7%
- By 2050
- 24,403 · +10.4%
- By 2075
- 25,713 · +16.3%
- By 2100
- 25,053 · +13.3%
Race, ethnicity, and origin ACS 2023
- Neighborhood character
- Predominantly White (72%)
- Race & ethnicity
- White 72% Hispanic / Latino 21% Two or more races 13%
- Hispanic origin (detail)
- Mexican 16% Puerto Rican 2%
- Common ancestry
- Lithuanian 3% Slovak 3% Romanian 2%
- Foreign-born
- 4% · Canada
- Languages at home
- 87% English-only · Spanish 11% German/W. Germanic 1%
Political lean MEDSL · Lampasas
- 2024 margin
- Solid R (+59.6) · D 19.8% · R 79.3%
- 2008→2024 swing
- -10.5pp toward R · 2008: -49.1pp · 2024: -59.6pp
- All cycles
- 2024: R+59.6 2020: R+57.1 2016: R+60.0 2012: R+57.8 2008: R+49.1
Not yet ingested
- Civics
- —
Market trends
- HPI YoY
- ▼ -71.55%
- Current HPI
- 249.3057
- Rent YoY
- —
- Metro
- —
- State GDP YoY
- ▲ 3.95%
- F500 in state
- 110
Industry mix (Fortune 500 HQ in TX)
| Industry | F500 HQs | Revenue |
|---|---|---|
| Energy | 16 | $1,198B |
|
||
| Technology | 5 | $198B |
|
||
| Engineering / Construction | 4 | $72B |
|
||
| Energy Services | 3 | $60B |
|
||
| Utilities | 3 | $41B |
|
||
| Healthcare | 2 | $330B |
|
||
Price history
+0.0% since first listed6 events — show timeline
- 2026-04-20 Listed $165,000 HLMLS as distributed by MLS GRID
- 2026-04-19 Listed $165,000 CTXMLS
- 2025-08-01 Relisted — Unlock MLS
- 2025-07-17 Contingent — Unlock MLS
- 2025-06-13 Price Changed — Unlock MLS
- 2025-05-29 Listed — Unlock MLS
Cash-flow waterfall
monthlySold comps — $/sqft
last 12 mo · ≤1 miLoading sold comps…