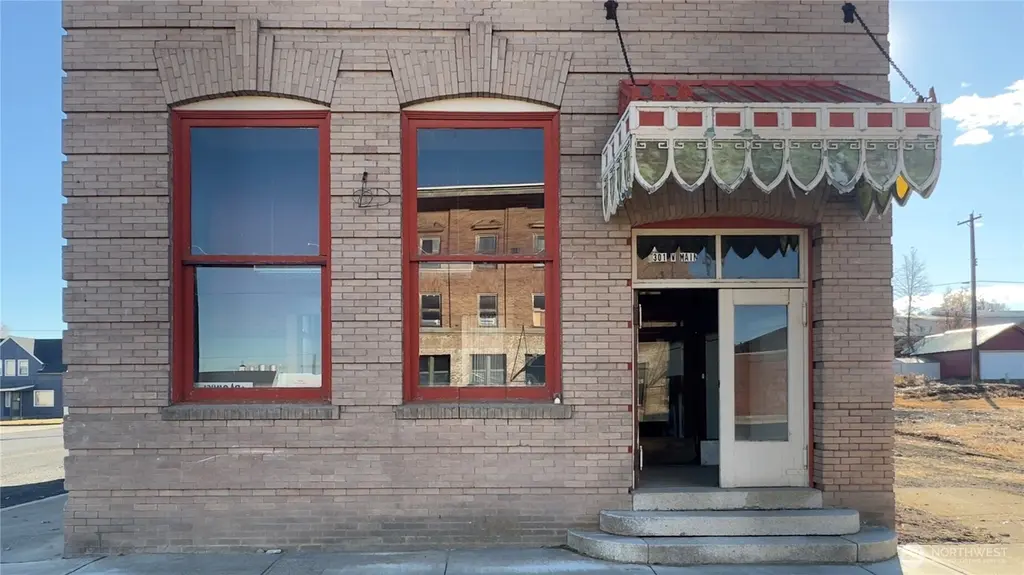
301 W Main St · Almira, WA
Flood risk No data
- FEMA flood zone
- —
- Chance of flooding over 30 yrs
- —
- Est. flood insurance / yr
- —
Fire risk No data
- Est. fire insurance / yr
- —
Heat risk No data
- Hot days now (above threshold)
- —
- Hot days in 30 yrs
- —
Wind risk No data
- Chance of severe wind over 30 yrs
- —
Air-quality risk No data
- Unhealthy air days now
- —
- Unhealthy air days in 30 yrs
- —
Risk factors via First Street. Map © Google.
Why this score? — see what drove the C- grade
The composite is a weighted blend of 9 inputs, each scored 0–100. Each bar is that input's sub-score; the figure is the points it added to the 100-point composite (weight × sub-score).
- Cash flow +16.4/30.0
- ARV discount +7.5/15.0
- Schools +5.8/10.0
- DSCR +5.1/10.0
- Appreciation +5.0/10.0
- 1% rule +4.5/10.0
- Livability +3.3/5.0
- Rent growth +2.5/5.0
- Condition / age +1.0/5.0
$109,000
🖨 Deal sheet 📄 Offer letter ✓ Due diligence
Listing remarks
Historic 2-Story Building! This early 1900s brick building, formerly the town preschool- later a bank, is now available for mixed use! Full of unique charm & historic character, this property offers a rare opportunity to own a true piece of Almira’s past! Featuring two stories & spacious basement, the building provides a solid foundation for those with vision & creativity. Whether you're passionate about restoration or looking to create a one-of-a-kind living space, this structure is ready for a fresh transformation. Imagine the possibilities! Don’t miss this opportunity!
Key facts
- Historic character
- Spacious basement
- 2,929 sq ft lot
Tags
Neighborhood map
What this means for you Summary
Snapshot
- This is a 1-bed/1.5-bath single-family listed at $109k. Condition is rated poor.
Deal economics
- At list price, monthly cash flow is $62 ($745/yr) — positive.
- The deal already cash-flows at list — no discount required.
- To meet the 1% rule (rent ≥ 1% of price), the offer needs to be $103k (5.3% below list).
- Recommended offer: $96k (12.0% below list) — sets the bar for market timing.
Location & tenants
- Location reads 66/100 on livability (#323 in WA) — a middle-class / working-renter tenant base. Strengths: cost of living A+, housing A+, schools B; Watch: health & safety C-, crime F, amenities F.
- Almira School District (rural): math 65% / reading 70% proficiency, ranked #29 of 291 in WA (top 10%) — acceptable for families but not a draw, mixed tenant base, ~2y average lease.
- Market conditions: 8 active listings in the ZIP; 49 units permitted in Lincoln County in 2024 (0 in 5+ unit buildings).
Forward outlook
- In year one you build about $4k of equity ($754 loan paydown + $3k appreciation (3.0% local appreciation)).
- Lincoln County population projected at -20% by 2050 — secular population decline; favor cash flow + early exit over multi-decade hold.
- At projected returns (3.0% appreciation + 3.0% rent growth), your $31k cash investment doubles in ~6 years — after that, you're playing with house money.
- By year 9, paydown + projected appreciation supports a ~$34k cash-out refi (75% LTV) — recoverable capital for the next deal without selling this one.
Negotiation context
- It's been on market 259 days — a 12% lower offer ($96k) is reasonable based on typical stale-listing flexibility.
Risks & watch-outs
- Watch-outs: built in 1900 — expect roof / HVAC / electrical / plumbing capex.
Questions for the listing agent
- It's been on market 259 days. Have you received any prior offers? Is the seller open to a 12% concession, seller financing, or rate buy-down credit?
- Have any recent inspections been done? Can we get a copy of the seller's disclosures and any deferred-maintenance estimates?
- Built in 1900 — when were the roof, HVAC, electrical panel, plumbing, and water heater last replaced?
- Why hasn't it sold? Are there any deal-killer items the seller is aware of (foundation, flood, title, zoning, code violations)?
- Is there a deadline driving the sale (1031 exchange, divorce, estate, relocation)? That informs how much negotiation room exists.
- Schools are B-rated — typically a magnet for longer-tenancy family renters. What's the average tenant stay here, and is there a school-zone premium baked into asking?
- Crime grade is F in this area — have there been break-ins, vandalism, or insurance claims at this property in the last 3 years? What carrier currently insures it and at what premium?
- What's the average days-on-market for RENTAL listings here right now (not sales)? A rising rental-DOM trend means longer vacancies and softer asking-rent achievability than the comps imply.
- What's the recent tenant-quality profile in this submarket — average credit score on applications, eviction rate, late-payment / NSF rate, and stable-employment percentage? A property-management company in the area should have these aggregated.
- How much new for-sale + rental construction is in the pipeline within 1–3 miles? Heavy new supply typically softens prices + rents 12–24 months out; constrained supply supports both.
Investment metrics
- 1% rule
- 0.95% ✗
- Cap rate
- 6.98%
- Cash-on-cash
- 2.44%
- DSCR
- 1.11
- GRM
- 8.8
CMA / ARV
No comps found within radius.
Projected returns pro-forma
3.0% appreciation · 3.0% rent growth · sell at horizon
- IRR
- 9.8%
- Equity multiple
- 1.56×
- Total profit
- $17,101
- Equity at exit
- $49,011
- IRR
- 12.2%
- Equity multiple
- 2.81×
- Total profit
- $55,375
- Equity at exit
- $75,532
Cash invested: $30,520 (down + closing). Projections, not guarantees.
Landlord ↔ Tenant lean methodology
- Overall (STATE)
- 28 Tenant-Leaning
- State Washington
- 28 Tenant-Leaning · D+8
- County
- — inherits STATE
- City
- — inherits STATE
ZIP-level market 99103
- Active inventory
- 8
- Price-to-rent
- 8.8×
Monthly cashflow live
- Estimated rent
- $1,032 medium interval (Pro) →
- Mortgage (P&I)
- −$572
- Tax est. 1.5%
- −$136 /mo · $1,635/yr
- Insurance
- −$45
- HOA
- −$0
- Vacancy / Maint / Mgmt
- −$217
- Net cashflow
- $62
Break-even live
UW: 25.0% down · 7.5% · 30yr · 1.5% tax · 5.0% vac · 8.0% maint · 8.0% mgmt
Financing live
Cash to close
- Down payment
- $27,250
- Closing costs
- $3,270
- Reserves months
- —
- Total cash needed
- —
Loan-product check · same deal, 3 products live
Conventional
25% down · 7.5% · 30yr
- Down + closing
- —
- Monthly P&I
- —
- Monthly cashflow
- —
- DSCR
- —
- Eligible?
- —
Personal DTI + credit; lowest rate.
DSCR
20% down · 8.5% · 30yr
- Down + closing
- —
- Monthly P&I
- —
- Monthly cashflow
- —
- DSCR
- —
- Eligible?
- —
No personal income docs; deal must DSCR.
Hard money
10% down · 12.0% · 12mo
- Down + closing
- —
- Monthly P&I
- —
- Monthly cashflow
- —
- DSCR
- —
- Eligible?
- —
Short-term bridge; refi at stabilization.
Listing history 16 events
-
2026-06-18days on market $109,000 Active 259 DOM
-
2026-06-17days on market $109,000 Active 258 DOM
-
2026-06-16days on market $109,000 Active 257 DOM
-
2026-06-15days on market $109,000 Active 256 DOM
-
2026-06-15days on market $109,000 Active 255 DOM
-
2026-06-13days on market $109,000 Active 254 DOM
-
2026-06-12days on market $109,000 Active 253 DOM
-
2026-06-09days on market $109,000 Active 250 DOM
-
2026-06-08days on market $109,000 Active 249 DOM
-
2026-06-08days on market $109,000 Active 248 DOM
-
2026-06-05days on market $109,000 Active 246 DOM
-
2026-06-03days on market $109,000 Active 244 DOM
-
2026-06-02days on market $109,000 Active 243 DOM
-
2026-06-01days on market $109,000 Active 242 DOM
-
2026-05-31days on market $109,000 Active 241 DOM
-
2025-10-02$109,000 Active
ⓘ Source: listings_history table (triggers on properties + properties_extension) + one-shot
backfill from property_details.listing_events for pre-trigger history.
Nearby sold comps map
Loading sold comps map…
Walkable amenities ~0.75 mi
Loading nearby amenities…
Taxation est. · year 1
- Rental income
- $12,385
- − Mortgage interest
- −$6,106
- − Property taxes
- −$1,635
- − Insurance
- −$545
- − Repairs & maintenance
- −$991
- − Management
- −$991
- − Depreciation
- −$3,171
- Taxable loss
- −$1,053
- Est. tax savings @ 24.0%
- +$253
- After-tax cash flow
- $998/yr
For passive investors: Depreciation is non-cash, so a rental often shows a tax loss while cash-flowing — sheltering income. Rental losses are passive: they offset passive income freely, and up to $25,000/yr can offset ordinary (W-2) income if you actively participate and your MAGI is under $100k (phasing out to $0 by $150k); unused losses carry forward. On sale, claimed depreciation is recaptured at up to 25%, and gains may owe capital-gains tax (a 1031 exchange can defer both). Figures are a year-1 estimate at your 24.0% rate — not tax advice; consult a CPA.
Condition & rehab AI · 13 photos
This historic 2-story building requires extensive renovations, including kitchen and bathroom updates, exterior paint, and window repair. The property has significant potential for increased value with these improvements.
Repairs flagged
- Major Kitchen cabinets — Severe peeling paint and damage to the cabinets.
- Major Kitchen appliances — Severe wear and tear, with visible damage.
- Major Bathroom fixtures — Severe wear and tear, with visible damage.
- Major Bathroom flooring — Severe wear and tear, with visible damage.
- Major Exterior paint — Severe peeling and damage to the exterior paint.
- Major Windows — Severe wear and tear, with visible damage.
Value-add opportunities
- Resale Kitchen renovation — A modern kitchen will attract more buyers and increase the property's value.
- Resale Bathroom renovation — A modern bathroom will attract more buyers and increase the property's value.
- Both Exterior paint and landscaping — A fresh coat of paint and landscaping will improve the curb appeal and attract more renters.
Renovation cost estimate screening
| Repair item | Severity | Est. cost |
|---|---|---|
| Kitchen cabinets · Severe peeling paint and damage to the cabinets. | Major | $15,000–50,000 |
| Kitchen appliances · Severe wear and tear, with visible damage. | Major | $15,000–50,000 |
| Bathroom fixtures · Severe wear and tear, with visible damage. | Major | $15,000–50,000 |
| Bathroom flooring · Severe wear and tear, with visible damage. | Major | $15,000–50,000 |
| Exterior paint · Severe peeling and damage to the exterior paint. | Major | $15,000–50,000 |
| Windows · Severe wear and tear, with visible damage. | Major | $15,000–50,000 |
| Total estimated repair cost · 6 items | $90,000–300,000 |
Value-add ROI direction
- Resale Kitchen renovation — A modern kitchen will attract more buyers and increase the property's value. ↑
- Resale Bathroom renovation — A modern bathroom will attract more buyers and increase the property's value. ↑
- Both Exterior paint and landscaping — A fresh coat of paint and landscaping will improve the curb appeal and attract more renters. ↑
ⓘ Cost ranges are severity-bucket heuristics (US national rule-of-thumb). Get contractor quotes + a written scope before underwriting a rehab budget.
Schools (NCES district)
- District
- Almira School District
- NCES district ID
- 5300090
- Math proficiency
- 65% ▬ 0.00%
- Reading proficiency
- 70% ▼ -5.00%
- Median HH income
- $47,183
- Composite
- 58.32/100
- National rank
- #2091
- State rank
- #29 of 291 in WA
Livability — Almira
- Score
- 66/100
- State rank
- #323
- US rank
- #11961
Category grades
Schools grade is shown separately in the Schools card above.
Census & demographics
- Census place
- Almira, WA
- Population (ZIP)
- 534
Population outlook (Lincoln County) Hauer SSP2
- Today (2025)
- 9,599 people
- By 2030
- 9,146 · -4.7%
- By 2040
- 8,298 · -13.6%
- By 2050
- 7,683 · -20.0%
- By 2075
- 6,790 · -29.3%
- By 2100
- 6,029 · -37.2%
Race, ethnicity, and origin ACS 2023
- Neighborhood character
- Predominantly White (93%)
- Race & ethnicity
- White 93% Hispanic / Latino 7% Two or more races 3%
- Hispanic origin (detail)
- Mexican 4%
- Common ancestry
- Lithuanian 4% Scottish 2% Portuguese 2%
- Foreign-born
- 2% · China
- Languages at home
- 95% English-only · Spanish 4% German/W. Germanic 1%
Political lean MEDSL · Lincoln
- 2024 margin
- Solid R (+50.6) · D 23.6% · R 74.2% · Other 2.2%
- 2008→2024 swing
- -20.9pp toward R · 2008: -29.6pp · 2024: -50.6pp
- All cycles
- 2024: R+50.6 2020: R+48.9 2016: R+50.2 2012: R+40.9 2008: R+29.6
Not yet ingested
- Civics
- —
Market trends
- HPI YoY
- —
- Current HPI
- —
- Rent YoY
- —
- Metro
- —
- State GDP YoY
- ▲ 4.65%
- F500 in state
- 22
Industry mix (Fortune 500 HQ in WA)
| Industry | F500 HQs | Revenue |
|---|---|---|
| Retail | 2 | $269B |
|
||
| Technology / Retail | 1 | $638B |
|
||
| Technology | 1 | $245B |
|
||
| Telecommunications | 1 | $38B |
|
||
| Food / Beverage | 1 | $36B |
|
||
| Automotive / Trucks | 1 | $34B |
|
||
Price history
1 event — show timeline
- 2025-10-02 Listed $109,000 NWMLS as Distributed by MLS Grid
Cash-flow waterfall
monthlySold comps — $/sqft
last 12 mo · ≤1 miLoading sold comps…