 Multi-family
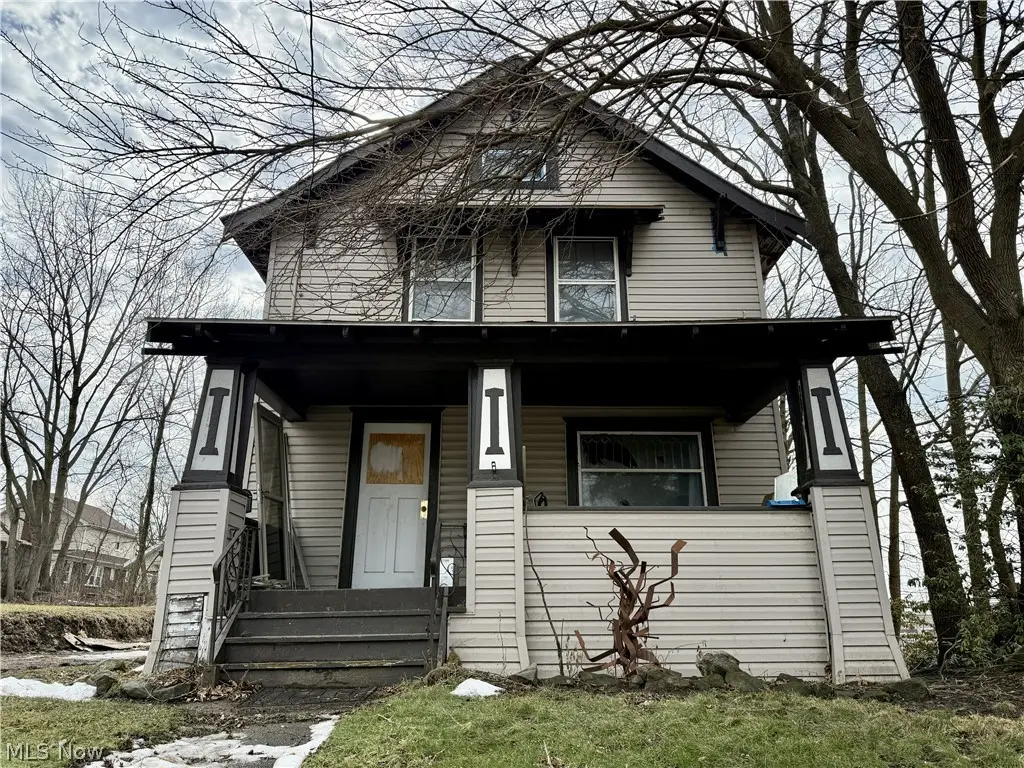
22 Brighton Dr · Akron, OH
Flood risk 1/10 · Minimal
- FEMA flood zone
- X (unshaded)
- Chance of flooding over 30 yrs
- 0.0%
- Est. flood insurance / yr
- $473 – $860
Fire risk 1/10 · Minimal
- Est. fire insurance / yr
- $713 – $1,323
Heat risk 3/10 · Minor
- Hot days now (above 96°F)
- 7 days/yr
- Hot days in 30 yrs
- 17 days/yr
Wind risk 1/10 · Minimal
- Chance of severe wind over 30 yrs
- —
Air-quality risk 2/10 · Minimal
- Unhealthy air days now
- 1 days/yr
- Unhealthy air days in 30 yrs
- 2 days/yr
Risk factors via First Street. Map © Google.
Why this score? — see what drove the B+ grade
The composite is a weighted blend of 9 inputs, each scored 0–100. Each bar is that input's sub-score; the figure is the points it added to the 100-point composite (weight × sub-score).
- Cash flow +30.0/30.0
- ARV discount +15.0/15.0
- 1% rule +10.0/10.0
- DSCR +10.0/10.0
- Livability +4.0/5.0
- Rent growth +3.7/5.0
- Condition / age +2.5/5.0
- Schools +2.1/10.0
- Appreciation +0.0/10.0
$55,000
🖨 Deal sheet (PDF) 📄 Offer letter ✓ Due diligence
Multi-family units
County records classify this as Multi-Family (2-4 Unit). Listing-text estimate: 1 unit. estimate disagrees with records
Listing remarks MLS
Investment opportunity in Akron! Beautiful woodwork in living room, first floor bathroom, walk up attic. No water or electric on at the property so only day time showings will be approved.
Key facts
- Walk up attic
- First floor bathroom
- 4,512 sq ft lot
Tags
Neighborhood map
What this means for you Summary
Snapshot
- This is a 2-bed/2.0-bath multifamily listed at $55k.
Deal economics
- At list price, monthly cash flow is $1k ($13k/yr) — positive.
- The deal already cash-flows at list — no discount required.
- Meets the 1% rule at list price ($2k rent vs $55k).
- Recommended offer: $50k (9.0% below list) — sets the bar for market timing.
- Cap rate 30.7% vs local median 6.6% in Akron — top-decile yield for the area; either an underpriced asset or a hidden risk that comps aren't pricing in. Stress-test before assuming the spread holds.
Location & tenants
- Location reads 81/100 on livability (#104 in OH, #1,591 nationally) — a professional / high-income tenant draw. Strengths: amenities A+, commute A+, cost of living A+; Watch: crime F, employment F.
- Akron City (urban): math 22% / reading 30% proficiency, ranked #602 of 656 in OH (top 92%) — low school quality limits family demand, transient renter base, plan for 1-2y turnover; 66% free/reduced lunch — lower-income household profile, screen leases tightly.
- Zoned schools: Firestone Park Elementary School (math 12% / reading 22%, grade F, #1,337 of 1,584 statewide, top 86%, 315 students, 0% FRL); National Inventors Hall of Fame School Center For Stem (math 45% / reading 56%, grade C, #413 of 654 statewide, top 63%, 406 students, 0% FRL); Garfield Community Learning Center (math 8% / reading 27%, grade F, #689 of 781 statewide, top 90%, 971 students, 0% FRL) — zoned schools average 0% FRL vs 66% district-wide (66 pts lower); this property's tenant base skews higher-income than the district average.
- Market conditions: Rents rising fast (+4.6%/yr); 85 active listings in the ZIP; 23 comparable units currently listed for rent nearby; rentals at typical pace (median 25d on market — plan ~3-4 weeks tenant-placement turnaround); 43% of comp listings sitting > 30 days — soft ceiling on asking rent; 1,114 units permitted in Summit County in 2024 (397 in 5+ unit buildings).
- This rent runs 44% of the median local income ($51k/yr) — at the standard rent-burdened threshold; future hikes will face affordability resistance.
Forward outlook
- Local home prices are declining (-3.0%/yr); year-one equity from $380 of loan paydown is wiped out by about $2k of value loss. Plan a longer hold.
- Summit County population projected to shrink 6% by 2050 — rents likely to lag national; underwrite the cash flow, not the appreciation.
- At projected returns (-3.0% appreciation + 4.6% rent growth), your $15k cash investment doubles in ~2 years — after that, you're playing with house money.
Negotiation context
- It's been on market 120 days — a 9% lower offer ($50k) is reasonable based on typical stale-listing flexibility.
- 6 sale attempts since 20y ago with the ask held roughly flat each time — persistent listings suggest the price (not the market) is what's stuck; bring a comps-based counter.
- Current owner paid $7k; list at $55k implies a 686% gain — meaningful room to come down on a strong offer.
Risks & watch-outs
- Watch-outs: built in 1914 — expect roof / HVAC / electrical / plumbing capex.
Questions for the listing agent
- It's been on market 120 days. Have you received any prior offers? Is the seller open to a 9% concession, seller financing, or rate buy-down credit?
- Built in 1914 — when were the roof, HVAC, electrical panel, plumbing, and water heater last replaced?
- Why hasn't it sold? Are there any deal-killer items the seller is aware of (foundation, flood, title, zoning, code violations)?
- Is there a deadline driving the sale (1031 exchange, divorce, estate, relocation)? That informs how much negotiation room exists.
- Crime grade is F in this area — have there been break-ins, vandalism, or insurance claims at this property in the last 3 years? What carrier currently insures it and at what premium?
- What's the average days-on-market for RENTAL listings here right now (not sales)? A rising rental-DOM trend means longer vacancies and softer asking-rent achievability than the comps imply.
- What's the recent tenant-quality profile in this submarket — average credit score on applications, eviction rate, late-payment / NSF rate, and stable-employment percentage? A property-management company in the area should have these aggregated.
- How much new apartment / multifamily construction is in the pipeline within 1–3 miles? Heavy new supply (>2% of stock underway) typically softens rents 12–24 months out; light construction supports rent growth.
Investment metrics
- 1% rule
- 3.45% ✓
- Cap rate
- 30.70%
- Cash-on-cash
- 87.16%
- DSCR
- 4.88
- GRM
- 2.4
CMA / ARV
- ARV (median comp)
- $101,986
- List price
- $55,000
- Delta
- -46.07%
- Verdict
- UNDERPRICED
- Comps
- 20 within 1.0 mi
Show comp detail 1 sale within ~0.75 mi
| Address | Dist | Beds/Ba | Sqft | Sold | Price | $/sf | Match |
|---|---|---|---|---|---|---|---|
| 1419 S Main St | 0.09mi | 2/2.0 | 1,196 (-10%) | 5mo | $73,500 | $61 | 75 |
Match score weights: distance 35% · size 25% · config 20% · recency 20%. Top-matched comps best support the ARV.
Projected returns pro-forma
-3.0% appreciation · 4.62% rent growth · sell at horizon
- IRR
- 89.5%
- Equity multiple
- 5.25×
- Total profit
- $65,498
- Equity at exit
- $8,201
- IRR
- 92.9%
- Equity multiple
- 11.53×
- Total profit
- $162,211
- Equity at exit
- $4,755
Cash invested: $15,400 (down + closing). Projections, not guarantees.
Landlord ↔ Tenant lean methodology
- Overall (STATE)
- 73 Landlord-Friendly
- State Ohio
- 73 Landlord-Friendly · R+6
- County
- — inherits STATE
- City
- — inherits STATE
ZIP-level market 44301
- Home prices YoY
- -25.7%
- Rents YoY
- 4.6%
- Active inventory
- 85
- Price-to-rent
- 4.8×
Monthly cashflow live
- Estimated rent
- $1,897 high interval (Pro) →
- Mortgage (P&I)
- −$288
- Tax est. 1.5%
- −$69 /mo · $825/yr
- Insurance
- −$23
- HOA
- −$0
- Vacancy / Maint / Mgmt
- −$398
- Net cashflow
- $1,119
Break-even live
Sensitivity live
| Price | -10% $1,157 | -5% $1,138 | +0% $1,119 | +5% $1,100 | +10% $1,081 |
|---|---|---|---|---|---|
| Rent | -10% $969 | -5% $1,044 | +0% $1,119 | +5% $1,193 | +10% $1,268 |
| Rate | -1.0pp $1,146 | -0.5pp $1,133 | base $1,119 | +0.5pp $1,104 | +1.0pp $1,090 |
2-unit breakdown (identical units grouped — click to expand)
| Units | Beds | Baths | Est. rent |
|---|---|---|---|
| 2× units | 2 | 1 | $1,896 |
| #1 | 2 | 1 | $948 |
| #2 | 2 | 1 | $948 |
| Total (2 units) | $1,897 | ||
UW: 25.0% down · 7.5% · 30yr · 1.5% tax · 5.0% vac · 8.0% maint · 8.0% mgmt
Financing live
Cash to close
- Down payment
- $13,750
- Closing costs
- $1,650
- Reserves months
- —
- Total cash needed
- —
Loan-product check · same deal, 3 products live
Conventional
25% down · 7.5% · 30yr
- Down + closing
- —
- Monthly P&I
- —
- Monthly cashflow
- —
- DSCR
- —
- Eligible?
- —
Personal DTI + credit; lowest rate.
DSCR
20% down · 8.5% · 30yr
- Down + closing
- —
- Monthly P&I
- —
- Monthly cashflow
- —
- DSCR
- —
- Eligible?
- —
No personal income docs; deal must DSCR.
Hard money
10% down · 12.0% · 12mo
- Down + closing
- —
- Monthly P&I
- —
- Monthly cashflow
- —
- DSCR
- —
- Eligible?
- —
Short-term bridge; refi at stabilization.
Rent comps 23 comps
| Address | Beds | Baths | Sqft | Rent | $/sqft | DOM | Units | Dist |
|---|---|---|---|---|---|---|---|---|
| 67 E Archwood Ave Unit A Akron, OH | 2.0 | 1.0 | 1000 | $850 | $0.85 | 45d | 1 | 0.11mi |
| 94 Brighton Dr Akron, OH | 3.0 | 1.0 | 1000 | $1,100 | $1.10 | 45d | 1 | 0.15mi |
| 44 E Brookside Ave Akron, OH | 2.0 | 1.0 | 1762 | $900 | $0.51 | 15d | 1 | 0.23mi |
| 147 Brighton Dr Akron, OH | 3.0 | 1.0 | 1040 | $1,350 | $1.30 | 25d | 1 | 0.26mi |
| 1298 Bellows St Akron, OH | 3.0 | 1.0 | 1300 | $1,250 | $0.96 | 45d | 1 | 0.36mi |
| 36 W Wilbeth Rd Akron, OH | 3.0 | 1.0 | 1382 | $1,150 | $0.83 | 15d | 1 | 0.50mi |
| 1200 Girard St Akron, OH | 3.0 | 2.0 | 1438 | $1,100 | $0.76 | 15d | 1 | 0.54mi |
| 1127 Victory St Unit 1129 Akron, OH | 3.0 | 1.0 | 1368 | $950 | $0.69 | 45d | 1 | 0.83mi |
| 1102 Neptune Ave Akron, OH | 3.0 | 1.0 | 1000 | $1,200 | $1.20 | 45d | 1 | 1.06mi |
| 907 Kling St Akron, OH | 3.0 | 1.0 | 1248 | $1,250 | $1.00 | 15d | 1 | 1.08mi |
| 1036 Neptune Ave Akron, OH | 3.0 | 1.0 | 1000 | $1,350 | $1.35 | 45d | 1 | 1.10mi |
| 979 Neptune Ave Akron, OH | 3.0 | 1.0 | 1248 | $1,250 | $1.00 | 25d | 1 | 1.16mi |
| 527 Brady Ave Akron, OH | 3.0 | 1.5 | 1416 | $1,395 | $0.99 | 45d | 1 | 1.16mi |
| 1313 Coventry St Akron, OH | 2.0 | 1.0 | 913 | $1,250 | $1.37 | 15d | 1 | 1.17mi |
| 629 Morgan Ave Akron, OH | 2.0 | 1.0 | 960 | $1,200 | $1.25 | 45d | 1 | 1.24mi |
| 374 E Voris St Akron, OH | 3.0 | 1.0 | 876 | $1,150 | $1.31 | 25d | 1 | 1.36mi |
| 721 Polk Ave Akron, OH | 3.0 | 1.5 | 1500 | $1,600 | $1.07 | 25d | 1 | 1.39mi |
| 1204 Inman St Akron, OH | 3.0 | 1.0 | 1080 | $1,200 | $1.11 | 25d | 1 | 1.40mi |
| 662 Sumner St Akron, OH | 2.0 | 1.0 | 915 | $999 | $1.09 | 45d | 1 | 1.41mi |
| 658 Sumner St Akron, OH | 2.0 | 1.0 | 915 | $999 | $1.09 | 45d | 1 | 1.41mi |
| 600 Sherman St Akron, OH | 4.0 | 1.0–2.0 | 824 | $1,200 | $1.46 | 15d | 14 | 1.46mi |
| 764 Lindsay Ave Akron, OH | 3.0 | 1.0 | 1000 | $1,295 | $1.29 | 15d | 1 | 1.48mi |
| 773 Montana Ave Akron, OH | 3.0 | 1.5 | 1128 | $1,195 | $1.06 | 25d | 1 | 1.49mi |
Listing history 32 events
-
2026-06-21days on market $55,000 Active 120 DOM
-
2026-06-18days on market $55,000 Active 117 DOM
-
2026-06-17days on market $55,000 Active 116 DOM
-
2026-06-16days on market $55,000 Active 115 DOM
-
2026-06-15days on market $55,000 Active 114 DOM
-
2026-06-14days on market $55,000 Active 112 DOM
-
2026-06-13days on market $55,000 Active 111 DOM
-
2026-06-10days on market $55,000 Active 109 DOM
-
2026-06-09days on market $55,000 Active 108 DOM
-
2026-06-08days on market $55,000 Active 107 DOM
-
2026-06-07days on market $55,000 Active 106 DOM
-
2026-06-05days on market $55,000 Active 103 DOM
-
2026-06-03days on market $55,000 Active 102 DOM
-
2026-06-02days on market $55,000 Active 101 DOM
-
2026-06-01days on market $55,000 Active 100 DOM
-
2026-05-31days on market $55,000 Active 99 DOM
-
2026-05-31days on market $55,000 Active 98 DOM
-
2026-03-19status Active 188-char remark
Show marketing remark (188 chars)
Investment opportunity in Akron! Beautiful woodwork in living room, first floor bathroom, walk up attic. No water or electric on at the property so only day time showings will be approved.
-
2026-03-16status Pending 188-char remark
Show marketing remark (188 chars)
Investment opportunity in Akron! Beautiful woodwork in living room, first floor bathroom, walk up attic. No water or electric on at the property so only day time showings will be approved.
-
2026-02-18$55,000 Active 188-char remark
Show marketing remark (188 chars)
Investment opportunity in Akron! Beautiful woodwork in living room, first floor bathroom, walk up attic. No water or electric on at the property so only day time showings will be approved.
-
2008-08-26soldstatus $7,000 169-char remark
Show marketing remark (169 chars)
Colonial. Alum. exterior. Det. garage. No previous rental history. Seperate entrance. Could easily be converted back to a single family home. Buyer to verify all herein.
-
2008-08-06historical 169-char remark
Show marketing remark (169 chars)
Colonial. Alum. exterior. Det. garage. No previous rental history. Seperate entrance. Could easily be converted back to a single family home. Buyer to verify all herein.
-
2008-07-06historical
-
2008-04-22$9,000 169-char remark
Show marketing remark (169 chars)
Colonial. Alum. exterior. Det. garage. No previous rental history. Seperate entrance. Could easily be converted back to a single family home. Buyer to verify all herein.
-
2008-02-07$20,000
-
2006-12-31historical
-
2006-09-10$50,000
-
2006-09-01historical
-
2006-03-06$65,000
-
2005-02-08soldstatus $86,000
-
1988-03-21soldstatus $35,500
-
1978-06-05soldstatus $17,500
ⓘ Source: listings_history table (triggers on properties + properties_extension) + one-shot
backfill from property_details.listing_events for pre-trigger history.
Climate risk First Street
- Flood 1/10 Low FEMA zone X (unshaded) · 0% chance over 30 yrs
- Wildfire 1/10 Low
- Heat 3/10 Moderate 7 d/yr ≥96°F today · 17 d/yr by 30 yrs out
- Wind 1/10 Low
- Air quality 2/10 Low 1 unhealthy d/yr today · 2 by 30 yrs out
Nearby sold comps map
Loading sold comps map…
Walkable amenities ~0.75 mi
Loading nearby amenities…
Taxation est. · year 1
- Rental income
- $22,764
- − Mortgage interest
- −$3,081
- − Property taxes
- −$825
- − Insurance
- −$275
- − Repairs & maintenance
- −$1,821
- − Management
- −$1,821
- − Depreciation
- −$1,600
- Taxable income
- $13,341
- Est. tax owed @ 24.0%
- −$3,202
- After-tax cash flow
- $10,221/yr
For passive investors: Depreciation is non-cash, so a rental often shows a tax loss while cash-flowing — sheltering income. Rental losses are passive: they offset passive income freely, and up to $25,000/yr can offset ordinary (W-2) income if you actively participate and your MAGI is under $100k (phasing out to $0 by $150k); unused losses carry forward. On sale, claimed depreciation is recaptured at up to 25%, and gains may owe capital-gains tax (a 1031 exchange can defer both). Figures are a year-1 estimate at your 24.0% rate — not tax advice; consult a CPA.
Schools (NCES district)
- District
- Akron City
- NCES district ID
- 3904348
- Math proficiency
- 22% ▼ -17.00%
- Reading proficiency
- 30% ▼ -12.00%
- Median HH income
- $33,811
- Composite
- 21.31/100
- National rank
- #8383
- State rank
- #602 of 656 in OH
Livability — Akron
- Score
- 81/100
- State rank
- #104
- US rank
- #1591
Category grades
Schools grade is shown separately in the Schools card above.
Census & demographics
- Census place
- Akron, OH
- County
- Summit County · 440,783 people
- City population
- 174,375
- Metro
- Akron, OH
- Population (ZIP)
- 13,668
- Household income
- $51,321
- Rent vs Own
- Severe rent burden
- 446.0
Population outlook (Summit County) Hauer SSP2
- Today (2025)
- 546,583 people
- By 2030
- 544,028 · -0.5%
- By 2040
- 531,363 · -2.8%
- By 2050
- 514,923 · -5.8%
- By 2075
- 481,765 · -11.9%
- By 2100
- 432,265 · -20.9%
Race, ethnicity, and origin ACS 2023
- Neighborhood character
- Diverse neighborhood (Simpson 0.63)
- Race & ethnicity
- White 52% Black 30% Two or more races 11% Hispanic / Latino 5% Asian 2%
- Hispanic origin (detail)
- Mexican 3%
- Common ancestry
- Romanian 4% Lithuanian 2% Serbian 1%
- Foreign-born
- 6% · Canada
- Languages at home
- 92% English-only · Spanish 4% Other Indo-European 1% Other Asian/Pacific 1%
Political lean MEDSL · Summit
- 2024 margin
- Lean D (+7.0) · D 53.0% · R 46.0%
- 2008→2024 swing
- -9.6pp toward R · 2008: 16.6pp · 2024: 7.0pp
- All cycles
- 2024: D+7.0 2020: D+9.6 2016: D+8.2 2012: D+14.8 2008: D+16.6
Not yet ingested
- Civics
- —
Market trends
- HPI YoY
- ▼ -74.09%
- Current HPI
- 213.697
- Rent YoY
- ▲ 4.62%
- Metro
- Akron, OH
- State GDP YoY
- ▲ 1.98%
- F500 in state
- 48
Industry mix (Fortune 500 HQ in OH)
| Industry | F500 HQs | Revenue |
|---|---|---|
| Insurance | 3 | $145B |
|
||
| Industrial Machinery | 3 | $49B |
|
||
| Financial Services | 3 | $24B |
|
||
| Consumer Goods | 2 | $93B |
|
||
| Aerospace / Defense | 2 | $47B |
|
||
| Utilities | 2 | $33B |
|
||
Price history
+214.3% since first listed15 events — show timeline
- 2026-03-19 Relisted — MLSNOW
- 2026-03-16 Pending — MLSNOW
- 2026-02-18 Listed $55,000 MLSNOW
- 2008-08-26 Sold (MLS) $7,000 MLSNOW
- 2008-08-06 Listing Removed — MLSNOW
- 2008-07-06 Listing Removed — MLSNOW
- 2008-04-22 Listed $9,000 MLSNOW
- 2008-02-07 Listed $20,000 MLSNOW
- 2006-12-31 Listing Removed — MLSNOW
- 2006-09-10 Listed $50,000 MLSNOW
- 2006-09-01 Listing Removed — MLSNOW
- 2006-03-06 Listed $65,000 MLSNOW
- 2005-02-08 Sold (Public Records) $86,000 Public Records
- 1988-03-21 Sold (Public Records) $35,500 Public Records
- 1978-06-05 Sold (Public Records) $17,500 Public Records
Property tax history
+8.2%/yrLatest (2025): $3,365 · -13.3% YoY. Source: county tax records.
Cash-flow waterfall
monthlySold comps — $/sqft
last 12 mo · ≤1 miLoading sold comps…