5 Conestoga Mnr · West Earl, PA
Flood risk No data
- FEMA flood zone
- —
- Chance of flooding over 30 yrs
- —
- Est. flood insurance / yr
- —
Fire risk No data
- Est. fire insurance / yr
- —
Heat risk No data
- Hot days now (above threshold)
- —
- Hot days in 30 yrs
- —
Wind risk No data
- Chance of severe wind over 30 yrs
- —
Air-quality risk No data
- Unhealthy air days now
- —
- Unhealthy air days in 30 yrs
- —
Risk factors via First Street. Map © Google.
Why this score? — see what drove the B- grade
The composite is a weighted blend of 9 inputs, each scored 0–100. Each bar is that input's sub-score; the figure is the points it added to the 100-point composite (weight × sub-score).
- Cash flow +30.0/30.0
- 1% rule +10.0/10.0
- DSCR +10.0/10.0
- ARV discount +7.5/15.0
- Schools +4.4/10.0
- Rent growth +2.5/5.0
- Livability +2.5/5.0
- Condition / age +2.5/5.0
- Appreciation +0.0/10.0
$104,900
🖨 Deal sheet 📄 Offer letter ✓ Due diligence
Listing remarks
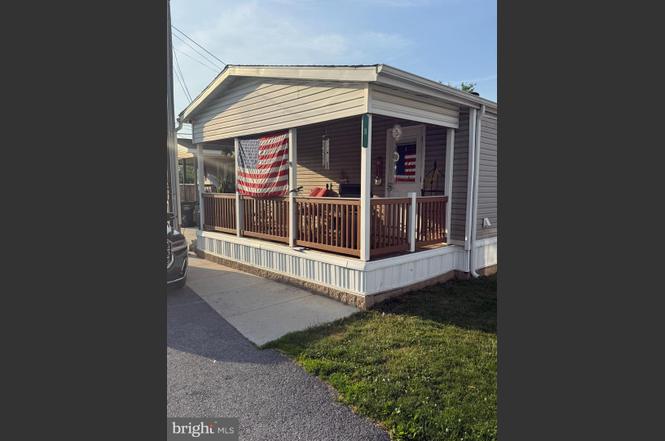
Don't miss this 3-bedroom, 2-full bath home offering over 1,100 square feet of comfortable living space in Conestoga Manor Mobile Home Park, located within the highly regarded Conestoga Valley School District. Inside, you'll find a spacious living and dining area, a primary suite with a private full bath, gas heat, gas cooking, newer central air conditioning, and updated windows that provide comfort and efficiency throughout the year. Step outside and enjoy the large front deck, perfect for relaxing with your morning coffee or unwinding at the end of the day. The backyard includes a storage shed and backs to picturesque farmland where horses can often be seen grazing, creating a peaceful co
Key facts
- Cocalico creek
- Open green spaces
- Storage shed
Tags
Property features AI
Finance
- Other: Property manager present
- Financial info: Ownership interest: ground rent; Annual ground rent expense listed
- HOA & community: Property located in Conestoga Manor Mobile Home Park; Ground rent exists ($450 monthly)
Exterior
- Parking: Two assigned off-site parking spaces
- Utilities: Public water; On-site septic; Electric service (200+ amp)
- Home design: Manufactured double-wide home; Built by Fleetwood; Entry level: main floor; Good condition; Not in a federal flood zone
- Construction: Frame construction with vinyl siding; Shingle roof; Other type foundation
- Exterior features: Deck(s); Shed; Above-grade and below-grade structures noted
Interior
- Kitchen: Built-in microwave; Dishwasher; Gas range/oven
- Bedrooms: Three main-level bedrooms
- Flooring: Carpet; Luxury vinyl tile
- Bathrooms: Two full bathrooms (both on main level)
- Heating & cooling: Forced air heating; Propane (leased) heating fuel; Central air conditioning; 200+ amp electric service; Electric hot water
- Interior features: Traditional floor plan; Combination dining and living area; Dining area; Entry-level bedroom; Tub with shower
- Laundry & utility: Main-floor laundry
Neighborhood map
What this means for you Summary
Snapshot
- This is a 3-bed/2.0-bath manufactured listed at $105k.
Deal economics
- At list price, monthly cash flow is $924 ($11k/yr) — positive.
- The deal already cash-flows at list — no discount required.
- Meets the 1% rule at list price ($2k rent vs $105k).
Location & tenants
- Location reads: area grade B — affects rentability + tenant quality, not the cash-flow math above.
- Conestoga Valley SD (suburban): math 43% / reading 59% proficiency, ranked #156 of 539 in PA (top 29%) — acceptable for families but not a draw, mixed tenant base, ~2y average lease.
- Zoned schools: Conestoga Valley Shs (math 75% / reading 24%, grade D+, #135 of 437 statewide, top 31%, 1,282 students, 41% FRL).
- Market conditions: 26 active listings in the ZIP; solid renter incomes; 1,093 units permitted in Lancaster County in 2024 (201 in 5+ unit buildings).
Forward outlook
- Local home prices are declining (-3.0%/yr); year-one equity from $725 of loan paydown is wiped out by about $3k of value loss. Plan a longer hold.
- Lancaster County population projected at +5% by 2050 — modest demand growth; plan on rents tracking national, not racing it.
- At projected returns (-3.0% appreciation + 3.0% rent growth), your $29k cash investment doubles in ~4 years — after that, you're playing with house money.
Negotiation context
- Only 2 days on market — expect competitive offers; lowballing is unlikely to land.
Questions for the listing agent
- Is there a deadline driving the sale (1031 exchange, divorce, estate, relocation)? That informs how much negotiation room exists.
- What's the average days-on-market for RENTAL listings here right now (not sales)? A rising rental-DOM trend means longer vacancies and softer asking-rent achievability than the comps imply.
- What's the recent tenant-quality profile in this submarket — average credit score on applications, eviction rate, late-payment / NSF rate, and stable-employment percentage? A property-management company in the area should have these aggregated.
- How much new for-sale + rental construction is in the pipeline within 1–3 miles? Heavy new supply typically softens prices + rents 12–24 months out; constrained supply supports both.
Investment metrics
- 1% rule
- 1.89% ✓
- Cap rate
- 16.87%
- Cash-on-cash
- 37.76%
- DSCR
- 2.68
- GRM
- 4.4
CMA / ARV
No comps found within radius.
Projected returns pro-forma
-3.0% appreciation · 3.0% rent growth · sell at horizon
- IRR
- 33.8%
- Equity multiple
- 2.42×
- Total profit
- $41,853
- Equity at exit
- $15,641
- IRR
- 40.7%
- Equity multiple
- 4.82×
- Total profit
- $112,168
- Equity at exit
- $9,070
Cash invested: $29,372 (down + closing). Projections, not guarantees.
Landlord ↔ Tenant lean methodology
- Overall (STATE)
- 62 Landlord-Friendly
- State Pennsylvania
- 62 Landlord-Friendly · EVEN
- County
- — inherits STATE
- City
- — inherits STATE
ZIP-level market 17540
- Home prices YoY
- -27.3%
- Active inventory
- 26
- Price-to-rent
- 4.4×
Monthly cashflow live
- Estimated rent
- $1,984 medium interval (Pro) →
- Mortgage (P&I)
- −$550
- Tax from tax record
- −$49 /mo · $593/yr
- Insurance
- −$44
- HOA
- −$0
- Vacancy / Maint / Mgmt
- −$417
- Net cashflow
- $924
Break-even live
UW: 25.0% down · 7.5% · 30yr · 1.5% tax · 5.0% vac · 8.0% maint · 8.0% mgmt
Financing live
Cash to close
- Down payment
- $26,225
- Closing costs
- $3,147
- Reserves months
- —
- Total cash needed
- —
Loan-product check · same deal, 3 products live
Conventional
25% down · 7.5% · 30yr
- Down + closing
- —
- Monthly P&I
- —
- Monthly cashflow
- —
- DSCR
- —
- Eligible?
- —
Personal DTI + credit; lowest rate.
DSCR
20% down · 8.5% · 30yr
- Down + closing
- —
- Monthly P&I
- —
- Monthly cashflow
- —
- DSCR
- —
- Eligible?
- —
No personal income docs; deal must DSCR.
Hard money
10% down · 12.0% · 12mo
- Down + closing
- —
- Monthly P&I
- —
- Monthly cashflow
- —
- DSCR
- —
- Eligible?
- —
Short-term bridge; refi at stabilization.
Listing history 4 events
-
2026-06-18days on market $104,900 Active 2 DOM
-
2026-06-17status $104,900 Active 1 DOM
-
2026-06-15remarks 699-char remark
-
2026-06-15$104,900 Coming Soon 1 DOM
ⓘ Source: listings_history table (triggers on properties + properties_extension) + one-shot
backfill from property_details.listing_events for pre-trigger history.
Tax reassessment forecast PA · Partial reset (capped growth)
- Current annual tax
- $593 · $49/mo
- Projected year-2 tax
- $1,125 · $94/mo
- Expected delta
- +$532/yr (+$44/mo · 89.8%)
ⓘ Screening estimate from a state-policy table — verify with the county assessor before closing.
Nearby sold comps map
Loading sold comps map…
Walkable amenities ~0.75 mi
Loading nearby amenities…
Taxation est. · year 1
- Rental income
- $23,811
- − Mortgage interest
- −$5,876
- − Property taxes
- −$593
- − Insurance
- −$524
- − Repairs & maintenance
- −$1,905
- − Management
- −$1,905
- − Depreciation
- −$3,052
- Taxable income
- $9,956
- Est. tax owed @ 24.0%
- −$2,389
- After-tax cash flow
- $8,703/yr
For passive investors: Depreciation is non-cash, so a rental often shows a tax loss while cash-flowing — sheltering income. Rental losses are passive: they offset passive income freely, and up to $25,000/yr can offset ordinary (W-2) income if you actively participate and your MAGI is under $100k (phasing out to $0 by $150k); unused losses carry forward. On sale, claimed depreciation is recaptured at up to 25%, and gains may owe capital-gains tax (a 1031 exchange can defer both). Figures are a year-1 estimate at your 24.0% rate — not tax advice; consult a CPA.
Schools (NCES district)
- District
- Conestoga Valley SD
- NCES district ID
- 4206480
- Math proficiency
- 43% ▼ -8.00%
- Reading proficiency
- 59% ▼ -11.00%
- Median HH income
- $56,234
- Composite
- 44.15/100
- National rank
- #2861
- State rank
- #156 of 539 in PA
Livability — West Earl
No livability data for this city. (Only ~50 U.S. cities are tracked.)
Census & demographics
- Census place
- Brownstown, PA
- County
- Lancaster County · 390,309 people
- Metro
- Lancaster, PA
- Population (ZIP)
- 10,728
- Household income
- $91,895
- Rent vs Own
- Severe rent burden
- 159.0
Population outlook (Lancaster County) Hauer SSP2
- Today (2025)
- 561,011 people
- By 2030
- 570,969 · +1.8%
- By 2040
- 585,929 · +4.4%
- By 2050
- 591,056 · +5.4%
- By 2075
- 594,747 · +6.0%
- By 2100
- 558,850 · -0.4%
Race, ethnicity, and origin ACS 2023
- Neighborhood character
- Predominantly White (78%)
- Race & ethnicity
- White 78% Hispanic / Latino 10% Two or more races 8% Asian 5% Black 3%
- Hispanic origin (detail)
- Puerto Rican 8%
- Common ancestry
- Scandinavian 3% Italian 3% Romanian 2%
- Foreign-born
- 6% · Canada, Vietnam
- Languages at home
- 79% English-only · German/W. Germanic 10% Spanish 5% Other Asian/Pacific 2%
Political lean MEDSL · Lancaster
- 2024 margin
- R (+15.9) · D 41.5% · R 57.5%
- 2008→2024 swing
- -4.1pp toward R · 2008: -11.8pp · 2024: -15.9pp
- All cycles
- 2024: R+15.9 2020: R+15.8 2016: R+19.7 2012: R+19.2 2008: R+11.8
Not yet ingested
- Civics
- —
Market trends
- HPI YoY
- ▼ -97.94%
- Current HPI
- 260.303
- Rent YoY
- —
- Metro
- Lancaster, PA
- State GDP YoY
- ▲ 1.68%
- F500 in state
- 34
Industry mix (Fortune 500 HQ in PA)
| Industry | F500 HQs | Revenue |
|---|---|---|
| Healthcare | 2 | $309B |
|
||
| Insurance | 2 | $27B |
|
||
| Telecommunications / Media | 1 | $124B |
|
||
| Industrial Distribution | 1 | $22B |
|
||
| Financial Services | 1 | $20B |
|
||
| Chemicals / Materials | 1 | $18B |
|
||
Price history
1 event — show timeline
- 2026-06-15 Coming Soon $104,900 BRIGHT MLS
Property tax history
+3.3%/yrLatest (2026): $593 · +4.1% YoY. Source: county tax records.
Cash-flow waterfall
monthlySold comps — $/sqft
last 12 mo · ≤1 miLoading sold comps…