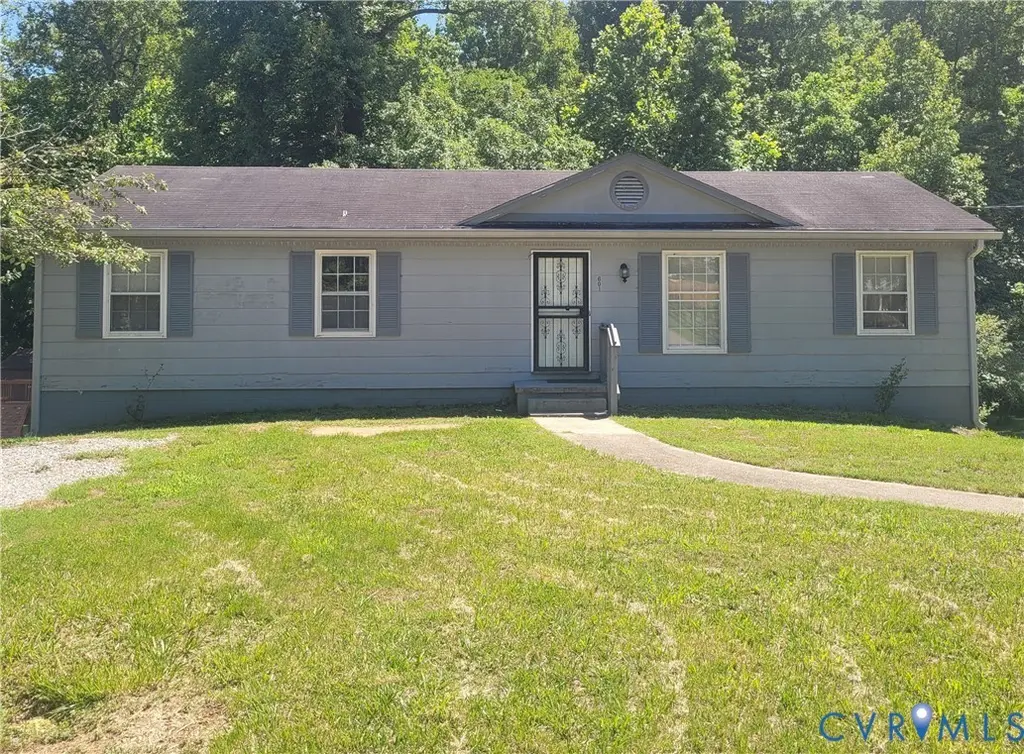
601 Roark St · Chase City, VA
Flood risk 8/10 · Major
- FEMA flood zone
- X (unshaded)
- Chance of flooding over 30 yrs
- 0.99%
- Est. flood insurance / yr
- $507 – $1,088
Fire risk 4/10 · Minor
- Est. fire insurance / yr
- $666 – $1,236
Heat risk 6/10 · Moderate
- Hot days now (above 105°F)
- 7 days/yr
- Hot days in 30 yrs
- 17 days/yr
Wind risk 5/10 · Moderate
- Chance of severe wind over 30 yrs
- 22.0%
Air-quality risk 1/10 · Minimal
- Unhealthy air days now
- 0 days/yr
- Unhealthy air days in 30 yrs
- 0 days/yr
Risk factors via First Street. Map © Google.
Why this score? — see what drove the A- grade
The composite is a weighted blend of 9 inputs, each scored 0–100. Each bar is that input's sub-score; the figure is the points it added to the 100-point composite (weight × sub-score).
- Cash flow +28.6/30.0
- ARV discount +15.0/15.0
- DSCR +10.0/10.0
- 1% rule +6.7/10.0
- Appreciation +6.0/10.0
- Schools +5.4/10.0
- Livability +3.5/5.0
- Rent growth +2.5/5.0
- Condition / age +2.5/5.0
$140,000
🖨 Deal sheet 📄 Offer letter ✓ Due diligence
Listing remarks MLS
Spacious 3bd 2.5bth home with a full basement! This home has lots of potential as an investment property or a great starter home. The main floor has 3 spacious bedroom and 2 full bathrooms, a full kitchen with plenty of cabinet space, a dining room, family room, and living room. You could use these rooms for whatever purposes you'd need! As an investment property you could potentially rent out the main floor as a 3bd 2bth and then finish the basement to be rented as a separate living space. Currently there is a half bathroom in the basement that could be updated to a full bathroom and plenty of space to expand downstairs. The back yard is nice and flat and borders a creek in the back. Plenty of room for kids to play or space for gardening. There is also a small storage shed that comes with the property. Bring your ideas explore all the potential with this spacious small town property!
Key facts
- 7,000 sq ft lot
- Parking
- Built 1970
Property features AI
Exterior
- Parking: Unpaved driveway
- Utilities: Public water; Public sewer; Electric service
- Home design: Single-story property; Resale condition; R1 zoning
- Construction: Block construction; Drywall interior; Vinyl siding; Composition shingle roof; Slab foundation; Built as shown in public records
- Exterior features: Rear porch; Patio; Unpaved driveway
Interior
- Kitchen: Laminate counters
- Bedrooms: Includes a bedroom on the main level
- Flooring: Laminate flooring; Partially carpeted
- Bathrooms: Two full bathrooms; One half bathroom; Full bath on first level with tub and shower
- Heating & cooling: Electric baseboard heating; Window air conditioning units
- Interior features: Bedroom on main level; Laminate counters; Walk-out basement; Interior entry to basement
- Laundry & utility: Electric water heater
Neighborhood map
What this means for you Summary
Snapshot
- This is a 3-bed/2.5-bath single-family listed at $140k.
Deal economics
- At list price, monthly cash flow is $394 ($5k/yr) — positive.
- The deal already cash-flows at list — no discount required.
- Meets the 1% rule at list price ($2k rent vs $140k).
- Recommended offer: $138k (1.5% below list) — sets the bar for market timing.
- Cap rate 10.2% vs local median 7.3% in Chase City — top-decile yield for the area; either an underpriced asset or a hidden risk that comps aren't pricing in. Stress-test before assuming the spread holds.
Location & tenants
- Location reads 70/100 on livability (#238 in VA) — a middle-class / working-renter tenant base. Strengths: cost of living A+, housing A+, health & safety A+; Watch: amenities F, commute F, employment F.
- Mecklenburg County Public School District (rural): math 57% / reading 72% proficiency, ranked #49 of 131 in VA (top 37%) — acceptable for families but not a draw, mixed tenant base, ~2y average lease.
- Market conditions: 41 active listings in the ZIP; 2 comparable units currently listed for rent nearby; 153 units permitted in Mecklenburg County in 2024 (0 in 5+ unit buildings).
Forward outlook
- In year one you build about $4k of equity ($968 loan paydown + $3k appreciation (2.0% local appreciation)).
- Mecklenburg County population projected at -26% by 2050 — secular population decline; favor cash flow + early exit over multi-decade hold.
- At projected returns (2.0% appreciation + 3.0% rent growth), your $39k cash investment doubles in ~5 years — after that, you're playing with house money.
- By year 9, paydown + projected appreciation supports a ~$33k cash-out refi (75% LTV) — recoverable capital for the next deal without selling this one.
Negotiation context
- It's been on market 16 days — a 2% lower offer ($138k) is reasonable based on typical stale-listing flexibility.
- 3 sale attempts since 4y ago with the ask held roughly flat each time — persistent listings suggest the price (not the market) is what's stuck; bring a comps-based counter.
Risks & watch-outs
- Watch-outs: flood insurance adds $66/mo.
- Climate carrying-cost: severe flood risk; moderate wind risk, 22% chance of damaging wind over 30y; extreme-heat days projected 7→17/yr by 2055 (HVAC capex compounding) — expect insurance premiums to compound above CPI over the hold.
Questions for the listing agent
- Built in 1970 — when were the roof, HVAC, electrical panel, plumbing, and water heater last replaced?
- What's the actual annual flood-insurance premium (NFIP or private), and is the property in a SFHA with mandatory coverage?
- Is there a deadline driving the sale (1031 exchange, divorce, estate, relocation)? That informs how much negotiation room exists.
- Schools are B-rated — typically a magnet for longer-tenancy family renters. What's the average tenant stay here, and is there a school-zone premium baked into asking?
- What's the average days-on-market for RENTAL listings here right now (not sales)? A rising rental-DOM trend means longer vacancies and softer asking-rent achievability than the comps imply.
- What's the recent tenant-quality profile in this submarket — average credit score on applications, eviction rate, late-payment / NSF rate, and stable-employment percentage? A property-management company in the area should have these aggregated.
- How much new for-sale + rental construction is in the pipeline within 1–3 miles? Heavy new supply typically softens prices + rents 12–24 months out; constrained supply supports both.
Investment metrics
- 1% rule
- 1.17% ✓
- Cap rate
- 10.24%
- Cash-on-cash
- 14.09%
- DSCR
- 1.63
- GRM
- 7.1
CMA / ARV
- ARV (on-the-fly)
- $187,200
- Comps found
- 6
Show comp detail 6 sales within ~0.75 mi
| Address | Dist | Beds/Ba | Sqft | Sold | Price | $/sf | Match |
|---|---|---|---|---|---|---|---|
| 516 Berry St | 0.13mi | 3/2.0 | 1,333 (+7%) | 10mo | $199,900 | $150 | 73 |
| 420 Berry St | 0.21mi | 3/2.0 | 1,095 (-12%) | 9mo | $225,000 | $205 | 60 |
| 908 N Main St | 0.51mi | 4/2.0 (+1) | 1,216 (-3%) | 8mo | $205,000 | $169 | 58 |
| 30 Orchard St | 0.58mi | 3/1.5 | 1,227 (-2%) | 11mo | $130,000 | $106 | 57 |
| 234 Jeffreys Ave | 0.34mi | 2/1.0 (-1) | 1,161 (-7%) | 9mo | $140,000 | $121 | 54 |
| 414 Berry St | 0.22mi | 2/1.0 (-1) | 1,088 (-13%) | 13mo | $100,000 | $92 | 47 |
Match score weights: distance 35% · size 25% · config 20% · recency 20%. Top-matched comps best support the ARV.
Projected returns pro-forma
2.04% appreciation · 3.0% rent growth · sell at horizon
- IRR
- 16.5%
- Equity multiple
- 1.89×
- Total profit
- $34,954
- Equity at exit
- $55,519
- IRR
- 18.8%
- Equity multiple
- 3.51×
- Total profit
- $98,311
- Equity at exit
- $80,180
Cash invested: $39,200 (down + closing). Projections, not guarantees.
Landlord ↔ Tenant lean methodology
- Overall (STATE)
- 55 Moderately Landlord-Leaning
- State Virginia
- 55 Moderately Landlord-Leaning · D+2
- County
- — inherits STATE
- City
- — inherits STATE
ZIP-level market 23924
- Home prices YoY
- 1.3%
- Active inventory
- 41
- Price-to-rent
- 7.1×
Monthly cashflow live
- Estimated rent
- $1,638 medium interval (Pro) →
- Mortgage (P&I)
- −$734
- Tax from tax record
- −$41 /mo · $495/yr
- Insurance
- −$58
- Flood insurance flood zone
- −$66 /mo · $798/yr
- HOA
- −$0
- Vacancy / Maint / Mgmt
- −$344
- Net cashflow
- $394
Break-even live
UW: 25.0% down · 7.5% · 30yr · 1.5% tax · 5.0% vac · 8.0% maint · 8.0% mgmt
Financing live
Cash to close
- Down payment
- $35,000
- Closing costs
- $4,200
- Reserves months
- —
- Total cash needed
- —
Loan-product check · same deal, 3 products live
Conventional
25% down · 7.5% · 30yr
- Down + closing
- —
- Monthly P&I
- —
- Monthly cashflow
- —
- DSCR
- —
- Eligible?
- —
Personal DTI + credit; lowest rate.
DSCR
20% down · 8.5% · 30yr
- Down + closing
- —
- Monthly P&I
- —
- Monthly cashflow
- —
- DSCR
- —
- Eligible?
- —
No personal income docs; deal must DSCR.
Hard money
10% down · 12.0% · 12mo
- Down + closing
- —
- Monthly P&I
- —
- Monthly cashflow
- —
- DSCR
- —
- Eligible?
- —
Short-term bridge; refi at stabilization.
Rent comps 2 comps
| Address | Beds | Baths | Sqft | Rent | $/sqft | DOM | Units | Dist |
|---|---|---|---|---|---|---|---|---|
| 1035 Roark St Chase City, VA | 2.0 | 1.0 | 892 | $1,800 | $2.02 | 14d | 1 | 0.45mi |
| 761 W 5th St Chase City, VA | 3.0 | 1.0 | 1040 | $1,300 | $1.25 | 14d | 1 | 1.10mi |
Listing history 14 events
-
2026-06-18days on market $140,000 Active 16 DOM
-
2026-06-17days on market $140,000 Active 15 DOM
-
2026-06-16days on market $140,000 Active 14 DOM
-
2026-06-15days on market $140,000 Active 13 DOM
-
2026-06-14days on market $140,000 Active 11 DOM
-
2026-06-13days on market $140,000 Active 10 DOM
-
2026-06-10days on market $140,000 Active 8 DOM
-
2026-06-09days on market $140,000 Active 7 DOM
-
2026-06-08days on market $140,000 Active 6 DOM
-
2026-06-07days on market $140,000 Active 5 DOM
-
2026-06-05days on market $140,000 Active 2 DOM
-
2026-06-03remarks 465-char remark
-
2026-06-03remarks 454-char remark
-
2026-06-03$140,000 Active 1 DOM
ⓘ Source: listings_history table (triggers on properties + properties_extension) + one-shot
backfill from property_details.listing_events for pre-trigger history.
Tax reassessment forecast VA · Resets to sale price
- Current annual tax
- $495 · $41/mo
- Projected year-2 tax
- $1,148 · $96/mo
- Expected delta
- +$653/yr (+$54/mo · 131.9%)
ⓘ Screening estimate from a state-policy table — verify with the county assessor before closing.
Climate risk First Street
- Flood 8/10 Severe FEMA zone X (unshaded) · 99% chance over 30 yrs
- Wildfire 4/10 Moderate
- Heat 6/10 Major 7 d/yr ≥105°F today · 17 d/yr by 30 yrs out
- Wind 5/10 Major 22% chance of damaging wind over 30 yrs
- Air quality 1/10 Low 0 unhealthy d/yr today · 0 by 30 yrs out
Nearby sold comps map
Loading sold comps map…
Walkable amenities ~0.75 mi
Loading nearby amenities…
Taxation est. · year 1
- Rental income
- $19,658
- − Mortgage interest
- −$7,842
- − Property taxes
- −$495
- − Insurance
- −$1,498
- − Repairs & maintenance
- −$1,573
- − Management
- −$1,573
- − Depreciation
- −$4,073
- Taxable income
- $2,605
- Est. tax owed @ 24.0%
- −$625
- After-tax cash flow
- $4,102/yr
For passive investors: Depreciation is non-cash, so a rental often shows a tax loss while cash-flowing — sheltering income. Rental losses are passive: they offset passive income freely, and up to $25,000/yr can offset ordinary (W-2) income if you actively participate and your MAGI is under $100k (phasing out to $0 by $150k); unused losses carry forward. On sale, claimed depreciation is recaptured at up to 25%, and gains may owe capital-gains tax (a 1031 exchange can defer both). Figures are a year-1 estimate at your 24.0% rate — not tax advice; consult a CPA.
Schools (NCES district)
- District
- Mecklenburg County Public School District
- NCES district ID
- 5102460
- Math proficiency
- 57% ▼ -29.00%
- Reading proficiency
- 72% ▼ -7.00%
- Median HH income
- $37,491
- Composite
- 53.55/100
- National rank
- #1446
- State rank
- #49 of 131 in VA
Livability — Chase City
- Score
- 70/100
- State rank
- #238
- US rank
- #8038
Category grades
Schools grade is shown separately in the Schools card above.
Census & demographics
- Census place
- Chase City, VA
- Population (ZIP)
- 5,709
Population outlook (Mecklenburg County) Hauer SSP2
- Today (2025)
- 28,332 people
- By 2030
- 26,742 · -5.6%
- By 2040
- 23,502 · -17.0%
- By 2050
- 20,851 · -26.4%
- By 2075
- 17,525 · -38.1%
- By 2100
- 14,524 · -48.7%
Race, ethnicity, and origin ACS 2023
- Neighborhood character
- Majority White (60%)
- Race & ethnicity
- White 60% Black 36% Hispanic / Latino 3% Two or more races 1%
- Common ancestry
- Slovak 3% Italian 1%
- Foreign-born
- 2% · Canada
- Languages at home
- 98% English-only · Spanish 2%
Political lean MEDSL · Mecklenburg
- 2024 margin
- Strong R (+20.8) · D 39.4% · R 60.2%
- 2008→2024 swing
- -16.2pp toward R · 2008: -4.6pp · 2024: -20.8pp
- All cycles
- 2024: R+20.8 2020: R+15.2 2016: R+11.3 2012: R+7.2 2008: R+4.6
Not yet ingested
- Civics
- —
Market trends
- HPI YoY
- ▲ 2.04%
- Current HPI
- 155.5959
- Rent YoY
- —
- Metro
- —
- State GDP YoY
- ▲ 2.40%
- F500 in state
- 50
Industry mix (Fortune 500 HQ in VA)
| Industry | F500 HQs | Revenue |
|---|---|---|
| Aerospace / Defense | 4 | $236B |
|
||
| Technology / Defense | 3 | $32B |
|
||
| Financial Services | 2 | $176B |
|
||
| Utilities | 2 | $27B |
|
||
| Insurance | 2 | $25B |
|
||
| Technology | 2 | $15B |
|
||
Price history
+100.0% since first listed8 events — show timeline
- 2026-06-02 Listed $140,000 CVRMLS
- 2026-02-10 Listing Removed — CVRMLS
- 2026-01-21 Price Changed $135,000 CVRMLS
- 2025-12-22 Listed $115,000 CVRMLS
- 2022-06-27 Sold (Public Records) $138,000 Public Records
- 2022-06-27 Sold (MLS) $138,000 SPLLAR
- 2022-04-13 Listed $150,000 SPLLAR
- 2007-05-03 Sold (Public Records) $70,000 Public Records
Property tax history
+5.9%/yrLatest (2025): $495 · +0.0% YoY. Source: county tax records.
Cash-flow waterfall
monthlySold comps — $/sqft
last 12 mo · ≤1 miLoading sold comps…