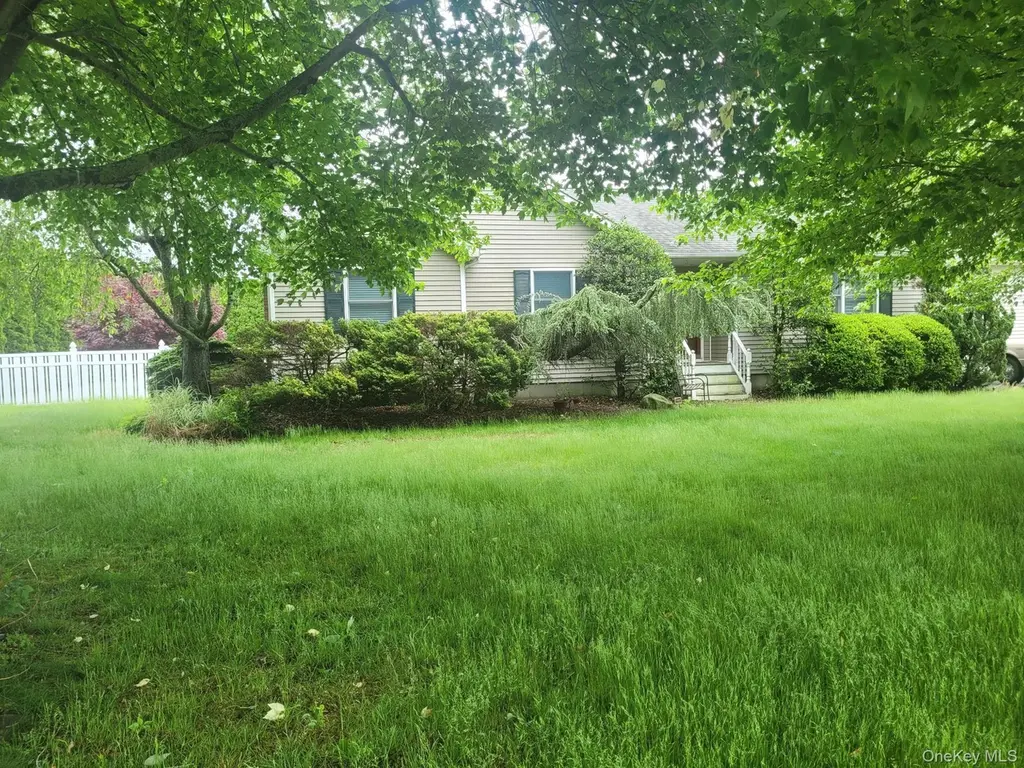
312 Riley Ave · Calverton, NY
Flood risk 1/10 · Minimal
- FEMA flood zone
- X (unshaded)
- Chance of flooding over 30 yrs
- 0.0%
- Est. flood insurance / yr
- $473 – $860
Fire risk 4/10 · Minor
- Est. fire insurance / yr
- $691 – $1,283
Heat risk 5/10 · Moderate
- Hot days now (above 93°F)
- 7 days/yr
- Hot days in 30 yrs
- 19 days/yr
Wind risk 8/10 · Major
- Chance of severe wind over 30 yrs
- 80.0%
Air-quality risk 3/10 · Minor
- Unhealthy air days now
- 2 days/yr
- Unhealthy air days in 30 yrs
- 3 days/yr
Risk factors via First Street. Map © Google.
Why this score? — see what drove the C+ grade
The composite is a weighted blend of 9 inputs, each scored 0–100. Each bar is that input's sub-score; the figure is the points it added to the 100-point composite (weight × sub-score).
- Cash flow +24.2/30.0
- ARV discount +8.2/15.0
- DSCR +7.8/10.0
- Appreciation +6.6/10.0
- 1% rule +6.2/10.0
- Schools +3.6/10.0
- Livability +2.9/5.0
- Rent growth +2.5/5.0
- Condition / age +2.5/5.0
$669,000
🖨 Deal sheet (PDF) 📄 Offer letter ✓ Due diligence
Listing remarks
Lovely well kept 3 bedroom 2 full bathroom Ranch. Sits on a level, landscaped, manicured, fully fenced in lot. This home has been updated and is in excellent, move in ready condition. Easy living with room for everyone. Gleaming oak hardwood floors. Vaulted Cathedral Living Room Ceiling, Formal Dinning room with sliders to outside Deck. Primary Bedroom contains walk-in closet and private, tiled en suite Bathroom. Two additional bedrooms with a full house bathroom. Enormous, dry basement with an 8' ceiling. Motorized canopied deck. Fully attached one car garage with expansive driveway that accomidates 6 vehicles. Easy access to beach and vineyards.
Key facts
- Level lot
- Landscaped lot
- Updated home
Tags
Property features AI
Exterior
- Parking: Attached garage; Driveway; Total parking for 6 vehicles; 1 garage space
- Utilities: Cesspool sewer; Electricity available
- Home design: Single-family residence
- Construction: Frame construction
- Exterior features: Frame construction; Not waterfront
Interior
- Kitchen: Dishwasher; Refrigerator
- Bedrooms: Rooms total: 6
- Bathrooms: 2 full bathrooms
- Heating & cooling: Oil hot water heating; Wall/window air conditioning units
- Interior features: First-floor bedroom; First-floor full bathroom; Full basement; Partial attic
- Laundry & utility: Washer; Dryer; Hot water heating (oil-fired)
Neighborhood map
What this means for you Summary
Snapshot
- This is a 3-bed/2.0-bath single-family listed at $669k.
Deal economics
- At list price, monthly cash flow is $1k ($16k/yr) — positive.
- The deal already cash-flows at list — no discount required.
- Meets the 1% rule at list price ($8k rent vs $669k).
- Recommended offer: $659k (1.5% below list) — sets the bar for market timing.
- Cap rate 8.7% vs local median 7.2% in Calverton — meaningfully above typical; check what's discounted (condition, days-on-market, listing class) to confirm the premium yield is real.
Location & tenants
- Location reads 58/100 on livability (#1,053 in NY) — a working-class tenant base; expect higher turnover. Watch: crime C-, employment D, amenities F.
- Riverhead Central School District (suburban): math 34% / reading 48% proficiency, ranked #489 of 590 in NY (top 83%) — families likely to look elsewhere, expect single-tenant / working-renter base with shorter leases.
- Zoned schools: Riley Avenue School (math 42% / reading 52%, grade D-, #1,195 of 2,108 statewide, top 60%, 461 students, 34% FRL); Riverhead Middle School (math 18% / reading 35%, grade F, #594 of 729 statewide, top 81%, 827 students, 57% FRL); Riverhead Senior High School (math 80% / reading 86%, grade A, #440 of 1,100 statewide, top 40%, 2,001 students, 52% FRL).
- Market conditions: 85 active listings in the ZIP; 1 comparable units currently listed for rent nearby; 1,366 units permitted in Suffolk County in 2024 (216 in 5+ unit buildings).
Forward outlook
- In year one you build about $26k of equity ($5k loan paydown + $22k appreciation (3.3% local appreciation)).
- Suffolk County population projected to shrink 5% by 2050 — rents likely to lag national; underwrite the cash flow, not the appreciation.
- At projected returns (3.3% appreciation + 3.0% rent growth), your $187k cash investment doubles in ~4 years — after that, you're playing with house money.
- By year 2, paydown + projected appreciation supports a ~$43k cash-out refi (75% LTV) — recoverable capital for the next deal without selling this one.
Negotiation context
- It's been on market 24 days — a 2% lower offer ($659k) is reasonable based on typical stale-listing flexibility.
- Current owner paid $390k; list at $669k implies a 72% gain — meaningful room to come down on a strong offer.
Risks & watch-outs
- Climate carrying-cost: severe wind risk, 80% chance of damaging wind over 30y; extreme-heat days projected 7→19/yr by 2055 (HVAC capex compounding) — expect insurance premiums to compound above CPI over the hold.
Questions for the listing agent
- Is there a deadline driving the sale (1031 exchange, divorce, estate, relocation)? That informs how much negotiation room exists.
- Schools are D-rated, which usually means shorter tenancies and higher turnover. Who's the typical renter profile here, and what's been the actual vacancy rate?
- What's the average days-on-market for RENTAL listings here right now (not sales)? A rising rental-DOM trend means longer vacancies and softer asking-rent achievability than the comps imply.
- What's the recent tenant-quality profile in this submarket — average credit score on applications, eviction rate, late-payment / NSF rate, and stable-employment percentage? A property-management company in the area should have these aggregated.
- How much new for-sale + rental construction is in the pipeline within 1–3 miles? Heavy new supply typically softens prices + rents 12–24 months out; constrained supply supports both.
Investment metrics
- 1% rule
- 1.12% ✓
- Cap rate
- 8.68%
- Cash-on-cash
- 8.54%
- DSCR
- 1.38
- GRM
- 7.4
CMA / ARV
- ARV (on-the-fly)
- $679,952
- Comps found
- 3
Show comp detail 3 sales within ~0.75 mi
| Address | Dist | Beds/Ba | Sqft | Sold | Price | $/sf | Match |
|---|---|---|---|---|---|---|---|
| 141 Jakes Ln | 0.16mi | 3/2.0 | 1,488 (+2%) | 10mo | $695,000 | $467 | 81 |
| 54 Southfield Rd | 0.62mi | 3/2.0 | 1,350 (-7%) | 9mo | $639,000 | $473 | 52 |
| 166 Williams Way S | 0.59mi | 3/3.0 | 1,652 (+14%) | 10mo | $760,000 | $460 | 38 |
Match score weights: distance 35% · size 25% · config 20% · recency 20%. Top-matched comps best support the ARV.
Projected returns pro-forma
3.26% appreciation · 3.0% rent growth · sell at horizon
- IRR
- 16.1%
- Equity multiple
- 1.93×
- Total profit
- $174,803
- Equity at exit
- $310,638
- IRR
- 17.5%
- Equity multiple
- 3.63×
- Total profit
- $492,227
- Equity at exit
- $486,514
Cash invested: $187,320 (down + closing). Projections, not guarantees.
Landlord ↔ Tenant lean methodology
- Overall (STATE)
- 15 Strongly Tenant-Friendly
- State New York
- 15 Strongly Tenant-Friendly · D+10
- County
- — inherits STATE
- City
- — inherits STATE
ZIP-level market 11933
- Home prices YoY
- 0.8%
- Active inventory
- 85
- Price-to-rent
- 7.4×
Monthly cashflow live
- Estimated rent
- $7,500 medium interval (Pro) →
- Mortgage (P&I)
- −$3,508
- Tax from tax record
- −$805 /mo · $9,663/yr
- Insurance
- −$279
- HOA
- −$0
- Vacancy / Maint / Mgmt
- −$1,575
- Net cashflow
- $1,333
Break-even live
Sensitivity live
| Price | -10% $1,711 | -5% $1,522 | +0% $1,333 | +5% $1,143 | +10% $954 |
|---|---|---|---|---|---|
| Rent | -10% $740 | -5% $1,036 | +0% $1,333 | +5% $1,629 | +10% $1,925 |
| Rate | -1.0pp $1,670 | -0.5pp $1,503 | base $1,333 | +0.5pp $1,159 | +1.0pp $983 |
UW: 25.0% down · 7.5% · 30yr · 1.5% tax · 5.0% vac · 8.0% maint · 8.0% mgmt
Financing live
Cash to close
- Down payment
- $167,250
- Closing costs
- $20,070
- Reserves months
- —
- Total cash needed
- —
Loan-product check · same deal, 3 products live
Conventional
25% down · 7.5% · 30yr
- Down + closing
- —
- Monthly P&I
- —
- Monthly cashflow
- —
- DSCR
- —
- Eligible?
- —
Personal DTI + credit; lowest rate.
DSCR
20% down · 8.5% · 30yr
- Down + closing
- —
- Monthly P&I
- —
- Monthly cashflow
- —
- DSCR
- —
- Eligible?
- —
No personal income docs; deal must DSCR.
Hard money
10% down · 12.0% · 12mo
- Down + closing
- —
- Monthly P&I
- —
- Monthly cashflow
- —
- DSCR
- —
- Eligible?
- —
Short-term bridge; refi at stabilization.
Rent comps 1 comps
| Address | Beds | Baths | Sqft | Rent | $/sqft | DOM | Units | Dist |
|---|---|---|---|---|---|---|---|---|
| 16 Mastro Ct Calverton, NY | 3.0 | 2.5 | 1822 | $7,500 | $4.12 | 0d | 1 | 1.09mi |
Listing history 14 events
-
2026-06-21days on market $669,000 Active 24 DOM
-
2026-06-18days on market $669,000 Active 21 DOM
-
2026-06-17days on market $669,000 Active 20 DOM
-
2026-06-16days on market $669,000 Active 19 DOM
-
2026-06-15days on market $669,000 Active 18 DOM
-
2026-06-13days on market $669,000 Active 16 DOM
-
2026-06-09days on market $669,000 Active 12 DOM
-
2026-06-08days on market $669,000 Active 11 DOM
-
2026-06-07days on market $669,000 Active 10 DOM
-
2026-06-04days on market $669,000 Active 7 DOM
-
2026-06-03days on market $669,000 Active 6 DOM
-
2026-06-02days on market $669,000 Active 5 DOM
-
2026-06-01days on market $669,000 Active 4 DOM
-
2026-05-31days on market $669,000 Active 3 DOM
ⓘ Source: listings_history table (triggers on properties + properties_extension) + one-shot
backfill from property_details.listing_events for pre-trigger history.
Tax reassessment forecast NY · Partial reset (capped growth)
- Current annual tax
- $9,663 · $805/mo
- Projected year-2 tax
- $10,484 · $874/mo
- Expected delta
- +$822/yr (+$68/mo · 8.5%)
ⓘ Screening estimate from a state-policy table — verify with the county assessor before closing.
Climate risk First Street
- Flood 1/10 Low FEMA zone X (unshaded) · 0% chance over 30 yrs
- Wildfire 4/10 Moderate
- Heat 5/10 Major 7 d/yr ≥93°F today · 19 d/yr by 30 yrs out
- Wind 8/10 Severe 80% chance of damaging wind over 30 yrs
- Air quality 3/10 Moderate 2 unhealthy d/yr today · 3 by 30 yrs out
Nearby sold comps map
Loading sold comps map…
Walkable amenities ~0.75 mi
Loading nearby amenities…
Taxation est. · year 1
- Rental income
- $90,000
- − Mortgage interest
- −$37,474
- − Property taxes
- −$9,663
- − Insurance
- −$3,345
- − Repairs & maintenance
- −$7,200
- − Management
- −$7,200
- − Depreciation
- −$19,462
- Taxable income
- $5,656
- Est. tax owed @ 24.0%
- −$1,357
- After-tax cash flow
- $14,635/yr
For passive investors: Depreciation is non-cash, so a rental often shows a tax loss while cash-flowing — sheltering income. Rental losses are passive: they offset passive income freely, and up to $25,000/yr can offset ordinary (W-2) income if you actively participate and your MAGI is under $100k (phasing out to $0 by $150k); unused losses carry forward. On sale, claimed depreciation is recaptured at up to 25%, and gains may owe capital-gains tax (a 1031 exchange can defer both). Figures are a year-1 estimate at your 24.0% rate — not tax advice; consult a CPA.
Schools (NCES district)
- District
- Riverhead Central School District
- NCES district ID
- 3624690
- Math proficiency
- 34% ▼ -4.00%
- Reading proficiency
- 48% ▲ 13.00%
- Median HH income
- $61,607
- Composite
- 36.38/100
- National rank
- #4683
- State rank
- #489 of 590 in NY
Livability — Calverton
- Score
- 58/100
- State rank
- #1053
- US rank
- #20908
Category grades
Schools grade is shown separately in the Schools card above.
Census & demographics
- Census place
- Calverton, NY
- City population
- 6,784
- Population (ZIP)
- 6,784
Population outlook (Suffolk County) Hauer SSP2
- Today (2025)
- 1,505,262 people
- By 2030
- 1,498,318 · -0.5%
- By 2040
- 1,471,101 · -2.3%
- By 2050
- 1,424,848 · -5.3%
- By 2075
- 1,337,157 · -11.2%
- By 2100
- 1,217,720 · -19.1%
Race, ethnicity, and origin ACS 2023
- Neighborhood character
- Predominantly White (79%)
- Race & ethnicity
- White 79% Hispanic / Latino 10% Black 8% Two or more races 2% Asian 1%
- Hispanic origin (detail)
- Puerto Rican 1% Dominican 4%
- Common ancestry
- Romanian 5% Lithuanian 3% Iranian 1%
- Foreign-born
- 11% · Canada, Jamaica, South Korea
- Languages at home
- 85% English-only · Spanish 10% Other Indo-European 3% German/W. Germanic 1%
Political lean MEDSL · Suffolk
- 2024 margin
- Lean R (+10.0) · D 45.0% · R 55.0%
- 2008→2024 swing
- -16.0pp toward R · 2008: 6.0pp · 2024: -10.0pp
- All cycles
- 2024: R+10.0 2020: R+0.0 2016: R+8.2 2012: D+2.9 2008: D+6.0
Not yet ingested
- Civics
- —
Market trends
- HPI YoY
- ▲ 3.26%
- Current HPI
- 397.7148
- Rent YoY
- —
- Metro
- —
- State GDP YoY
- ▲ 2.60%
- F500 in state
- 92
Industry mix (Fortune 500 HQ in NY)
| Industry | F500 HQs | Revenue |
|---|---|---|
| Financial Services | 10 | $950B |
|
||
| Consumer Goods | 9 | $162B |
|
||
| Insurance | 4 | $225B |
|
||
| Telecommunications | 2 | $144B |
|
||
| Pharmaceuticals | 2 | $112B |
|
||
| Media / Entertainment | 2 | $69B |
|
||
Price history
+1811.4% since first listed5 events — show timeline
- 2026-05-28 Listed $669,000 OneKey® MLS as Distributed by MLS Grid
- 2008-07-25 Sold (Public Records) $390,000 Public Records
- 1995-07-21 Sold (Public Records) $129,500 Public Records
- 1995-04-07 Sold (Public Records) $37,000 Public Records
- 1993-04-05 Sold (Public Records) $35,000 Public Records
Property tax history
+3.4%/yrLatest (2025): $9,663 · +0.0% YoY. Source: county tax records.
Cash-flow waterfall
monthlySold comps — $/sqft
last 12 mo · ≤1 miLoading sold comps…