 🏷️ Likely Rental
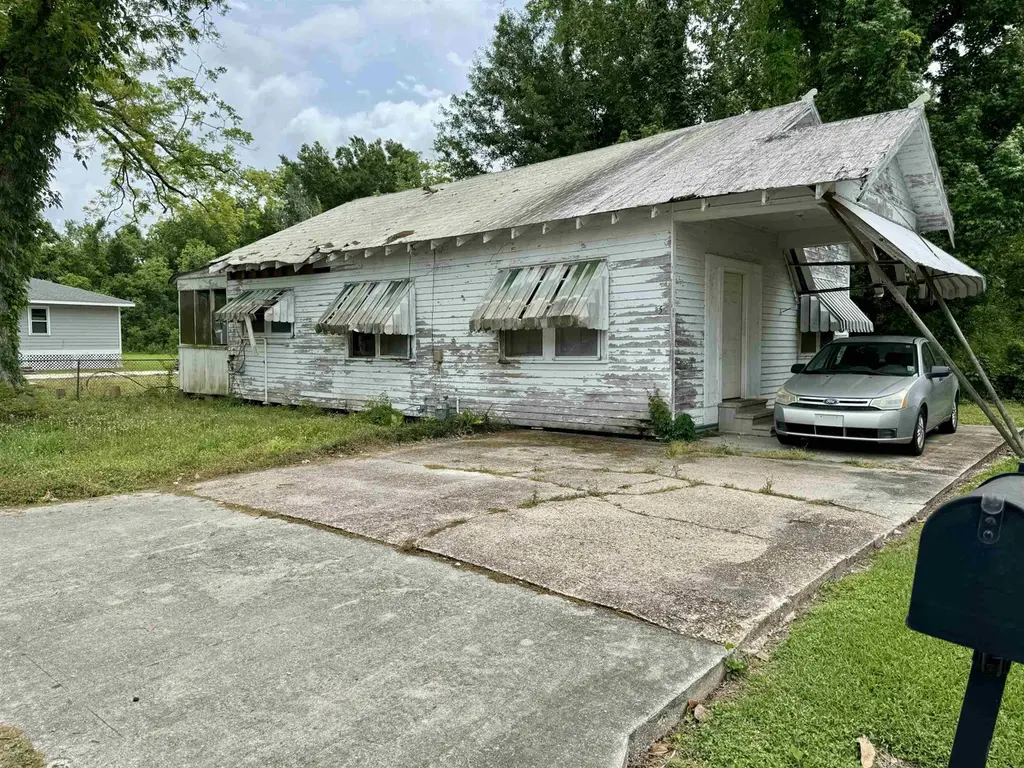
254 Carlos St · Bayou Cane, LA
Flood risk 7/10 · Major
- FEMA flood zone
- X (shaded)
- Chance of flooding over 30 yrs
- 0.58%
- Est. flood insurance / yr
- $507 – $1,088
Fire risk 1/10 · Minimal
- Est. fire insurance / yr
- $1,269 – $2,357
Heat risk 9/10 · Severe
- Hot days now (above 107°F)
- 7 days/yr
- Hot days in 30 yrs
- 21 days/yr
Wind risk 9/10 · Severe
- Chance of severe wind over 30 yrs
- 99.0%
Air-quality risk 1/10 · Minimal
- Unhealthy air days now
- 0 days/yr
- Unhealthy air days in 30 yrs
- 0 days/yr
Risk factors via First Street. Map © Google.
Why this score? — see what drove the B- grade
The composite is a weighted blend of 9 inputs, each scored 0–100. Each bar is that input's sub-score; the figure is the points it added to the 100-point composite (weight × sub-score).
- Cash flow +30.0/30.0
- 1% rule +10.0/10.0
- DSCR +10.0/10.0
- ARV discount +7.5/15.0
- Schools +3.3/10.0
- Livability +3.2/5.0
- Rent growth +2.5/5.0
- Condition / age +1.0/5.0
- Appreciation +0.0/10.0
$48,000
🖨 Deal sheet 📄 Offer letter ✓ Due diligence
Listing remarks MLS
Calling all investors!! This tenant occupied single family unit makes a perfect addition to your portfolio. Don't wait, schedule your private showing today!!
Key facts
- 3,484 sq ft lot
- Built 1965
- Listed 503 days
Neighborhood map
What this means for you Summary
Snapshot
- This is a 2-bed/1.0-bath single-family listed at $48k. Condition is rated poor.
Deal economics
- At list price, monthly cash flow is $571 ($7k/yr) — positive.
- The deal already cash-flows at list — no discount required.
- Meets the 1% rule at list price ($1k rent vs $48k).
- Recommended offer: $42k (12.0% below list) — sets the bar for market timing.
- Cap rate 22.2% vs local median 3.3% in Bayou Cane — top-decile yield for the area; either an underpriced asset or a hidden risk that comps aren't pricing in. Stress-test before assuming the spread holds.
Location & tenants
- Location reads 65/100 on livability (#140 in LA) — a middle-class / working-renter tenant base. Strengths: cost of living A+, housing A+, health & safety B+; Watch: schools F, crime D-, amenities F.
- Terrebonne Parish (other): math 32% / reading 46% proficiency, ranked #23 of 98 in LA (top 24%) — families likely to look elsewhere, expect single-tenant / working-renter base with shorter leases; 62% free/reduced lunch — lower-income household profile, screen leases tightly.
- Market conditions: 311 active listings in the ZIP; 10 comparable units currently listed for rent nearby; rentals lingering (median 44d on market — plan ~5-8 weeks vacancy on turnover, expect pricing pressure); 100% of comp listings sitting > 30 days — soft ceiling on asking rent; 300 units permitted in Terrebonne Parish in 2024 (0 in 5+ unit buildings).
Forward outlook
- Local home prices are declining (-3.0%/yr); year-one equity from $332 of loan paydown is wiped out by about $1k of value loss. Plan a longer hold.
- At projected returns (-3.0% appreciation + 3.0% rent growth), your $13k cash investment doubles in ~3 years — after that, you're playing with house money.
Negotiation context
- It's been on market 504 days — a 12% lower offer ($42k) is reasonable based on typical stale-listing flexibility.
- 2 sale attempts; this cycle's ask has dropped $67k (58%) from the opening price — seller is motivated, your offer sets the floor, not the list.
Risks & watch-outs
- Watch-outs: flood insurance adds $66/mo.
- Climate carrying-cost: major flood risk; severe wind risk, 99% chance of damaging wind over 30y; extreme-heat days projected 7→21/yr by 2055 (HVAC capex compounding) — expect insurance premiums to compound above CPI over the hold.
Questions for the listing agent
- It's been on market 504 days. Have you received any prior offers? Is the seller open to a 12% concession, seller financing, or rate buy-down credit?
- Have any recent inspections been done? Can we get a copy of the seller's disclosures and any deferred-maintenance estimates?
- Built in 1965 — when were the roof, HVAC, electrical panel, plumbing, and water heater last replaced?
- What's the actual annual flood-insurance premium (NFIP or private), and is the property in a SFHA with mandatory coverage?
- Why hasn't it sold? Are there any deal-killer items the seller is aware of (foundation, flood, title, zoning, code violations)?
- Is there a deadline driving the sale (1031 exchange, divorce, estate, relocation)? That informs how much negotiation room exists.
- Schools are F-rated, which usually means shorter tenancies and higher turnover. Who's the typical renter profile here, and what's been the actual vacancy rate?
- Crime grade is D in this area — have there been break-ins, vandalism, or insurance claims at this property in the last 3 years? What carrier currently insures it and at what premium?
- What's the average days-on-market for RENTAL listings here right now (not sales)? A rising rental-DOM trend means longer vacancies and softer asking-rent achievability than the comps imply.
- What's the recent tenant-quality profile in this submarket — average credit score on applications, eviction rate, late-payment / NSF rate, and stable-employment percentage? A property-management company in the area should have these aggregated.
- How much new for-sale + rental construction is in the pipeline within 1–3 miles? Heavy new supply typically softens prices + rents 12–24 months out; constrained supply supports both.
Investment metrics
- 1% rule
- 2.56% ✓
- Cap rate
- 22.22%
- Cash-on-cash
- 56.90%
- DSCR
- 3.53
- GRM
- 3.3
CMA / ARV
- ARV (median comp)
- $153,858
- List price
- $48,000
- Delta
- -68.80%
- Verdict
- UNDERPRICED
- Comps
- 20 within 1.0 mi
Show comp detail 12 sales within ~0.75 mi
| Address | Dist | Beds/Ba | Sqft | Sold | Price | $/sf | Match |
|---|---|---|---|---|---|---|---|
| 211 Prince Collins St | 0.39mi | 3/1.5 (+1) | 1,088 (-1%) | 4mo | $21,500 | $20 | 69 |
| 7323 Park Ave | 0.33mi | 2/1.0 | 1,208 (+10%) | 9mo | $69,500 | $58 | 61 |
| 127 Hackberry Ave | 0.64mi | 2/1.0 | 1,098 (-0%) | 11mo | $130,000 | $118 | 60 |
| 247 Mckinley St | 0.51mi | 2/2.0 | 1,061 (-4%) | 7mo | $145,000 | $137 | 60 |
| 635 Wilson Ave | 0.72mi | 2/2.0 | 1,095 (-0%) | 4mo | $169,000 | $154 | 59 |
| 231 J Patrick Dr | 0.30mi | 3/2.0 (+1) | 1,262 (+15%) | 1mo | $213,000 | $169 | 52 |
| 703 Duval Ave | 0.67mi | 3/1.0 (+1) | 1,145 (+4%) | 7mo | $125,000 | $109 | 51 |
| 115 Central Ave | 0.71mi | 3/1.0 (+1) | 1,112 (+1%) | 11mo | $115,000 | $103 | 51 |
| 515 Cascade Dr | 0.71mi | 3/2.0 (+1) | 1,087 (-1%) | 7mo | $183,400 | $169 | 50 |
| 217 Cascade Dr | 0.69mi | 3/2.0 (+1) | 1,031 (-6%) | 9mo | $175,000 | $170 | 41 |
| 531 Beaumont Dr | 0.74mi | 3/1.0 (+1) | 1,168 (+6%) | 11mo | $45,000 | $39 | 41 |
| 414 Highland Dr | 0.47mi | 3/2.0 (+1) | 1,248 (+14%) | 9mo | $155,000 | $124 | 39 |
Match score weights: distance 35% · size 25% · config 20% · recency 20%. Top-matched comps best support the ARV.
Projected returns pro-forma
-3.0% appreciation · 3.0% rent growth · sell at horizon
- IRR
- 48.8%
- Equity multiple
- 3.13×
- Total profit
- $28,636
- Equity at exit
- $7,157
- IRR
- 54.4%
- Equity multiple
- 6.36×
- Total profit
- $71,990
- Equity at exit
- $4,150
Cash invested: $13,440 (down + closing). Projections, not guarantees.
Landlord ↔ Tenant lean methodology
- Overall (STATE)
- 90 Strongly Landlord-Friendly
- State Louisiana
- 90 Strongly Landlord-Friendly · R+12
- County
- — inherits STATE
- City
- — inherits STATE
ZIP-level market 70364
- Active inventory
- 311
- Price-to-rent
- 3.3×
Monthly cashflow live
- Estimated rent
- $1,227 high interval (Pro) →
- Mortgage (P&I)
- −$252
- Tax est. 1.5%
- −$60 /mo · $720/yr
- Insurance
- −$20
- Flood insurance flood zone
- −$66 /mo · $798/yr
- HOA
- −$0
- Vacancy / Maint / Mgmt
- −$258
- Net cashflow
- $571
Break-even live
UW: 25.0% down · 7.5% · 30yr · 1.5% tax · 5.0% vac · 8.0% maint · 8.0% mgmt
Financing live
Cash to close
- Down payment
- $12,000
- Closing costs
- $1,440
- Reserves months
- —
- Total cash needed
- —
Loan-product check · same deal, 3 products live
Conventional
25% down · 7.5% · 30yr
- Down + closing
- —
- Monthly P&I
- —
- Monthly cashflow
- —
- DSCR
- —
- Eligible?
- —
Personal DTI + credit; lowest rate.
DSCR
20% down · 8.5% · 30yr
- Down + closing
- —
- Monthly P&I
- —
- Monthly cashflow
- —
- DSCR
- —
- Eligible?
- —
No personal income docs; deal must DSCR.
Hard money
10% down · 12.0% · 12mo
- Down + closing
- —
- Monthly P&I
- —
- Monthly cashflow
- —
- DSCR
- —
- Eligible?
- —
Short-term bridge; refi at stabilization.
Rent comps 10 comps
| Address | Beds | Baths | Sqft | Rent | $/sqft | DOM | Units | Dist |
|---|---|---|---|---|---|---|---|---|
| 208 Monarch Dr Unit 103-A Houma, LA | 2.0 | 1.0 | 775 | $1,000 | $1.29 | 43d | 1 | 0.40mi |
| 110 Marcel Ln Unit A Houma, LA | 2.0 | 1.0 | 908 | $1,350 | $1.49 | 43d | 1 | 0.53mi |
| 108 Marcel Ln Unit B Houma, LA | 2.0 | 1.0 | 908 | $1,350 | $1.49 | 43d | 1 | 0.58mi |
| 735 A School St Unit A Houma, LA | 3.0 | 2.0 | 1450 | $1,600 | $1.10 | 43d | 1 | 1.18mi |
| 624 Gabasse St Unit 1 Houma, LA | 1.0 | 1.0 | 750 | $975 | $1.30 | 43d | 1 | 1.26mi |
| 179 Garnet St Unit B Houma, LA | 3.0 | 1.0 | 1100 | $1,200 | $1.09 | 43d | 1 | 1.28mi |
| 1140 Church St Unit B Houma, LA | 2.0 | 1.0 | 1000 | $1,150 | $1.15 | 43d | 1 | 1.29mi |
| 100 Belmere Luxury Ct Houma, LA | 1.0–3.0 | 1.0–2.0 | 1076 | $1,455 | $1.35 | 43d | 27 | 1.32mi |
| 885 High St Houma, LA | 2.0 | 1.0 | 801 | $1,100 | $1.37 | 43d | 1 | 1.45mi |
| 400 Westside Blvd Houma, LA | 2.0–3.0 | 1.0–1.5 | 906 | $995 | $1.10 | 43d | 5 | 1.47mi |
Listing history 21 events
-
2026-06-19days on market $48,000 Active 504 DOM
-
2026-06-18days on market $48,000 Active 503 DOM
-
2026-06-17days on market $48,000 Active 502 DOM
-
2026-06-16days on market $48,000 Active 501 DOM
-
2026-06-15days on market $48,000 Active 500 DOM
-
2026-06-14days on market $48,000 Active 498 DOM
-
2026-06-13days on market $48,000 Active 497 DOM
-
2026-06-10days on market $48,000 Active 495 DOM
-
2026-06-09days on market $48,000 Active 494 DOM
-
2026-06-08days on market $48,000 Active 493 DOM
-
2026-06-07days on market $48,000 Active 492 DOM
-
2026-06-05days on market $48,000 Active 489 DOM
-
2026-06-03days on market $48,000 Active 488 DOM
-
2026-06-02days on market $48,000 Active 487 DOM
-
2026-06-01days on market $48,000 Active 486 DOM
-
2026-05-31days on market $48,000 Active 485 DOM
-
2026-05-30days on market $48,000 Active 484 DOM
-
2025-07-01price $48,000 157-char remark
Show marketing remark (157 chars)
Calling all investors!! This tenant occupied single family unit makes a perfect addition to your portfolio. Don't wait, schedule your private showing today!!
-
2025-06-30price $48,000 163-char remark
Show marketing remark (163 chars)
Calling all investors!! This tenant occupied single family unit makes a perfect addition to your portfolio. Don’t wait, schedule your private showing today!!
-
2025-01-31$115,000 Active 157-char remark
Show marketing remark (163 chars)
Calling all investors!! This tenant occupied single family unit makes a perfect addition to your portfolio. Don’t wait, schedule your private showing today!!
-
2025-01-31$115,000 Active 163-char remark
Show marketing remark (163 chars)
Calling all investors!! This tenant occupied single family unit makes a perfect addition to your portfolio. Don’t wait, schedule your private showing today!!
ⓘ Source: listings_history table (triggers on properties + properties_extension) + one-shot
backfill from property_details.listing_events for pre-trigger history.
Climate risk First Street
- Flood 7/10 Severe FEMA zone X (shaded) · 58% chance over 30 yrs
- Wildfire 1/10 Low
- Heat 9/10 Extreme 7 d/yr ≥107°F today · 21 d/yr by 30 yrs out
- Wind 9/10 Extreme 99% chance of damaging wind over 30 yrs
- Air quality 1/10 Low 0 unhealthy d/yr today · 0 by 30 yrs out
Nearby sold comps map
Loading sold comps map…
Walkable amenities ~0.75 mi
Loading nearby amenities…
Taxation est. · year 1
- Rental income
- $14,719
- − Mortgage interest
- −$2,689
- − Property taxes
- −$720
- − Insurance
- −$1,038
- − Repairs & maintenance
- −$1,177
- − Management
- −$1,177
- − Depreciation
- −$1,396
- Taxable income
- $6,521
- Est. tax owed @ 24.0%
- −$1,565
- After-tax cash flow
- $5,285/yr
For passive investors: Depreciation is non-cash, so a rental often shows a tax loss while cash-flowing — sheltering income. Rental losses are passive: they offset passive income freely, and up to $25,000/yr can offset ordinary (W-2) income if you actively participate and your MAGI is under $100k (phasing out to $0 by $150k); unused losses carry forward. On sale, claimed depreciation is recaptured at up to 25%, and gains may owe capital-gains tax (a 1031 exchange can defer both). Figures are a year-1 estimate at your 24.0% rate — not tax advice; consult a CPA.
Condition & rehab AI · 8 photos
This property requires extensive repairs and updates to be move-in ready. Significant investment is needed to address the roof, exterior, windows, flooring, and interior walls.
Repairs flagged
- Major roof — Severe damage to the roof
- Major exterior siding — Severe peeling and damage
- Major windows — Damaged and possibly non-functional
- Major flooring — Damaged and uneven
- Major interior walls/paint — Peeling and damaged
Value-add opportunities
- Both Replace roof — Critical to safety and appearance
- Both Repair and paint exterior — Improves curb appeal and safety
- Both Replace damaged flooring — Enhances safety and appearance
- Both Replace damaged windows — Improves safety and energy efficiency
- Both Replace kitchen cabinets and countertops — Enhances functionality and appearance
Renovation cost estimate screening
| Repair item | Severity | Est. cost |
|---|---|---|
| roof · Severe damage to the roof | Major | $15,000–50,000 |
| exterior siding · Severe peeling and damage | Major | $15,000–50,000 |
| windows · Damaged and possibly non-functional | Major | $15,000–50,000 |
| flooring · Damaged and uneven | Major | $15,000–50,000 |
| interior walls/paint · Peeling and damaged | Major | $15,000–50,000 |
| Total estimated repair cost · 5 items | $75,000–250,000 |
Value-add ROI direction
- Both Replace roof — Critical to safety and appearance ↑
- Both Repair and paint exterior — Improves curb appeal and safety ↑
- Both Replace damaged flooring — Enhances safety and appearance ↑
- Both Replace damaged windows — Improves safety and energy efficiency ↑
- Both Replace kitchen cabinets and countertops — Enhances functionality and appearance ↑
ⓘ Cost ranges are severity-bucket heuristics (US national rule-of-thumb). Get contractor quotes + a written scope before underwriting a rehab budget.
Schools (NCES district)
- District
- Terrebonne Parish
- NCES district ID
- 2201740
- Math proficiency
- 32% ▼ -36.00%
- Reading proficiency
- 46% ▼ -30.00%
- Median HH income
- $47,612
- Composite
- 33.38/100
- National rank
- #5480
- State rank
- #23 of 98 in LA
Livability — Bayou Cane
- Score
- 65/100
- State rank
- #140
- US rank
- #12522
Category grades
Schools grade is shown separately in the Schools card above.
Census & demographics
- Census place
- Bayou Cane, LA
- County
- Terrebonne Parish · 57,290 people
- Metro
- Houma-Thibodaux, LA
- Population (ZIP)
- 28,716
- Household income
- $68,843
- Rent vs Own
- Severe rent burden
- 387.0
Population outlook (Terrebonne County) Hauer SSP2
- Today (2025)
- 118,724 people
- By 2030
- 120,321 · +1.3%
- By 2040
- 121,894 · +2.7%
- By 2050
- 121,119 · +2.0%
- By 2075
- 117,270 · -1.2%
- By 2100
- 107,544 · -9.4%
Race, ethnicity, and origin ACS 2023
- Neighborhood character
- Majority White (65%)
- Race & ethnicity
- White 65% Black 16% Hispanic / Latino 9% Two or more races 9% Native American 7% Asian 1%
- Hispanic origin (detail)
- Mexican 7% Puerto Rican 1%
- Common ancestry
- Lithuanian 17% Slovak 1% Serbian 1%
- Foreign-born
- 3% · Canada, Vietnam
- Languages at home
- 92% English-only · Spanish 4% French/Haitian/Cajun 2% Other Indo-European 1%
Political lean MEDSL · Terrebonne
- 2024 margin
- Solid R (+51.8) · D 23.5% · R 75.3% · Other 1.2%
- 2008→2024 swing
- -11.0pp toward R · 2008: -40.9pp · 2024: -51.8pp
- All cycles
- 2024: R+51.8 2020: R+50.0 2016: R+48.4 2012: R+41.2 2008: R+40.9
Not yet ingested
- Civics
- —
Market trends
- HPI YoY
- ▼ -99.75%
- Current HPI
- 113.1047
- Rent YoY
- —
- Metro
- Houma-Thibodaux, LA
- State GDP YoY
- ▲ 3.29%
- F500 in state
- 10
Industry mix (Fortune 500 HQ in LA)
| Industry | F500 HQs | Revenue |
|---|---|---|
| Telecommunications | 2 | $23B |
|
||
| Utilities | 1 | $12B |
|
||
| Wholesale / Distribution | 1 | $5B |
|
||
| Advertising | 1 | $2B |
|
||
Price history
-58.3% since first listed4 events — show timeline
- 2025-07-01 Price Changed $48,000 AcadianaMLS
- 2025-06-30 Price Changed $48,000 GBRMLS
- 2025-01-31 Listed $115,000 GBRMLS
- 2025-01-31 Listed $115,000 AcadianaMLS
Cash-flow waterfall
monthlySold comps — $/sqft
last 12 mo · ≤1 miLoading sold comps…