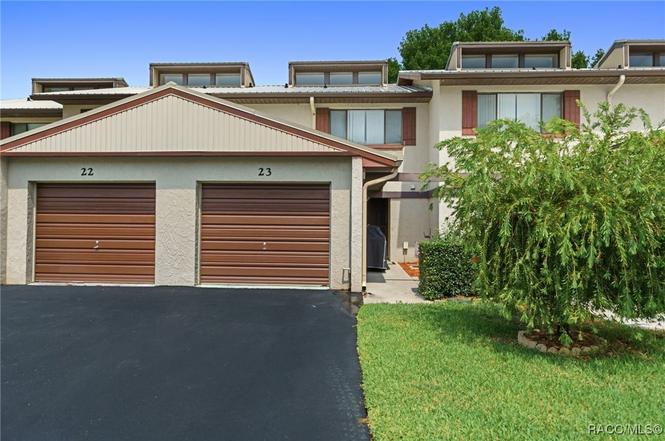
49 Douglas St #23 · Sugarmill Woods, FL
Flood risk 6/10 · Moderate
- FEMA flood zone
- X (unshaded)
- Chance of flooding over 30 yrs
- 0.59%
- Est. flood insurance / yr
- $507 – $1,088
Fire risk 4/10 · Minor
- Est. fire insurance / yr
- $947 – $1,759
Heat risk 9/10 · Severe
- Hot days now (above 108°F)
- 7 days/yr
- Hot days in 30 yrs
- 25 days/yr
Wind risk 9/10 · Severe
- Chance of severe wind over 30 yrs
- 99.0%
Air-quality risk 1/10 · Minimal
- Unhealthy air days now
- 0 days/yr
- Unhealthy air days in 30 yrs
- 0 days/yr
Risk factors via First Street. Map © Google.
Why this score? — see what drove the D- grade
The composite is a weighted blend of 9 inputs, each scored 0–100. Each bar is that input's sub-score; the figure is the points it added to the 100-point composite (weight × sub-score).
- Cash flow +11.4/30.0
- ARV discount +7.5/15.0
- 1% rule +5.6/10.0
- Schools +4.1/10.0
- DSCR +3.3/10.0
- Livability +3.0/5.0
- Rent growth +2.5/5.0
- Condition / age +2.5/5.0
- Appreciation +0.0/10.0
$175,000
🖨 Deal sheet 📄 Offer letter ✓ Due diligence
Listing remarks
Completely Remodeled Townhouse in Sugarmill Woods. Welcome to this beautifully updated two-story townhouse located in the heart of desirable Sugarmill Woods. This move-in-ready home has been completely remodeled from top to bottom and offers the perfect blend of style, comfort, and low-maintenance living. The main level features a spacious living room that opens seamlessly to the Florida room, creating a bright and open space ideal for relaxing or entertaining. The brand-new kitchen shines with stainless steel appliances, granite countertops, modern lighting, and classic shaker-style cabinetry. New vinyl plank flooring runs throughout the home, with plush new carpet in the upstairs bedrooms
Key facts
- Florida room
- Brand-new kitchen
- Granite countertops
Tags
Property features AI
Finance
- Other: Subdivision: Sugarmill Woods - Cypress Village
- Financial info: Tax information not included per instructions
- HOA & community: Homeowners association present; Annual association fee of $132; Monthly association fee of $300 (derived monthly $11 shown); Association covers cable TV, grounds maintenance, structure maintenance, security, and trash; Community amenities include clubhouse, golf, restaurant, and tennis courts
Exterior
- Parking: Attached garage; Concrete driveway; 1 total parking space; 1-car garage
- Security: Community security included with association
- Utilities: Public water; Public sewer
- Home design: Townhouse (residential condominium); Facing information not provided
- Construction: Stucco construction; Metal roof; Block foundation; Built as a condominium
- Exterior features: Cleared lot; Paved road access; No pool
Interior
- Kitchen: Dishwasher; Electric oven; Microwave; Refrigerator; Stone counters
- Bedrooms: Walk-in closet(s)
- Flooring: Carpet
- Bathrooms: 2 full bathrooms; 1 half bathroom
- Heating & cooling: Central heating (electric); Central air conditioning
- Interior features: Open floorplan; Stone counters; Walk-in closet(s); Skylight(s); Blinds and window treatments
- Laundry & utility: Laundry area located in the garage; Water heater
Neighborhood map
What this means for you Summary
Snapshot
- This is a 2-bed/2.5-bath condo listed at $175k.
Deal economics
- At list price, monthly cash flow is $-61 ($-731/yr) — negative.
- To cash-flow at today's rent, offer at most $166k (5.0% below list).
- Meets the 1% rule at list price ($2k rent vs $175k).
- Recommended offer: $154k (12.0% below list) — sets the bar for market timing.
- Cap rate 5.9% vs local median 4.0% in Sugarmill Woods — top-decile yield for the area; either an underpriced asset or a hidden risk that comps aren't pricing in. Stress-test before assuming the spread holds.
Location & tenants
- Location reads 59/100 on livability (#825 in FL) — a working-class tenant base; expect higher turnover. Strengths: cost of living A+, housing A+, crime B+; Watch: health & safety C-, amenities F, commute F.
- Citrus (rural): math 49% / reading 50% proficiency, ranked #44 of 73 in FL (top 60%) — families likely to look elsewhere, expect single-tenant / working-renter base with shorter leases.
- Zoned schools: Lecanto Primary School (math 55% / reading 53%, grade C, #936 of 2,144 statewide, top 44%, 820 students, 63% FRL); Lecanto Middle School (math 49% / reading 49%, grade C-, #265 of 571 statewide, top 48%, 809 students, 55% FRL); Lecanto High School (math 46% / reading 53%, grade D, #179 of 667 statewide, top 29%, 1,630 students, 46% FRL) — zoned schools at 54% FRL track the district average.
- Market conditions: 582 active listings in the ZIP; 8 comparable units currently listed for rent nearby; rentals at typical pace (median 21d on market — plan ~3-4 weeks tenant-placement turnaround); 2,443 units permitted in Citrus County in 2024 (0 in 5+ unit buildings).
- This rent runs 38% of the median local income ($59k/yr) — at the standard rent-burdened threshold; future hikes will face affordability resistance.
Forward outlook
- Local home prices are declining (-3.0%/yr); year-one equity from $1k of loan paydown is wiped out by about $5k of value loss. Plan a longer hold.
- Citrus County population projected to shrink 10% by 2050 — rents likely to lag national; underwrite the cash flow, not the appreciation.
Negotiation context
- It's been on market 155 days — a 12% lower offer ($154k) is reasonable based on typical stale-listing flexibility.
Risks & watch-outs
- Climate carrying-cost: major flood risk; severe wind risk, 99% chance of damaging wind over 30y; extreme-heat days projected 7→25/yr by 2055 (HVAC capex compounding) — expect insurance premiums to compound above CPI over the hold.
Questions for the listing agent
- What do current leases actually rent for vs. the listed asking? Can we see a recent rent roll and the last 12 months of T-12 income?
- It's been on market 155 days. Have you received any prior offers? Is the seller open to a 12% concession, seller financing, or rate buy-down credit?
- What does the HOA fee cover, when was the last increase, and are there any pending special assessments or reserve-fund shortfalls?
- Any open or pending special assessments — roof, HVAC, plumbing, elevator, façade? What's the per-unit balance and payoff schedule, and is the seller paying it off at close or rolling it to the buyer?
- Why hasn't it sold? Are there any deal-killer items the seller is aware of (foundation, flood, title, zoning, code violations)?
- Is there a deadline driving the sale (1031 exchange, divorce, estate, relocation)? That informs how much negotiation room exists.
- Schools are F-rated, which usually means shorter tenancies and higher turnover. Who's the typical renter profile here, and what's been the actual vacancy rate?
- The area grade is low — what's the realistic commute time and amenity access for the typical tenant pool here? Any planned neighborhood developments (good or bad) we should know about?
- What's the average days-on-market for RENTAL listings here right now (not sales)? A rising rental-DOM trend means longer vacancies and softer asking-rent achievability than the comps imply.
- What's the recent tenant-quality profile in this submarket — average credit score on applications, eviction rate, late-payment / NSF rate, and stable-employment percentage? A property-management company in the area should have these aggregated.
- How much new apartment / multifamily construction is in the pipeline within 1–3 miles? Heavy new supply (>2% of stock underway) typically softens rents 12–24 months out; light construction supports rent growth.
Investment metrics
- 1% rule
- 1.06% ✓
- Cap rate
- 5.88%
- Cash-on-cash
- -1.49%
- DSCR
- 0.93
- GRM
- 7.9
CMA / ARV
No comps found within radius.
Projected returns pro-forma
-3.0% appreciation · 3.0% rent growth · sell at horizon
- IRR
- -18.6%
- Equity multiple
- 0.35×
- Total profit
- $-32,016
- Equity at exit
- $26,093
- IRR
- -10.7%
- Equity multiple
- 0.35×
- Total profit
- $-31,983
- Equity at exit
- $15,131
Cash invested: $49,000 (down + closing). Projections, not guarantees.
Landlord ↔ Tenant lean methodology
- Overall (STATE)
- 87 Strongly Landlord-Friendly
- State Florida
- 87 Strongly Landlord-Friendly · R+3
- County
- — inherits STATE
- City
- — inherits STATE
ZIP-level market 34446
- Home prices YoY
- -10.4%
- Active inventory
- 582
- Price-to-rent
- 7.9×
Monthly cashflow live
- Estimated rent
- $1,847 high interval (Pro) →
- Mortgage (P&I)
- −$918
- Tax est. 1.5%
- −$219 /mo · $2,625/yr
- Insurance
- −$73
- HOA
- −$311
- Vacancy / Maint / Mgmt
- −$388
- Net cashflow
- $-61
Break-even live
UW: 25.0% down · 7.5% · 30yr · 1.5% tax · 5.0% vac · 8.0% maint · 8.0% mgmt
Financing live
Cash to close
- Down payment
- $43,750
- Closing costs
- $5,250
- Reserves months
- —
- Total cash needed
- —
Loan-product check · same deal, 3 products live
Conventional
25% down · 7.5% · 30yr
- Down + closing
- —
- Monthly P&I
- —
- Monthly cashflow
- —
- DSCR
- —
- Eligible?
- —
Personal DTI + credit; lowest rate.
DSCR
20% down · 8.5% · 30yr
- Down + closing
- —
- Monthly P&I
- —
- Monthly cashflow
- —
- DSCR
- —
- Eligible?
- —
No personal income docs; deal must DSCR.
Hard money
10% down · 12.0% · 12mo
- Down + closing
- —
- Monthly P&I
- —
- Monthly cashflow
- —
- DSCR
- —
- Eligible?
- —
Short-term bridge; refi at stabilization.
Rent comps 8 comps
| Address | Beds | Baths | Sqft | Rent | $/sqft | DOM | Units | Dist |
|---|---|---|---|---|---|---|---|---|
| 117 Golfview Dr Homosassa, FL | 2.0 | 2.0 | 1507 | $2,000 | $1.33 | 21d | 1 | 0.15mi |
| 23 Dogwood Dr Homosassa, FL | 2.0 | 2.0 | 1492 | $2,200 | $1.47 | 21d | 1 | 0.29mi |
| 17 Dogwood Dr Homosassa, FL | 2.0 | 2.0 | 1400 | $1,600 | $1.14 | 21d | 1 | 0.30mi |
| 51 Golfview Ct Homosassa, FL | 2.0 | 2.0 | 1553 | $1,900 | $1.22 | 21d | 1 | 0.36mi |
| 17 Jamaica St Homosassa, FL | 2.0 | 2.0 | 1100 | $1,500 | $1.36 | 21d | 1 | 0.42mi |
| 5 Jamaica St Homosassa, FL | 2.0 | 2.0 | 1353 | $1,500 | $1.11 | 21d | 1 | 0.45mi |
| 5 Black Cherry Dr Homosassa, FL | 2.0 | 2.0 | 1140 | $1,600 | $1.40 | 21d | 1 | 0.48mi |
| 57 Chinaberry Cir Homosassa, FL | 2.0 | 2.0 | 1132 | $1,575 | $1.39 | 21d | 1 | 0.54mi |
HOA detail condo
- Monthly dues
- $311 · $3,732/yr
- Assessments
- None detected in remarks — confirm with the listing agent.
Listing history 16 events
-
2026-06-19days on market $175,000 Active 155 DOM
-
2026-06-18days on market $175,000 Active 154 DOM
-
2026-06-17days on market $175,000 Active 153 DOM
-
2026-06-16days on market $175,000 Active 152 DOM
-
2026-06-15days on market $175,000 Active 151 DOM
-
2026-06-14days on market $175,000 Active 149 DOM
-
2026-06-13days on market $175,000 Active 148 DOM
-
2026-06-09days on market $175,000 Active 145 DOM
-
2026-06-08days on market $175,000 Active 144 DOM
-
2026-06-03days on market $175,000 Active 139 DOM
-
2026-06-02days on market $175,000 Active 138 DOM
-
2026-06-01days on market $175,000 Active 137 DOM
-
2026-05-31days on market $175,000 Active 136 DOM
-
2026-05-30days on market $175,000 Active 135 DOM
-
2026-04-28price $175,000
-
2026-01-15$185,000 Active
ⓘ Source: listings_history table (triggers on properties + properties_extension) + one-shot
backfill from property_details.listing_events for pre-trigger history.
Climate risk First Street
- Flood 6/10 Major FEMA zone X (unshaded) · 59% chance over 30 yrs
- Wildfire 4/10 Moderate
- Heat 9/10 Extreme 7 d/yr ≥108°F today · 25 d/yr by 30 yrs out
- Wind 9/10 Extreme 99% chance of damaging wind over 30 yrs
- Air quality 1/10 Low 0 unhealthy d/yr today · 0 by 30 yrs out
Nearby sold comps map
Loading sold comps map…
Walkable amenities ~0.75 mi
Loading nearby amenities…
Taxation est. · year 1
- Rental income
- $22,170
- − Mortgage interest
- −$9,803
- − Property taxes
- −$2,625
- − Insurance
- −$875
- − Repairs & maintenance
- −$1,774
- − Management
- −$1,774
- − HOA
- −$3,732
- − Depreciation
- −$5,091
- Taxable loss
- −$3,503
- Est. tax savings @ 24.0%
- +$841
- After-tax cash flow
- $110/yr
For passive investors: Depreciation is non-cash, so a rental often shows a tax loss while cash-flowing — sheltering income. Rental losses are passive: they offset passive income freely, and up to $25,000/yr can offset ordinary (W-2) income if you actively participate and your MAGI is under $100k (phasing out to $0 by $150k); unused losses carry forward. On sale, claimed depreciation is recaptured at up to 25%, and gains may owe capital-gains tax (a 1031 exchange can defer both). Figures are a year-1 estimate at your 24.0% rate — not tax advice; consult a CPA.
Schools (NCES district)
- District
- Citrus
- NCES district ID
- 1200270
- Math proficiency
- 49% ▼ -10.00%
- Reading proficiency
- 50% ▼ -6.00%
- Median HH income
- $38,618
- Composite
- 41.28/100
- National rank
- #3519
- State rank
- #44 of 73 in FL
Livability — Sugarmill Woods
- Score
- 59/100
- State rank
- #825
- US rank
- #20184
Category grades
Schools grade is shown separately in the Schools card above.
Census & demographics
- Census place
- Sugarmill Woods, FL
- County
- Citrus County · 111,314 people
- City population
- 18,797
- Metro
- Homosassa Springs, FL
- Population (ZIP)
- 19,102
- Household income
- $58,802
- Rent vs Own
- Severe rent burden
- 121.0
Population outlook (Citrus County) Hauer SSP2
- Today (2025)
- 138,622 people
- By 2030
- 136,886 · -1.3%
- By 2040
- 132,009 · -4.8%
- By 2050
- 125,196 · -9.7%
- By 2075
- 108,570 · -21.7%
- By 2100
- 84,454 · -39.1%
Race, ethnicity, and origin ACS 2023
- Neighborhood character
- Predominantly White (87%)
- Race & ethnicity
- White 87% Two or more races 8% Hispanic / Latino 6%
- Hispanic origin (detail)
- Mexican 2% Puerto Rican 3%
- Common ancestry
- Romanian 4% Lithuanian 4% Slovak 3%
- Foreign-born
- 5% · Canada
- Languages at home
- 95% English-only · Spanish 4%
Political lean MEDSL · Citrus
- 2024 margin
- Solid R (+45.9) · D 26.8% · R 72.6%
- 2008→2024 swing
- -29.8pp toward R · 2008: -16.1pp · 2024: -45.9pp
- All cycles
- 2024: R+45.9 2020: R+41.0 2016: R+39.7 2012: R+21.9 2008: R+16.1
Not yet ingested
- Civics
- —
Market trends
- HPI YoY
- ▼ -32.11%
- Current HPI
- 277.2576
- Rent YoY
- —
- Metro
- Homosassa Springs, FL
- State GDP YoY
- ▲ 3.28%
- F500 in state
- 36
Industry mix (Fortune 500 HQ in FL)
| Industry | F500 HQs | Revenue |
|---|---|---|
| Industrial Technology | 2 | $29B |
|
||
| Insurance | 2 | $17B |
|
||
| Retail | 1 | $60B |
|
||
| Technology Distribution | 1 | $58B |
|
||
| Homebuilding | 1 | $35B |
|
||
| Technology Manufacturing | 1 | $35B |
|
||
Price history
-5.4% since first listed2 events — show timeline
- 2026-04-28 Price Changed $175,000 RACC
- 2026-01-15 Listed $185,000 RACC
Cash-flow waterfall
monthlySold comps — $/sqft
last 12 mo · ≤1 miLoading sold comps…