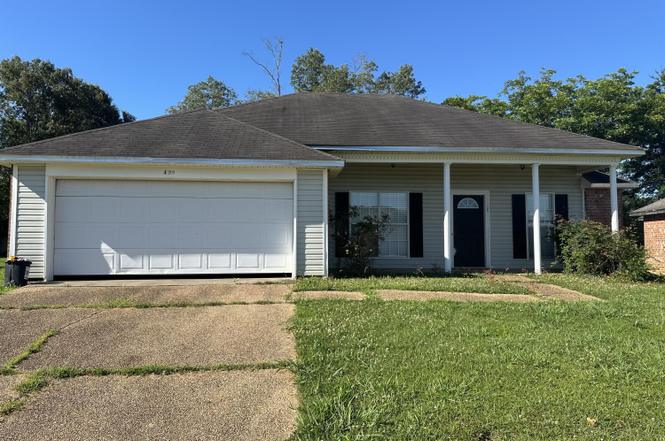
120 Nicholson Dr Unit (lot 11) · Terry, MS
Flood risk 1/10 · Minimal
- FEMA flood zone
- X (unshaded)
- Chance of flooding over 30 yrs
- 0.0%
- Est. flood insurance / yr
- $507 – $1,088
Fire risk 5/10 · Moderate
- Est. fire insurance / yr
- $1,241 – $2,305
Heat risk 7/10 · Major
- Hot days now (above 108°F)
- 7 days/yr
- Hot days in 30 yrs
- 21 days/yr
Wind risk 8/10 · Major
- Chance of severe wind over 30 yrs
- 80.0%
Air-quality risk 1/10 · Minimal
- Unhealthy air days now
- 0 days/yr
- Unhealthy air days in 30 yrs
- 0 days/yr
Risk factors via First Street. Map © Google.
Why this score? — see what drove the B- grade
The composite is a weighted blend of 9 inputs, each scored 0–100. Each bar is that input's sub-score; the figure is the points it added to the 100-point composite (weight × sub-score).
- Cash flow +25.9/30.0
- ARV discount +15.0/15.0
- DSCR +8.7/10.0
- 1% rule +6.9/10.0
- Livability +3.2/5.0
- Rent growth +2.5/5.0
- Condition / age +2.5/5.0
- Schools +2.4/10.0
- Appreciation +0.0/10.0
$140,000
🖨 Deal sheet (PDF) 📄 Offer letter ✓ Due diligence
Listing remarks MLS
Newest subdivision in Terry! 3 bedrooms,2 full baths and 2 car garage. Buy now and select colors.
Key facts
- 0.23 acre lot
- 2 garage spots
- Built 2007
Property features AI
Finance
- Other: Property listed as fixer; Living area recorded by appraiser
Exterior
- Parking: Attached 2-car garage; Driveway with concrete surface
- Security: Deadbolt locks
- Utilities: Public water; Public sewer; Cable available; Electricity connected; Water connected; Sewer connected
- Home design: Single-family residence (house); One level
- Construction: Brick construction; Asphalt shingle roof; Slab foundation; Built (year source: public records)
- Exterior features: Private yard; Storage structure
Interior
- Kitchen: Dishwasher; Electric cooktop; Refrigerator; Disposal; Exhaust fan
- Bathrooms: 2 full bathrooms
- Heating & cooling: Central heating; Ceiling fans; Wall/window air conditioning units
- Interior features: Dishwasher; Disposal; Electric cooktop; Exhaust fan; Refrigerator; Gas log fireplace in the living room; Deadbolt locks
Neighborhood map
What this means for you Summary
Snapshot
- This is a 3-bed/2.0-bath single-family listed at $140k.
Deal economics
- At list price, monthly cash flow is $343 ($4k/yr) — positive.
- The deal already cash-flows at list — no discount required.
- Meets the 1% rule at list price ($2k rent vs $140k).
Location & tenants
- Location reads 63/100 on livability (#159 in MS) — a middle-class / working-renter tenant base. Strengths: crime A+, cost of living A+, housing A+; Watch: employment D+, amenities F, commute F.
- Hinds County School District (rural): math 25% / reading 29% proficiency, ranked #70 of 130 in MS (top 54%) — low school quality limits family demand, transient renter base, plan for 1-2y turnover; 64% free/reduced lunch — lower-income household profile, screen leases tightly.
- Zoned schools: Gary Road Elementary (672 students, 100% FRL); Byram Middle School (math 29% / reading 29%, grade F, #90 of 179 statewide, top 52%, 772 students, 100% FRL); Terry High School (math 13% / reading 30%, grade F, #128 of 197 statewide, top 65%, 1,098 students, 100% FRL) — zoned schools average 100% FRL vs 64% district-wide (36 pts higher); higher-poverty schools than district average — tighter screening recommended.
- Market conditions: 64 active listings in the ZIP; 167 units permitted in Hinds County in 2024 (0 in 5+ unit buildings).
Forward outlook
- Local home prices are declining (-3.0%/yr); year-one equity from $968 of loan paydown is wiped out by about $4k of value loss. Plan a longer hold.
- Hinds County population projected to shrink 6% by 2050 — rents likely to lag national; underwrite the cash flow, not the appreciation.
Negotiation context
- Only 3 days on market — expect competitive offers; lowballing is unlikely to land.
- 2 sale attempts since 20y ago with the ask held roughly flat each time — persistent listings suggest the price (not the market) is what's stuck; bring a comps-based counter.
Risks & watch-outs
- Climate carrying-cost: severe wind risk, 80% chance of damaging wind over 30y; moderate wildfire risk; extreme-heat days projected 7→21/yr by 2055 (HVAC capex compounding) — expect insurance premiums to compound above CPI over the hold.
Questions for the listing agent
- Is there a deadline driving the sale (1031 exchange, divorce, estate, relocation)? That informs how much negotiation room exists.
- Schools are F-rated, which usually means shorter tenancies and higher turnover. Who's the typical renter profile here, and what's been the actual vacancy rate?
- What's the average days-on-market for RENTAL listings here right now (not sales)? A rising rental-DOM trend means longer vacancies and softer asking-rent achievability than the comps imply.
- What's the recent tenant-quality profile in this submarket — average credit score on applications, eviction rate, late-payment / NSF rate, and stable-employment percentage? A property-management company in the area should have these aggregated.
- How much new for-sale + rental construction is in the pipeline within 1–3 miles? Heavy new supply typically softens prices + rents 12–24 months out; constrained supply supports both.
Investment metrics
- 1% rule
- 1.19% ✓
- Cap rate
- 9.24%
- Cash-on-cash
- 10.51%
- DSCR
- 1.47
- GRM
- 7.0
CMA / ARV
- ARV (on-the-fly)
- $201,708
- Comps found
- 2
Show comp detail 2 sales within ~0.75 mi
| Address | Dist | Beds/Ba | Sqft | Sold | Price | $/sf | Match |
|---|---|---|---|---|---|---|---|
| 111 Cedarstone Dr | 0.16mi | 3/2.0 | 1,311 (+1%) | 15mo | $205,000 | $156 | 78 |
| 119 Cedarstone Dr | 0.15mi | 3/2.0 | 1,484 (+15%) | 10mo | $225,000 | $152 | 60 |
Match score weights: distance 35% · size 25% · config 20% · recency 20%. Top-matched comps best support the ARV.
Projected returns pro-forma
-3.0% appreciation · 3.0% rent growth · sell at horizon
- IRR
- -0.5%
- Equity multiple
- 0.98×
- Total profit
- $-796
- Equity at exit
- $20,874
- IRR
- 9.2%
- Equity multiple
- 1.70×
- Total profit
- $27,564
- Equity at exit
- $12,105
Cash invested: $39,200 (down + closing). Projections, not guarantees.
Landlord ↔ Tenant lean methodology
- Overall (STATE)
- 90 Strongly Landlord-Friendly
- State Mississippi
- 90 Strongly Landlord-Friendly · R+11
- County
- — inherits STATE
- City
- — inherits STATE
ZIP-level market 39170
- Home prices YoY
- -10.8%
- Active inventory
- 64
- Price-to-rent
- 7.0×
Monthly cashflow live
- Estimated rent
- $1,659 medium interval (Pro) →
- Mortgage (P&I)
- −$734
- Tax est. 1.5%
- −$175 /mo · $2,100/yr
- Insurance
- −$58
- HOA
- −$0
- Vacancy / Maint / Mgmt
- −$348
- Net cashflow
- $343
Break-even live
Sensitivity live
| Price | -10% $440 | -5% $392 | +0% $343 | +5% $295 | +10% $247 |
|---|---|---|---|---|---|
| Rent | -10% $212 | -5% $278 | +0% $343 | +5% $409 | +10% $474 |
| Rate | -1.0pp $414 | -0.5pp $379 | base $343 | +0.5pp $307 | +1.0pp $270 |
UW: 25.0% down · 7.5% · 30yr · 1.5% tax · 5.0% vac · 8.0% maint · 8.0% mgmt
Financing live
Cash to close
- Down payment
- $35,000
- Closing costs
- $4,200
- Reserves months
- —
- Total cash needed
- —
Loan-product check · same deal, 3 products live
Conventional
25% down · 7.5% · 30yr
- Down + closing
- —
- Monthly P&I
- —
- Monthly cashflow
- —
- DSCR
- —
- Eligible?
- —
Personal DTI + credit; lowest rate.
DSCR
20% down · 8.5% · 30yr
- Down + closing
- —
- Monthly P&I
- —
- Monthly cashflow
- —
- DSCR
- —
- Eligible?
- —
No personal income docs; deal must DSCR.
Hard money
10% down · 12.0% · 12mo
- Down + closing
- —
- Monthly P&I
- —
- Monthly cashflow
- —
- DSCR
- —
- Eligible?
- —
Short-term bridge; refi at stabilization.
Listing history 4 events
-
2026-06-15status $140,000 Pending 3 DOM
-
2026-06-15days on market $140,000 Active 3 DOM
-
2026-06-14remarks 529-char remark
-
2026-06-14$140,000 Active 1 DOM
ⓘ Source: listings_history table (triggers on properties + properties_extension) + one-shot
backfill from property_details.listing_events for pre-trigger history.
Climate risk First Street
- Flood 1/10 Low FEMA zone X (unshaded) · 0% chance over 30 yrs
- Wildfire 5/10 Major
- Heat 7/10 Severe 7 d/yr ≥108°F today · 21 d/yr by 30 yrs out
- Wind 8/10 Severe 80% chance of damaging wind over 30 yrs
- Air quality 1/10 Low 0 unhealthy d/yr today · 0 by 30 yrs out
Nearby sold comps map
Loading sold comps map…
Walkable amenities ~0.75 mi
Loading nearby amenities…
Taxation est. · year 1
- Rental income
- $19,911
- − Mortgage interest
- −$7,842
- − Property taxes
- −$2,100
- − Insurance
- −$700
- − Repairs & maintenance
- −$1,593
- − Management
- −$1,593
- − Depreciation
- −$4,073
- Taxable income
- $2,010
- Est. tax owed @ 24.0%
- −$483
- After-tax cash flow
- $3,637/yr
For passive investors: Depreciation is non-cash, so a rental often shows a tax loss while cash-flowing — sheltering income. Rental losses are passive: they offset passive income freely, and up to $25,000/yr can offset ordinary (W-2) income if you actively participate and your MAGI is under $100k (phasing out to $0 by $150k); unused losses carry forward. On sale, claimed depreciation is recaptured at up to 25%, and gains may owe capital-gains tax (a 1031 exchange can defer both). Figures are a year-1 estimate at your 24.0% rate — not tax advice; consult a CPA.
Schools (NCES district)
- District
- Hinds County School District
- NCES district ID
- 2801860
- Math proficiency
- 25% ▼ -16.00%
- Reading proficiency
- 29% ▼ -5.00%
- Median HH income
- $53,335
- Composite
- 24.02/100
- National rank
- #7771
- State rank
- #70 of 130 in MS
Livability — Terry
- Score
- 63/100
- State rank
- #159
- US rank
- #15477
Category grades
Schools grade is shown separately in the Schools card above.
Census & demographics
- Census place
- Terry, MS
- Population (ZIP)
- 8,970
Population outlook (Hinds County) Hauer SSP2
- Today (2025)
- 242,528 people
- By 2030
- 241,113 · -0.6%
- By 2040
- 235,557 · -2.9%
- By 2050
- 226,946 · -6.4%
- By 2075
- 199,995 · -17.5%
- By 2100
- 164,165 · -32.3%
Race, ethnicity, and origin ACS 2023
- Neighborhood character
- Majority Black (50%)
- Race & ethnicity
- Black 50% White 48% Two or more races 1%
- Common ancestry
- Serbian 3% Lithuanian 2% Slovak 1%
- Foreign-born
- 0%
- Languages at home
- 98% English-only · Spanish 1% German/W. Germanic 1%
Political lean MEDSL · Hinds
- 2024 margin
- Solid D (+46.1) · D 72.4% · R 26.3% · Other 1.4%
- 2008→2024 swing
- +7.1pp toward D · 2008: 39.0pp · 2024: 46.1pp
- All cycles
- 2024: D+46.1 2020: D+48.3 2016: D+43.7 2012: D+45.1 2008: D+39.0
Not yet ingested
- Civics
- —
Market trends
- HPI YoY
- ▼ -22.61%
- Current HPI
- 187.4762
- Rent YoY
- —
- Metro
- —
- State GDP YoY
- —
- F500 in state
- 0
Price history
+20.9% since first listed3 events — show timeline
- 2026-06-12 Listed $140,000 MLSU
- 2007-06-01 Sold (MLS) — MLSU
- 2006-12-04 Listed $115,815 MLSU
Cash-flow waterfall
monthlySold comps — $/sqft
last 12 mo · ≤1 miLoading sold comps…