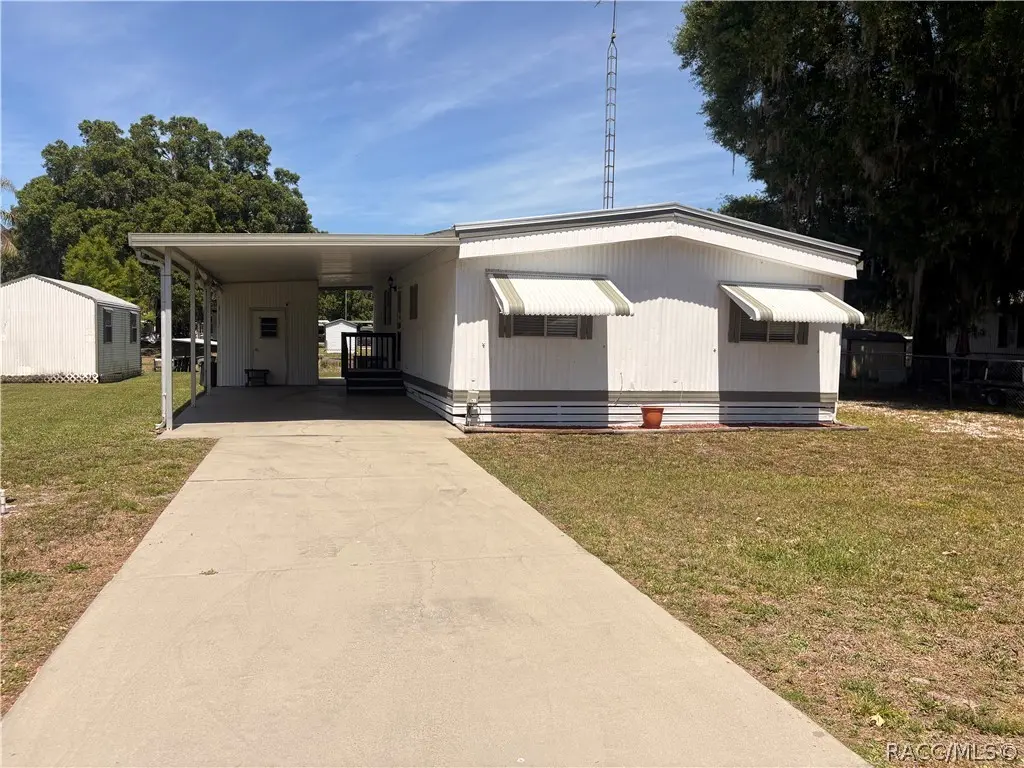
10330 E Pike Dr · Inverness, FL
Flood risk 1/10 · Minimal
- FEMA flood zone
- X (shaded)
- Chance of flooding over 30 yrs
- 0.0%
- Est. flood insurance / yr
- $507 – $1,088
Fire risk 5/10 · Moderate
- Est. fire insurance / yr
- $947 – $1,759
Heat risk 8/10 · Major
- Hot days now (above 107°F)
- 7 days/yr
- Hot days in 30 yrs
- 23 days/yr
Wind risk 9/10 · Severe
- Chance of severe wind over 30 yrs
- 99.0%
Air-quality risk 1/10 · Minimal
- Unhealthy air days now
- 0 days/yr
- Unhealthy air days in 30 yrs
- 0 days/yr
Risk factors via First Street. Map © Google.
Why this score? — see what drove the D grade
The composite is a weighted blend of 9 inputs, each scored 0–100. Each bar is that input's sub-score; the figure is the points it added to the 100-point composite (weight × sub-score).
- Cash flow +13.8/30.0
- ARV discount +7.5/15.0
- DSCR +4.2/10.0
- Schools +4.1/10.0
- Livability +3.4/5.0
- 1% rule +2.6/10.0
- Rent growth +2.5/5.0
- Condition / age +2.5/5.0
- Appreciation +0.0/10.0
$204,900
🖨 Deal sheet 📄 Offer letter ✓ Due diligence
Listing remarks
Lake life really does start here. This 2 bedroom 2 bath waterfront home is completely move-in ready. Inside, you’ll find an open-concept layout that was fully redone in 2021–2022, with all the big-ticket items already handled: new roof, new A/C, updated plumbing and electrical, new flooring, and a beautifully redone island kitchen with updated appliances. Step out back to a brand-new screened porch and a nice dock ready for fishing or hopping out on the water. The large lot gives you room to spread out, and there’s a carport for easy covered parking. The primary bedroom has a walk-in closet and its own en suite bath, and there’s plenty of storage throughout. You&rsqu
Key facts
- Updated electrical
- Waterfront home
- New a/c
Tags
Property features AI
Finance
- Other: Located in the East Cove subdivision; Zoning: CLRMH
Exterior
- Parking: Attached carport; Driveway; Concrete parking; 1 parking space total
- Utilities: Private well water; Septic tank sewer
- Home design: Manufactured single-wide home; Residential property
- Construction: Aluminum siding construction; Metal roof
- Exterior features: Metal roof; Aluminum siding; Rectangular, waterfront lot with canal access and canal front; Public maintained city street frontage
Interior
- Kitchen: Electric oven; Electric range; Refrigerator
- Flooring: Vinyl
- Bathrooms: 2 full bathrooms
- Heating & cooling: Central air conditioning (electric)
- Interior features: Electric oven and electric range; Refrigerator; Vinyl flooring
Neighborhood map
What this means for you Summary
Snapshot
- This is a 2-bed/2.0-bath manufactured listed at $205k.
Deal economics
- At list price, monthly cash flow is $19 ($234/yr) — positive.
- The deal already cash-flows at list — no discount required.
- To meet the 1% rule (rent ≥ 1% of price), the offer needs to be $156k (23.9% below list).
- Recommended offer: $156k (23.9% below list) — sets the bar for 1% rule.
- Cap rate 6.4% vs local median 4.9% in Inverness — meaningfully above typical; check what's discounted (condition, days-on-market, listing class) to confirm the premium yield is real.
Location & tenants
- Location reads 67/100 on livability (#564 in FL) — a middle-class / working-renter tenant base. Strengths: cost of living A+, housing A-; Watch: health & safety C-, amenities F, commute F.
- Citrus (rural): math 49% / reading 50% proficiency, ranked #44 of 73 in FL (top 60%) — families likely to look elsewhere, expect single-tenant / working-renter base with shorter leases.
- Zoned schools: Inverness Primary School (math 54% / reading 55%, grade C, #892 of 2,144 statewide, top 44%, 683 students, 65% FRL); Inverness Middle School (math 52% / reading 48%, grade C, #254 of 571 statewide, top 45%, 1,017 students, 60% FRL); Citrus High School (math 34% / reading 51%, grade F, #264 of 667 statewide, top 41%, 1,503 students, 54% FRL) — zoned schools at 60% FRL track the district average.
- Market conditions: 208 active listings in the ZIP; 2,443 units permitted in Citrus County in 2024 (0 in 5+ unit buildings).
Forward outlook
- Local home prices are declining (-3.0%/yr); year-one equity from $1k of loan paydown is wiped out by about $6k of value loss. Plan a longer hold.
- Citrus County population projected to shrink 10% by 2050 — rents likely to lag national; underwrite the cash flow, not the appreciation.
Negotiation context
- It's been on market 58 days — a 3% lower offer ($199k) is reasonable based on typical stale-listing flexibility.
- Current owner paid $117k; list at $205k implies a 75% gain — meaningful room to come down on a strong offer.
Risks & watch-outs
- Climate carrying-cost: severe wind risk, 99% chance of damaging wind over 30y; moderate wildfire risk; extreme-heat days projected 7→23/yr by 2055 (HVAC capex compounding) — expect insurance premiums to compound above CPI over the hold.
Questions for the listing agent
- It's been on market 58 days. Have you received any prior offers? Is the seller open to a 24% concession, seller financing, or rate buy-down credit?
- Is there a deadline driving the sale (1031 exchange, divorce, estate, relocation)? That informs how much negotiation room exists.
- Schools are B-rated — typically a magnet for longer-tenancy family renters. What's the average tenant stay here, and is there a school-zone premium baked into asking?
- The area grade is low — what's the realistic commute time and amenity access for the typical tenant pool here? Any planned neighborhood developments (good or bad) we should know about?
- What's the average days-on-market for RENTAL listings here right now (not sales)? A rising rental-DOM trend means longer vacancies and softer asking-rent achievability than the comps imply.
- What's the recent tenant-quality profile in this submarket — average credit score on applications, eviction rate, late-payment / NSF rate, and stable-employment percentage? A property-management company in the area should have these aggregated.
- How much new for-sale + rental construction is in the pipeline within 1–3 miles? Heavy new supply typically softens prices + rents 12–24 months out; constrained supply supports both.
Investment metrics
- 1% rule
- 0.76% ✗
- Cap rate
- 6.41%
- Cash-on-cash
- 0.41%
- DSCR
- 1.02
- GRM
- 11.0
CMA / ARV
- ARV (on-the-fly)
- $134,400
- Comps found
- 4
Show comp detail 4 sales within ~0.75 mi
| Address | Dist | Beds/Ba | Sqft | Sold | Price | $/sf | Match |
|---|---|---|---|---|---|---|---|
| 10029 E Perch Ct | 0.22mi | 2/2.0 | 1,024 (+7%) | 8mo | $155,900 | $152 | 72 |
| 10342 & 10338 E Pike Dr | 0.05mi | 1/1.0 (-1) | 880 (-8%) | 8mo | $120,000 | $136 | 69 |
| 9936 E Perch Ct | 0.25mi | 2/1.0 | 1,045 (+9%) | 3mo | $146,000 | $140 | 67 |
| 736 S Eden Gardens Ave | 0.53mi | 2/1.5 | 880 (-8%) | 19mo | $75,000 | $85 | 44 |
Match score weights: distance 35% · size 25% · config 20% · recency 20%. Top-matched comps best support the ARV.
Projected returns pro-forma
-3.0% appreciation · 3.0% rent growth · sell at horizon
- IRR
- -15.7%
- Equity multiple
- 0.44×
- Total profit
- $-32,064
- Equity at exit
- $30,551
- IRR
- -7.4%
- Equity multiple
- 0.53×
- Total profit
- $-26,738
- Equity at exit
- $17,716
Cash invested: $57,372 (down + closing). Projections, not guarantees.
Landlord ↔ Tenant lean methodology
- Overall (STATE)
- 87 Strongly Landlord-Friendly
- State Florida
- 87 Strongly Landlord-Friendly · R+3
- County
- — inherits STATE
- City
- — inherits STATE
ZIP-level market 34450
- Home prices YoY
- -18.7%
- Active inventory
- 208
- Price-to-rent
- 11.0×
Monthly cashflow live
- Estimated rent
- $1,558 medium interval (Pro) →
- Mortgage (P&I)
- −$1,075
- Tax from tax record
- −$52 /mo · $621/yr
- Insurance
- −$85
- HOA
- −$0
- Vacancy / Maint / Mgmt
- −$327
- Net cashflow
- $19
Break-even live
UW: 25.0% down · 7.5% · 30yr · 1.5% tax · 5.0% vac · 8.0% maint · 8.0% mgmt
Financing live
Cash to close
- Down payment
- $51,225
- Closing costs
- $6,147
- Reserves months
- —
- Total cash needed
- —
Loan-product check · same deal, 3 products live
Conventional
25% down · 7.5% · 30yr
- Down + closing
- —
- Monthly P&I
- —
- Monthly cashflow
- —
- DSCR
- —
- Eligible?
- —
Personal DTI + credit; lowest rate.
DSCR
20% down · 8.5% · 30yr
- Down + closing
- —
- Monthly P&I
- —
- Monthly cashflow
- —
- DSCR
- —
- Eligible?
- —
No personal income docs; deal must DSCR.
Hard money
10% down · 12.0% · 12mo
- Down + closing
- —
- Monthly P&I
- —
- Monthly cashflow
- —
- DSCR
- —
- Eligible?
- —
Short-term bridge; refi at stabilization.
Listing history 23 events
-
2026-06-19days on market $204,900 Active 58 DOM
-
2026-06-18days on market $204,900 Active 57 DOM
-
2026-06-17days on market $204,900 Active 56 DOM
-
2026-06-16days on market $204,900 Active 55 DOM
-
2026-06-15days on market $204,900 Active 54 DOM
-
2026-06-14days on market $204,900 Active 52 DOM
-
2026-06-13days on market $204,900 Active 51 DOM
-
2026-06-09days on market $204,900 Active 48 DOM
-
2026-06-08days on market $204,900 Active 47 DOM
-
2026-06-07days on market $204,900 Active 46 DOM
-
2026-06-03days on market $204,900 Active 42 DOM
-
2026-06-02days on market $204,900 Active 41 DOM
-
2026-06-01days on market $204,900 Active 40 DOM
-
2026-05-31days on market $204,900 Active 39 DOM
-
2026-05-30days on market $204,900 Active 38 DOM
-
2026-04-17$204,900 Active
-
2025-10-07price $205,000
-
2025-04-30price $215,000
-
2021-05-14soldstatus $117,000
-
1995-06-23soldstatus $40,000
-
1990-04-01soldstatus $56,000
-
1987-06-01soldstatus $45,500
-
1980-05-01soldstatus $10,500
ⓘ Source: listings_history table (triggers on properties + properties_extension) + one-shot
backfill from property_details.listing_events for pre-trigger history.
Tax reassessment forecast FL · Resets to sale price
- Current annual tax
- $621 · $52/mo
- Projected year-2 tax
- $1,701 · $142/mo
- Expected delta
- +$1,080/yr (+$90/mo · 174.1%)
ⓘ Screening estimate from a state-policy table — verify with the county assessor before closing.
Climate risk First Street
- Flood 1/10 Low FEMA zone X (shaded) · 0% chance over 30 yrs
- Wildfire 5/10 Major
- Heat 8/10 Severe 7 d/yr ≥107°F today · 23 d/yr by 30 yrs out
- Wind 9/10 Extreme 99% chance of damaging wind over 30 yrs
- Air quality 1/10 Low 0 unhealthy d/yr today · 0 by 30 yrs out
Nearby sold comps map
Loading sold comps map…
Walkable amenities ~0.75 mi
Loading nearby amenities…
Taxation est. · year 1
- Rental income
- $18,700
- − Mortgage interest
- −$11,478
- − Property taxes
- −$621
- − Insurance
- −$1,024
- − Repairs & maintenance
- −$1,496
- − Management
- −$1,496
- − Depreciation
- −$5,961
- Taxable loss
- −$3,375
- Est. tax savings @ 24.0%
- +$810
- After-tax cash flow
- $1,044/yr
For passive investors: Depreciation is non-cash, so a rental often shows a tax loss while cash-flowing — sheltering income. Rental losses are passive: they offset passive income freely, and up to $25,000/yr can offset ordinary (W-2) income if you actively participate and your MAGI is under $100k (phasing out to $0 by $150k); unused losses carry forward. On sale, claimed depreciation is recaptured at up to 25%, and gains may owe capital-gains tax (a 1031 exchange can defer both). Figures are a year-1 estimate at your 24.0% rate — not tax advice; consult a CPA.
Schools (NCES district)
- District
- Citrus
- NCES district ID
- 1200270
- Math proficiency
- 49% ▼ -10.00%
- Reading proficiency
- 50% ▼ -6.00%
- Median HH income
- $38,618
- Composite
- 41.28/100
- National rank
- #3519
- State rank
- #44 of 73 in FL
Livability — Inverness
- Score
- 67/100
- State rank
- #564
- US rank
- #10791
Category grades
Schools grade is shown separately in the Schools card above.
Census & demographics
- City population
- 10,621
- Population (ZIP)
- 10,408
Population outlook (Citrus County) Hauer SSP2
- Today (2025)
- 138,622 people
- By 2030
- 136,886 · -1.3%
- By 2040
- 132,009 · -4.8%
- By 2050
- 125,196 · -9.7%
- By 2075
- 108,570 · -21.7%
- By 2100
- 84,454 · -39.1%
Race, ethnicity, and origin ACS 2023
- Neighborhood character
- Predominantly White (81%)
- Race & ethnicity
- White 81% Two or more races 10% Hispanic / Latino 8% Asian 3% Black 1%
- Hispanic origin (detail)
- Mexican 3% Puerto Rican 3%
- Common ancestry
- Romanian 4% Slovak 3% Lithuanian 2%
- Foreign-born
- 8% · Canada
- Languages at home
- 90% English-only · Spanish 4% Other Indo-European 3% Tagalog/Filipino 1%
Political lean MEDSL · Citrus
- 2024 margin
- Solid R (+45.9) · D 26.8% · R 72.6%
- 2008→2024 swing
- -29.8pp toward R · 2008: -16.1pp · 2024: -45.9pp
- All cycles
- 2024: R+45.9 2020: R+41.0 2016: R+39.7 2012: R+21.9 2008: R+16.1
Not yet ingested
- Civics
- —
Market trends
- HPI YoY
- ▼ -72.56%
- Current HPI
- 315.9725
- Rent YoY
- —
- Metro
- —
- State GDP YoY
- ▲ 3.28%
- F500 in state
- 36
Industry mix (Fortune 500 HQ in FL)
| Industry | F500 HQs | Revenue |
|---|---|---|
| Industrial Technology | 2 | $29B |
|
||
| Insurance | 2 | $17B |
|
||
| Retail | 1 | $60B |
|
||
| Technology Distribution | 1 | $58B |
|
||
| Homebuilding | 1 | $35B |
|
||
| Technology Manufacturing | 1 | $35B |
|
||
Price history
+1851.4% since first listed8 events — show timeline
- 2026-04-17 Listed $204,900 RACC
- 2025-10-07 Price Changed $205,000 RACC
- 2025-04-30 Price Changed $215,000 RACC
- 2021-05-14 Sold (Public Records) $117,000 Public Records
- 1995-06-23 Sold (Public Records) $40,000 Public Records
- 1990-04-01 Sold (Public Records) $56,000 Public Records
- 1987-06-01 Sold (Public Records) $45,500 Public Records
- 1980-05-01 Sold (Public Records) $10,500 Public Records
Property tax history
+13.0%/yrLatest (2025): $621 · +9.8% YoY. Source: county tax records.
Cash-flow waterfall
monthlySold comps — $/sqft
last 12 mo · ≤1 miLoading sold comps…