 Triplex
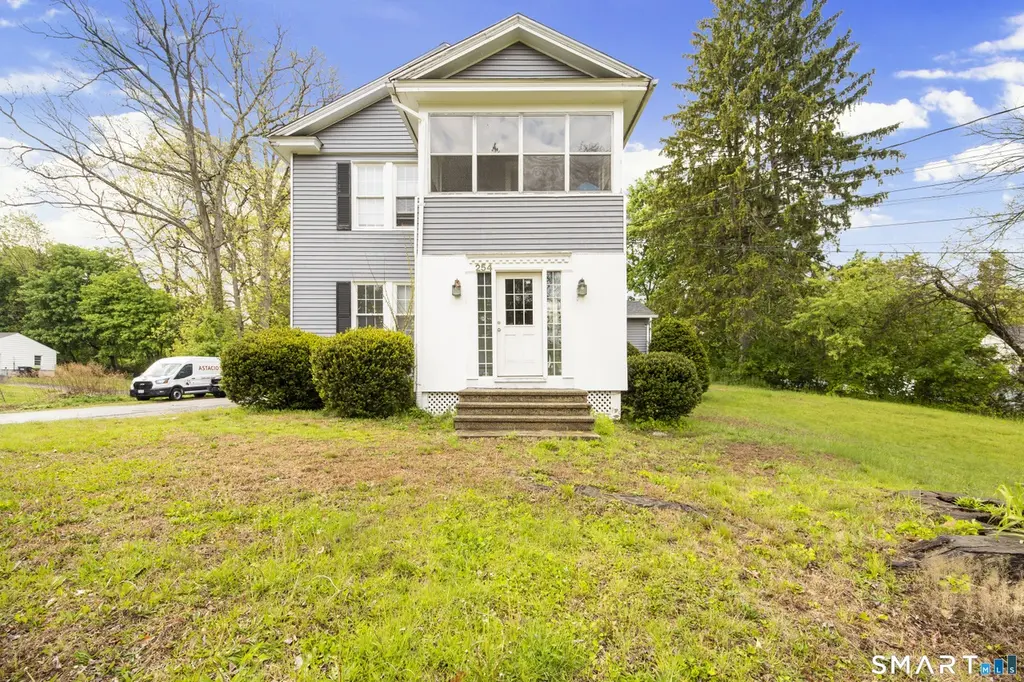
254 Davis St · Oakville, CT
Flood risk 1/10 · Minimal
- FEMA flood zone
- X
- Chance of flooding over 30 yrs
- 0.0%
- Est. flood insurance / yr
- $473 – $860
Fire risk 1/10 · Minimal
- Est. fire insurance / yr
- $829 – $1,539
Heat risk 5/10 · Moderate
- Hot days now (above 96°F)
- 7 days/yr
- Hot days in 30 yrs
- 16 days/yr
Wind risk 6/10 · Moderate
- Chance of severe wind over 30 yrs
- 27.0%
Air-quality risk 2/10 · Minimal
- Unhealthy air days now
- 1 days/yr
- Unhealthy air days in 30 yrs
- 1 days/yr
Risk factors via First Street. Map © Google.
Why this score? — see what drove the C- grade
The composite is a weighted blend of 9 inputs, each scored 0–100. Each bar is that input's sub-score; the figure is the points it added to the 100-point composite (weight × sub-score).
- Cash flow +25.0/30.0
- DSCR +8.1/10.0
- 1% rule +6.0/10.0
- Schools +4.2/10.0
- Livability +3.6/5.0
- Rent growth +2.5/5.0
- Condition / age +2.5/5.0
- ARV discount +0.0/15.0
- Appreciation +0.0/10.0
$499,990
🖨 Deal sheet (PDF) 📄 Offer letter ✓ Due diligence
Multi-family units
County records classify this as Multi-Family (2-4 Unit). Listing-text estimate: 3 units. confirmed
Listing remarks MLS
CALLING ALL INVESTORS! FULLY OCCUPIED 3-FAMILY that has a 1 car detached garage, back patio area and natural gas heat. Unit 1 is on the basement level and has 1 bedroom and 1 full bathroom. Unit 2 & 3 have 2 bedrooms, 1 full bathroom and a enclosed 3-season porch. All units have newer vinyl flooring. Also this home as 2 new hot water heaters and a new garage door. MOVE QUICK!
Key facts
- Natural gas heat
- Newer vinyl flooring
- New garage door
Tags
Property features AI
Exterior
- Parking: Detached garage; Driveway parking; Off-street parking; 6 total parking spaces; 1 garage
- Utilities: Public water connected; Public sewer connected
- Home design: Multi-family property (3-family)
- Construction: Frame construction; Block and stone foundation
- Exterior features: Level lot; Private driveway; Vinyl siding; Asphalt shingle roof; Blue exterior color
Interior
- Bedrooms: 6 bedrooms
- Bathrooms: 3 full bathrooms
- Heating & cooling: Baseboard heating; Hot air heating; Natural gas heat fuel; 40-gallon natural gas hot water tank
- Interior features: 10 total rooms; Partial, partially finished basement; Attic with access via hatch
Neighborhood map
What this means for you Summary
Snapshot
- This is a 2×2bd/1.0ba + 1×1bd/1.0ba units multifamily listed at $500k.
Deal economics
- At list price, monthly cash flow is $1k ($13k/yr) — positive. Per door: $361/mo.
- The deal already cash-flows at list — no discount required.
- Meets the 1% rule at list price ($5k rent vs $500k).
- Cap rate 8.9% vs local median 1.9% in Oakville — top-decile yield for the area; either an underpriced asset or a hidden risk that comps aren't pricing in. Stress-test before assuming the spread holds.
Location & tenants
- Location reads 71/100 on livability (#94 in CT) — a middle-class / working-renter tenant base. Strengths: employment A+, housing A+, crime A; Watch: amenities F, commute F.
- Watertown School District (suburban): math 36% / reading 56% proficiency, ranked #84 of 153 in CT (top 55%) — families likely to look elsewhere, expect single-tenant / working-renter base with shorter leases; only 18% free/reduced lunch — higher-income household profile.
- Zoned schools: Polk School (math 43% / reading 52%, grade D, #255 of 553 statewide, top 46%, 321 students, 44% FRL); Watertown High School (math 22% / reading 57%, grade F, #107 of 194 statewide, top 56%, 735 students, 34% FRL) — zoned schools average 39% FRL vs 18% district-wide (21 pts higher); higher-poverty schools than district average — tighter screening recommended.
- Market conditions: 17 active listings in the ZIP; solid renter incomes; 502 units permitted in Naugatuck Valley Planning Region in 2024 (171 in 5+ unit buildings).
- At $5,499/mo this rent would consume 69% of the median local household income ($96k/yr) (locally 301% of renters already pay >50% of income on rent) — very limited rent-growth headroom before tenants either downsize or default.
Forward outlook
- Local home prices are declining (-3.0%/yr); year-one equity from $3k of loan paydown is wiped out by about $15k of value loss. Plan a longer hold.
Negotiation context
- Only 13 days on market — expect competitive offers; lowballing is unlikely to land.
- 4 sale attempts since 18y ago with the ask held roughly flat each time — persistent listings suggest the price (not the market) is what's stuck; bring a comps-based counter.
- Current owner paid $376k; 33% above their basis — modest negotiation headroom, anchor on the comps not their cost.
Risks & watch-outs
- Watch-outs: built in 1905 — expect roof / HVAC / electrical / plumbing capex.
- Climate carrying-cost: major wind risk, 27% chance of damaging wind over 30y; extreme-heat days projected 7→16/yr by 2055 (HVAC capex compounding) — expect insurance premiums to compound above CPI over the hold.
Questions for the listing agent
- Can we see the unit-by-unit rent roll, current vacancy, and any below-market leases? What's the average tenancy length?
- What capital expenditures (roof, boiler, parking lot, exteriors) have been made in the last 5 years, and what's planned in the next 2?
- Built in 1905 — when were the roof, HVAC, electrical panel, plumbing, and water heater last replaced?
- Is there a deadline driving the sale (1031 exchange, divorce, estate, relocation)? That informs how much negotiation room exists.
- Schools are B-rated — typically a magnet for longer-tenancy family renters. What's the average tenant stay here, and is there a school-zone premium baked into asking?
- What's the average days-on-market for RENTAL listings here right now (not sales)? A rising rental-DOM trend means longer vacancies and softer asking-rent achievability than the comps imply.
- What's the recent tenant-quality profile in this submarket — average credit score on applications, eviction rate, late-payment / NSF rate, and stable-employment percentage? A property-management company in the area should have these aggregated.
- How much new apartment / multifamily construction is in the pipeline within 1–3 miles? Heavy new supply (>2% of stock underway) typically softens rents 12–24 months out; light construction supports rent growth.
Investment metrics
- 1% rule
- 1.10% ✓
- Cap rate
- 8.89%
- Cash-on-cash
- 9.29%
- DSCR
- 1.41
- GRM
- 7.6
CMA / ARV
- ARV (median comp)
- $404,694
- List price
- $499,990
- Delta
- 23.55%
- Verdict
- OVERPRICED
- Comps
- 20 within 1.0 mi
Show comp detail 4 sales within ~0.75 mi
| Address | Dist | Beds/Ba | Sqft | Sold | Price | $/sf | Match |
|---|---|---|---|---|---|---|---|
| 31 Van Orman St | 0.32mi | 5/2.0 (-1) | 2,016 (0%) | 1mo | $440,000 | $218 | 75 |
| 19 Maplewood St | 0.38mi | 5/2.0 (-1) | 1,920 (-5%) | 22mo | $368,000 | $192 | 47 |
| 284 Newridge Ave | 0.66mi | 6/2.0 | 2,186 (+8%) | 5mo | $425,000 | $194 | 47 |
| 264 Newridge Ave | 0.70mi | 5/2.0 (-1) | 1,948 (-3%) | 21mo | $325,000 | $167 | 36 |
Match score weights: distance 35% · size 25% · config 20% · recency 20%. Top-matched comps best support the ARV.
Projected returns pro-forma
-3.0% appreciation · 3.0% rent growth · sell at horizon
- IRR
- -2.3%
- Equity multiple
- 0.91×
- Total profit
- $-12,045
- Equity at exit
- $74,550
- IRR
- 7.4%
- Equity multiple
- 1.56×
- Total profit
- $78,226
- Equity at exit
- $43,230
Cash invested: $139,997 (down + closing). Projections, not guarantees.
Landlord ↔ Tenant lean methodology
- Overall (STATE)
- 27 Tenant-Leaning
- State Connecticut
- 27 Tenant-Leaning · D+7
- County
- — inherits STATE
- City
- — inherits STATE
ZIP-level market 06779
- Home prices YoY
- -22.3%
- Active inventory
- 17
- Price-to-rent
- 21.3×
Monthly cashflow live
- Estimated rent
- $5,499 medium interval (Pro) →
- Mortgage (P&I)
- −$2,622
- Tax from tax record
- −$430 /mo · $5,164/yr
- Insurance
- −$208
- HOA
- −$0
- Vacancy / Maint / Mgmt
- −$1,155
- Net cashflow
- $1,084
Break-even live
Sensitivity live
| Price | -10% $1,367 | -5% $1,225 | +0% $1,084 | +5% $942 | +10% $801 |
|---|---|---|---|---|---|
| Rent | -10% $649 | -5% $866 | +0% $1,084 | +5% $1,301 | +10% $1,518 |
| Rate | -1.0pp $1,335 | -0.5pp $1,211 | base $1,084 | +0.5pp $954 | +1.0pp $822 |
3-unit breakdown (identical units grouped — click to expand)
| Units | Beds | Baths | Est. rent |
|---|---|---|---|
| 2× units | 2 | 1 | $3,912 |
| #1 | 2 | 1 | $1,956 |
| #2 | 2 | 1 | $1,956 |
| 1× unit | 1 | 1 | $1,588 |
| Total (3 units) | $5,499 | ||
UW: 25.0% down · 7.5% · 30yr · 1.5% tax · 5.0% vac · 8.0% maint · 8.0% mgmt
Financing live
Cash to close
- Down payment
- $124,998
- Closing costs
- $15,000
- Reserves months
- —
- Total cash needed
- —
Loan-product check · same deal, 3 products live
Conventional
25% down · 7.5% · 30yr
- Down + closing
- —
- Monthly P&I
- —
- Monthly cashflow
- —
- DSCR
- —
- Eligible?
- —
Personal DTI + credit; lowest rate.
DSCR
20% down · 8.5% · 30yr
- Down + closing
- —
- Monthly P&I
- —
- Monthly cashflow
- —
- DSCR
- —
- Eligible?
- —
No personal income docs; deal must DSCR.
Hard money
10% down · 12.0% · 12mo
- Down + closing
- —
- Monthly P&I
- —
- Monthly cashflow
- —
- DSCR
- —
- Eligible?
- —
Short-term bridge; refi at stabilization.
Listing history 8 events
-
2026-05-12$499,990 Active 1058-char remark
-
2023-08-14soldstatus $376,500 Closed 382-char remark
Show marketing remark (382 chars)
CALLING ALL INVESTORS! FULLY OCCUPIED 3-FAMILY that has a 1 car detached garage, back patio area and natural gas heat. Unit 1 is on the basement level and has 1 bedroom and 1 full bathroom. Unit 2 & 3 have 2 bedrooms, 1 full bathroom and a enclosed 3-season porch. All units have newer vinyl flooring. Also this home as 2 new hot water heaters and a new garage door. MOVE QUICK!
-
2023-06-24status Under Contract 382-char remark
Show marketing remark (382 chars)
CALLING ALL INVESTORS! FULLY OCCUPIED 3-FAMILY that has a 1 car detached garage, back patio area and natural gas heat. Unit 1 is on the basement level and has 1 bedroom and 1 full bathroom. Unit 2 & 3 have 2 bedrooms, 1 full bathroom and a enclosed 3-season porch. All units have newer vinyl flooring. Also this home as 2 new hot water heaters and a new garage door. MOVE QUICK!
-
2023-06-16$379,000 Active 382-char remark
Show marketing remark (382 chars)
CALLING ALL INVESTORS! FULLY OCCUPIED 3-FAMILY that has a 1 car detached garage, back patio area and natural gas heat. Unit 1 is on the basement level and has 1 bedroom and 1 full bathroom. Unit 2 & 3 have 2 bedrooms, 1 full bathroom and a enclosed 3-season porch. All units have newer vinyl flooring. Also this home as 2 new hot water heaters and a new garage door. MOVE QUICK!
-
2010-12-28historical
-
2009-07-30$269,900
-
2009-05-04historical
-
2008-08-04$279,900
ⓘ Source: listings_history table (triggers on properties + properties_extension) + one-shot
backfill from property_details.listing_events for pre-trigger history.
Tax reassessment forecast CT · Partial reset (capped growth)
- Current annual tax
- $5,164 · $430/mo
- Projected year-2 tax
- $7,932 · $661/mo
- Expected delta
- +$2,768/yr (+$231/mo · 53.6%)
ⓘ Screening estimate from a state-policy table — verify with the county assessor before closing.
Climate risk First Street
- Flood 1/10 Low FEMA zone X · 0% chance over 30 yrs
- Wildfire 1/10 Low
- Heat 5/10 Major 7 d/yr ≥96°F today · 16 d/yr by 30 yrs out
- Wind 6/10 Major 27% chance of damaging wind over 30 yrs
- Air quality 2/10 Low 1 unhealthy d/yr today · 1 by 30 yrs out
Nearby sold comps map
Loading sold comps map…
Walkable amenities ~0.75 mi
Loading nearby amenities…
Taxation est. · year 1
- Rental income
- $65,988
- − Mortgage interest
- −$28,007
- − Property taxes
- −$5,164
- − Insurance
- −$2,500
- − Repairs & maintenance
- −$5,279
- − Management
- −$5,279
- − Depreciation
- −$14,545
- Taxable income
- $5,214
- Est. tax owed @ 24.0%
- −$1,251
- After-tax cash flow
- $11,751/yr
For passive investors: Depreciation is non-cash, so a rental often shows a tax loss while cash-flowing — sheltering income. Rental losses are passive: they offset passive income freely, and up to $25,000/yr can offset ordinary (W-2) income if you actively participate and your MAGI is under $100k (phasing out to $0 by $150k); unused losses carry forward. On sale, claimed depreciation is recaptured at up to 25%, and gains may owe capital-gains tax (a 1031 exchange can defer both). Figures are a year-1 estimate at your 24.0% rate — not tax advice; consult a CPA.
Schools (NCES district)
- District
- Watertown School District
- NCES district ID
- 0904890
- Math proficiency
- 36% ▼ -13.00%
- Reading proficiency
- 56% ▼ -7.00%
- Median HH income
- $76,021
- Composite
- 41.88/100
- National rank
- #3368
- State rank
- #84 of 153 in CT
Livability — Oakville
- Score
- 71/100
- State rank
- #94
- US rank
- #7195
Category grades
Schools grade is shown separately in the Schools card above.
Census & demographics
- Census place
- Oakville, CT
- County
- Litchfield County · 81,203 people
- City population
- 7,762
- Metro
- Torrington, CT
- Population (ZIP)
- 8,364
- Household income
- $95,798
- Rent vs Own
- Severe rent burden
- 301.0
Population outlook (Naugatuck Valley County) Hauer SSP2
- By 2040
- 496,846
Race, ethnicity, and origin ACS 2023
- Neighborhood character
- Predominantly White (81%)
- Race & ethnicity
- White 81% Hispanic / Latino 13% Two or more races 5% Black 3%
- Hispanic origin (detail)
- Puerto Rican 4%
- Common ancestry
- Lithuanian 8% Romanian 6% Slovak 3%
- Foreign-born
- 11% · Canada, Dominican Republic
- Languages at home
- 85% English-only · Other Indo-European 7% Spanish 6% Russian/Polish/Slavic 2%
Political lean MEDSL · Naugatuck Valley
- 2024 margin
- Lean R (+7.4) · D 45.6% · R 53.0% · Other 1.4%
- All cycles
- 2024: R+7.4
Not yet ingested
- Civics
- —
Market trends
- HPI YoY
- ▼ -75.01%
- Current HPI
- 261.4188
- Rent YoY
- —
- Metro
- Torrington, CT
- State GDP YoY
- ▲ 1.06%
- F500 in state
- 38
Industry mix (Fortune 500 HQ in CT)
| Industry | F500 HQs | Revenue |
|---|---|---|
| Industrial Machinery | 4 | $38B |
|
||
| Insurance | 3 | $71B |
|
||
| Financial Services | 2 | $25B |
|
||
| Transportation / Logistics | 2 | $18B |
|
||
| Healthcare | 1 | $247B |
|
||
| Telecommunications | 1 | $55B |
|
||
Price history
+78.6% since first listed9 events — show timeline
- 2026-05-25 Pending — Smart MLS
- 2026-05-12 Listed $499,990 Smart MLS
- 2023-08-14 Sold (MLS) $376,500 Smart MLS
- 2023-06-24 Pending — Smart MLS
- 2023-06-16 Listed $379,000 Smart MLS
- 2010-12-28 Listing Removed — Smart MLS
- 2009-07-30 Listed $269,900 Smart MLS
- 2009-05-04 Listing Removed — Smart MLS
- 2008-08-04 Listed $279,900 Smart MLS
Property tax history
+1.3%/yrLatest (2023): $5,164 · +5.5% YoY. Source: county tax records.
Cash-flow waterfall
monthlySold comps — $/sqft
last 12 mo · ≤1 miLoading sold comps…