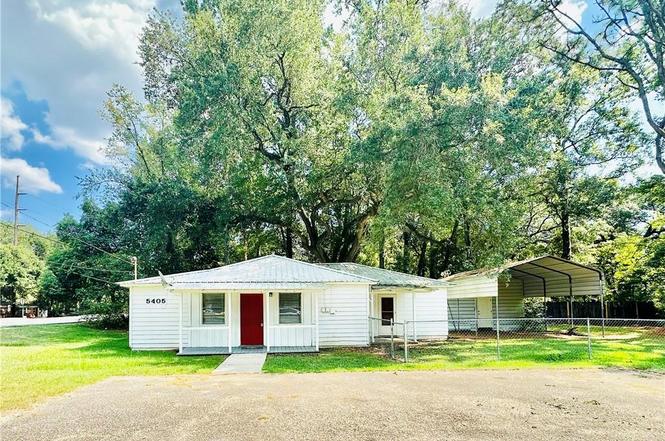
5405 Moffett Rd · Mobile, AL
Flood risk 1/10 · Minimal
- FEMA flood zone
- X (unshaded)
- Chance of flooding over 30 yrs
- 0.0%
- Est. flood insurance / yr
- $507 – $1,088
Fire risk 4/10 · Minor
- Est. fire insurance / yr
- $916 – $1,700
Heat risk 9/10 · Severe
- Hot days now (above 104°F)
- 7 days/yr
- Hot days in 30 yrs
- 20 days/yr
Wind risk 9/10 · Severe
- Chance of severe wind over 30 yrs
- 99.0%
Air-quality risk 1/10 · Minimal
- Unhealthy air days now
- 0 days/yr
- Unhealthy air days in 30 yrs
- 0 days/yr
Risk factors via First Street. Map © Google.
Why this score? — see what drove the C- grade
The composite is a weighted blend of 9 inputs, each scored 0–100. Each bar is that input's sub-score; the figure is the points it added to the 100-point composite (weight × sub-score).
- Cash flow +22.6/30.0
- ARV discount +7.5/15.0
- DSCR +7.2/10.0
- 1% rule +5.3/10.0
- Livability +3.8/5.0
- Rent growth +2.5/5.0
- Condition / age +2.5/5.0
- Schools +2.3/10.0
- Appreciation +0.0/10.0
$139,900
🖨 Deal sheet (PDF) 📄 Offer letter ✓ Due diligence
Listing remarks
AWESOME OFFICE SPACE WITH PLENTY OF PARKING! * * ONE HALF ACRE ON MOFFETT ROAD! * * Zoned as RESIDENTIAL OR B2 COMMERCIAL. UPDATED HVAC, ROOF, and WATER HEATER! Three bedroom 1 bath 1412 Sf. on a half acre double lot! Open living/family area with updated flooring, freshly painted interior and exterior, new roof and more! Kitchen open to family area with plenty of custom cabinetry, stainless sink and stove! There are 3 well sized bedrooms with hallway bath! Must see! Carport and fenced in area! Schedule your showing today! Convenient to shopping, roadways and more! Plan your viewing today!
Key facts
- Custom cabinetry
- Half acre
- New hvac
Tags
Neighborhood map
What this means for you Summary
Snapshot
- This is a 3-bed/2.0-bath other listed at $140k.
Deal economics
- At list price, monthly cash flow is $237 ($3k/yr) — positive.
- The deal already cash-flows at list — no discount required.
- Meets the 1% rule at list price ($1k rent vs $140k).
- Recommended offer: $123k (12.0% below list) — sets the bar for market timing.
- Cap rate 8.3% vs local median 4.9% in Mobile — top-decile yield for the area; either an underpriced asset or a hidden risk that comps aren't pricing in. Stress-test before assuming the spread holds.
Location & tenants
- Location reads 75/100 on livability (#20 in AL, #4,262 nationally) — a middle-class / working-renter tenant base. Strengths: commute A+, cost of living A+, housing A+; Watch: crime F, employment D-.
- Mobile County (urban): math 15% / reading 39% proficiency, ranked #81 of 129 in AL (top 63%) — low school quality limits family demand, transient renter base, plan for 1-2y turnover; 67% free/reduced lunch — lower-income household profile, screen leases tightly.
- Zoned schools: Orchard Elementary School (math 4% / reading 29%, grade F, #501 of 627 statewide, top 80%, 539 students, 84% FRL); Cl Scarborough Model Middle School (math 4% / reading 21%, grade F, #216 of 257 statewide, top 86%, 651 students, 94% FRL); Mattie T Blount High School (math 2% / reading 3%, grade F, #291 of 305 statewide, top 100%, 1,176 students, 86% FRL) — zoned schools average 88% FRL vs 67% district-wide (21 pts higher); higher-poverty schools than district average — tighter screening recommended.
- Zoned-school proficiency averages 10% at this address vs 27% district-wide (-16 pts) — the specific schools serving this property underperform the Mobile County average; the district grade overstates school quality for this exact location.
- Market conditions: 102 active listings in the ZIP; 14 comparable units currently listed for rent nearby; rentals lingering (median 45d on market — plan ~5-8 weeks vacancy on turnover, expect pricing pressure); 50% of comp listings sitting > 30 days — soft ceiling on asking rent; 1,678 units permitted in Mobile County in 2024 (264 in 5+ unit buildings).
Forward outlook
- Local home prices are declining (-3.0%/yr); year-one equity from $967 of loan paydown is wiped out by about $4k of value loss. Plan a longer hold.
- Mobile County population projected to shrink 8% by 2050 — rents likely to lag national; underwrite the cash flow, not the appreciation.
Negotiation context
- It's been on market 202 days — a 12% lower offer ($123k) is reasonable based on typical stale-listing flexibility.
- 3 sale attempts; this cycle's ask has dropped $18k (11%) from the opening price — seller is motivated, your offer sets the floor, not the list.
Risks & watch-outs
- Watch-outs: built in 1958 — expect roof / HVAC / electrical / plumbing capex.
- Climate carrying-cost: severe wind risk, 99% chance of damaging wind over 30y; extreme-heat days projected 7→20/yr by 2055 (HVAC capex compounding) — expect insurance premiums to compound above CPI over the hold.
Questions for the listing agent
- It's been on market 202 days. Have you received any prior offers? Is the seller open to a 12% concession, seller financing, or rate buy-down credit?
- Built in 1958 — when were the roof, HVAC, electrical panel, plumbing, and water heater last replaced?
- Why hasn't it sold? Are there any deal-killer items the seller is aware of (foundation, flood, title, zoning, code violations)?
- Is there a deadline driving the sale (1031 exchange, divorce, estate, relocation)? That informs how much negotiation room exists.
- Schools are D-rated, which usually means shorter tenancies and higher turnover. Who's the typical renter profile here, and what's been the actual vacancy rate?
- Crime grade is F in this area — have there been break-ins, vandalism, or insurance claims at this property in the last 3 years? What carrier currently insures it and at what premium?
- What's the average days-on-market for RENTAL listings here right now (not sales)? A rising rental-DOM trend means longer vacancies and softer asking-rent achievability than the comps imply.
- What's the recent tenant-quality profile in this submarket — average credit score on applications, eviction rate, late-payment / NSF rate, and stable-employment percentage? A property-management company in the area should have these aggregated.
- How much new for-sale + rental construction is in the pipeline within 1–3 miles? Heavy new supply typically softens prices + rents 12–24 months out; constrained supply supports both.
Investment metrics
- 1% rule
- 1.03% ✓
- Cap rate
- 8.33%
- Cash-on-cash
- 7.26%
- DSCR
- 1.32
- GRM
- 8.1
CMA / ARV
No comps found within radius.
Projected returns pro-forma
-3.0% appreciation · 3.0% rent growth · sell at horizon
- IRR
- -5.2%
- Equity multiple
- 0.81×
- Total profit
- $-7,601
- Equity at exit
- $20,860
- IRR
- 4.4%
- Equity multiple
- 1.32×
- Total profit
- $12,727
- Equity at exit
- $12,096
Cash invested: $39,172 (down + closing). Projections, not guarantees.
Landlord ↔ Tenant lean methodology
- Overall (STATE)
- 90 Strongly Landlord-Friendly
- State Alabama
- 90 Strongly Landlord-Friendly · R+15
- County
- — inherits STATE
- City
- — inherits STATE
ZIP-level market 36618
- Home prices YoY
- -22.8%
- Active inventory
- 102
- Price-to-rent
- 8.1×
Monthly cashflow live
- Estimated rent
- $1,437 high interval (Pro) →
- Mortgage (P&I)
- −$734
- Tax from tax record
- −$106 /mo · $1,278/yr
- Insurance
- −$58
- HOA
- −$0
- Vacancy / Maint / Mgmt
- −$302
- Net cashflow
- $237
Break-even live
Sensitivity live
| Price | -10% $316 | -5% $277 | +0% $237 | +5% $197 | +10% $158 |
|---|---|---|---|---|---|
| Rent | -10% $123 | -5% $180 | +0% $237 | +5% $294 | +10% $350 |
| Rate | -1.0pp $307 | -0.5pp $272 | base $237 | +0.5pp $201 | +1.0pp $164 |
UW: 25.0% down · 7.5% · 30yr · 1.5% tax · 5.0% vac · 8.0% maint · 8.0% mgmt
Financing live
Cash to close
- Down payment
- $34,975
- Closing costs
- $4,197
- Reserves months
- —
- Total cash needed
- —
Loan-product check · same deal, 3 products live
Conventional
25% down · 7.5% · 30yr
- Down + closing
- —
- Monthly P&I
- —
- Monthly cashflow
- —
- DSCR
- —
- Eligible?
- —
Personal DTI + credit; lowest rate.
DSCR
20% down · 8.5% · 30yr
- Down + closing
- —
- Monthly P&I
- —
- Monthly cashflow
- —
- DSCR
- —
- Eligible?
- —
No personal income docs; deal must DSCR.
Hard money
10% down · 12.0% · 12mo
- Down + closing
- —
- Monthly P&I
- —
- Monthly cashflow
- —
- DSCR
- —
- Eligible?
- —
Short-term bridge; refi at stabilization.
Rent comps 14 comps
| Address | Beds | Baths | Sqft | Rent | $/sqft | DOM | Units | Dist |
|---|---|---|---|---|---|---|---|---|
| 1631 Colonial Oaks Dr Mobile, AL | 3.0 | 1.0 | 1196 | $1,100 | $0.92 | 45d | 1 | 0.21mi |
| 5508 Overlook Rd Mobile, AL | 3.0 | 2.0 | 1260 | $1,400 | $1.11 | 15d | 1 | 0.30mi |
| 5520 Vienna Ave Mobile, AL | 3.0 | 2.0 | 1745 | $1,395 | $0.80 | 45d | 1 | 0.30mi |
| 5613 Overlook Rd Mobile, AL | 3.0 | 1.5 | 1520 | $1,450 | $0.95 | 45d | 1 | 0.41mi |
| 5751 Overlook Rd Unit A2 Mobile, AL | 2.0 | 1.0 | 890 | $850 | $0.96 | 22d | 1 | 0.52mi |
| 914 David Langan Dr E Mobile, AL | 3.0 | 1.0 | 1080 | $1,450 | $1.34 | 45d | 1 | 0.95mi |
| 1104 Garland St Mobile, AL | 3.0 | 1.0 | 1377 | $1,450 | $1.05 | 22d | 1 | 0.99mi |
| 5477 Ardell Dr Unit 1043691P Mobile, AL | 3.0 | 2.0 | 1496 | $2,680 | $1.79 | 15d | 1 | 1.00mi |
| 5904 Saint Gallen Ave S Unit 1043743P Mobile, AL | 4.0 | 2.0 | 1496 | $3,719 | $2.49 | 22d | 1 | 1.17mi |
| 912 Wendover Rd Unit 1043703P Mobile, AL | 4.0 | 2.5 | 1496 | $3,190 | $2.13 | 22d | 1 | 1.18mi |
| 1728 Tew Dr Mobile, AL | 2.0 | 1.0 | 912 | $995 | $1.09 | 45d | 1 | 1.23mi |
| 5855 Woodvale Dr Mobile, AL | 3.0 | 1.5 | 1712 | $1,350 | $0.79 | 22d | 1 | 1.33mi |
| 1063 Midmoor Dr Mobile, AL | 2.0 | 2.0 | 1695 | $1,450 | $0.86 | 45d | 1 | 1.50mi |
| 1404 Stevens Ln Mobile, AL | 3.0 | 1.0 | 1052 | $1,275 | $1.21 | 45d | 1 | 1.50mi |
Listing history 24 events
-
2026-03-06soldstatus $125,000
-
2026-01-19status Pending
-
2026-01-05status Active
-
2025-12-11historical Active Under Contract
-
2025-12-02status Pending
-
2025-11-25price $139,900
-
2025-11-25status Active
-
2025-10-01status Pending
-
2025-09-08price $135,000
-
2025-08-12price $139,900
-
2025-08-05price $145,000
-
2025-07-14price $146,900
-
2025-07-09price $147,155
-
2025-06-30price $148,155
-
2025-06-09price $149,155
-
2025-06-02price $155,000
-
2025-05-29price $157,000
-
2025-04-28$158,000 Active
-
2024-12-17price $157,900
-
2024-11-13price $158,000
-
2024-07-24price $159,500
-
2024-06-21price $159,900
-
2024-06-04price $165,900
-
2023-11-07soldstatus $75,000
ⓘ Source: listings_history table (triggers on properties + properties_extension) + one-shot
backfill from property_details.listing_events for pre-trigger history.
Tax reassessment forecast AL · Resets to sale price
- Current annual tax
- $1,278 · $106/mo
- Projected year-2 tax
- $1,278 · $106/mo
- Expected delta
- $0/yr ($0/mo · 0.0%)
ⓘ Screening estimate from a state-policy table — verify with the county assessor before closing.
Climate risk First Street
- Flood 1/10 Low FEMA zone X (unshaded) · 0% chance over 30 yrs
- Wildfire 4/10 Moderate
- Heat 9/10 Extreme 7 d/yr ≥104°F today · 20 d/yr by 30 yrs out
- Wind 9/10 Extreme 99% chance of damaging wind over 30 yrs
- Air quality 1/10 Low 0 unhealthy d/yr today · 0 by 30 yrs out
Nearby sold comps map
Loading sold comps map…
Walkable amenities ~0.75 mi
Loading nearby amenities…
Taxation est. · year 1
- Rental income
- $17,245
- − Mortgage interest
- −$7,837
- − Property taxes
- −$1,278
- − Insurance
- −$700
- − Repairs & maintenance
- −$1,380
- − Management
- −$1,380
- − Depreciation
- −$4,070
- Taxable income
- $603
- Est. tax owed @ 24.0%
- −$145
- After-tax cash flow
- $2,698/yr
For passive investors: Depreciation is non-cash, so a rental often shows a tax loss while cash-flowing — sheltering income. Rental losses are passive: they offset passive income freely, and up to $25,000/yr can offset ordinary (W-2) income if you actively participate and your MAGI is under $100k (phasing out to $0 by $150k); unused losses carry forward. On sale, claimed depreciation is recaptured at up to 25%, and gains may owe capital-gains tax (a 1031 exchange can defer both). Figures are a year-1 estimate at your 24.0% rate — not tax advice; consult a CPA.
Schools (NCES district)
- District
- Mobile County
- NCES district ID
- 0102370
- Math proficiency
- 15% ▼ -28.00%
- Reading proficiency
- 39% ▬ 0.00%
- Median HH income
- $42,455
- Composite
- 22.9/100
- National rank
- #8002
- State rank
- #81 of 129 in AL
Livability — Mobile
- Score
- 75/100
- State rank
- #20
- US rank
- #4262
Category grades
Schools grade is shown separately in the Schools card above.
Census & demographics
- Census place
- Mobile, AL
- County
- Mobile County · 246,577 people
- City population
- 205,729
- Metro
- Mobile, AL
- Population (ZIP)
- 17,892
- Household income
- $61,550
- Rent vs Own
- Severe rent burden
- 542.0
Population outlook (Mobile County) Hauer SSP2
- Today (2025)
- 415,303 people
- By 2030
- 411,755 · -0.9%
- By 2040
- 399,670 · -3.8%
- By 2050
- 382,616 · -7.9%
- By 2075
- 337,353 · -18.8%
- By 2100
- 283,391 · -31.8%
Race, ethnicity, and origin ACS 2023
- Neighborhood character
- Predominantly Black (65%)
- Race & ethnicity
- Black 65% White 27% Two or more races 3% Asian 3% Hispanic / Latino 2%
- Common ancestry
- Slovak 1% Serbian 1% Romanian 0%
- Foreign-born
- 4% · Canada, China
- Languages at home
- 94% English-only · Spanish 3% Chinese 2%
Political lean MEDSL · Mobile
- 2024 margin
- R (+16.4) · D 41.3% · R 57.7%
- 2008→2024 swing
- -7.7pp toward R · 2008: -8.7pp · 2024: -16.4pp
- All cycles
- 2024: R+16.4 2020: R+11.9 2016: R+13.9 2012: R+9.3 2008: R+8.7
Not yet ingested
- Civics
- —
Market trends
- HPI YoY
- ▼ -64.54%
- Current HPI
- 218.7133
- Rent YoY
- —
- Metro
- Mobile, AL
- State GDP YoY
- ▲ 2.94%
- F500 in state
- 4
Industry mix (Fortune 500 HQ in AL)
| Industry | F500 HQs | Revenue |
|---|---|---|
| Financial Services | 1 | $8B |
|
||
| Healthcare | 1 | $5B |
|
||
Price history
+66.7% since first listed24 events — show timeline
- 2026-03-06 Sold (Public Records) $125,000 Public Records
- 2026-01-19 Pending — GCMLS AL
- 2026-01-05 Relisted — GCMLS AL
- 2025-12-11 Contingent — GCMLS AL
- 2025-12-02 Pending — GCMLS AL
- 2025-11-25 Price Changed $139,900 GCMLS AL
- 2025-11-25 Relisted — GCMLS AL
- 2025-10-01 Pending — GCMLS AL
- 2025-09-08 Price Changed $135,000 GCMLS AL
- 2025-08-12 Price Changed $139,900 GCMLS AL
- 2025-08-05 Price Changed $145,000 GCMLS AL
- 2025-07-14 Price Changed $146,900 GCMLS AL
- 2025-07-09 Price Changed $147,155 GCMLS AL
- 2025-06-30 Price Changed $148,155 GCMLS AL
- 2025-06-09 Price Changed $149,155 GCMLS AL
- 2025-06-02 Price Changed $155,000 GCMLS AL
- 2025-05-29 Price Changed $157,000 GCMLS AL
- 2025-04-28 Listed $158,000 GCMLS AL
- 2024-12-17 Price Changed $157,900 GCMLS AL
- 2024-11-13 Price Changed $158,000 GCMLS AL
- 2024-07-24 Price Changed $159,500 GCMLS AL
- 2024-06-21 Price Changed $159,900 GCMLS AL
- 2024-06-04 Price Changed $165,900 GCMLS AL
- 2023-11-07 Sold (Public Records) $75,000 Public Records
Property tax history
+17.7%/yrLatest (2025): $1,278 · +3.2% YoY. Source: county tax records.
Cash-flow waterfall
monthlySold comps — $/sqft
last 12 mo · ≤1 miLoading sold comps…