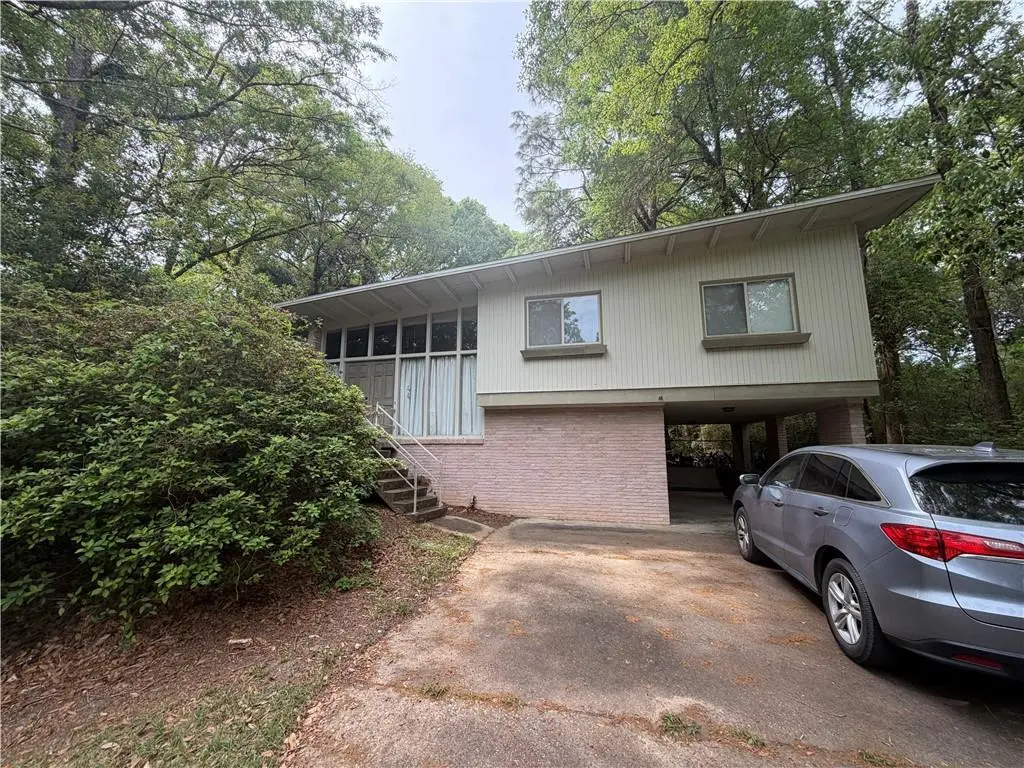
4160 Aldebaran Way · Mobile, AL
Flood risk 3/10 · Minor
- FEMA flood zone
- X (unshaded)
- Chance of flooding over 30 yrs
- 0.2%
- Est. flood insurance / yr
- $473 – $860
Fire risk 1/10 · Minimal
- Est. fire insurance / yr
- $916 – $1,700
Heat risk 9/10 · Severe
- Hot days now (above 105°F)
- 7 days/yr
- Hot days in 30 yrs
- 21 days/yr
Wind risk 9/10 · Severe
- Chance of severe wind over 30 yrs
- 99.0%
Air-quality risk 1/10 · Minimal
- Unhealthy air days now
- 0 days/yr
- Unhealthy air days in 30 yrs
- 0 days/yr
Risk factors via First Street. Map © Google.
Why this score? — see what drove the B grade
The composite is a weighted blend of 9 inputs, each scored 0–100. Each bar is that input's sub-score; the figure is the points it added to the 100-point composite (weight × sub-score).
- Cash flow +28.1/30.0
- ARV discount +15.0/15.0
- DSCR +10.0/10.0
- 1% rule +6.7/10.0
- Livability +3.8/5.0
- Rent growth +2.6/5.0
- Condition / age +2.5/5.0
- Schools +2.3/10.0
- Appreciation +0.0/10.0
$135,000
🖨 Deal sheet 📄 Offer letter ✓ Due diligence
Listing remarks MLS
Calling all investors. If your looking for your next project you must check this one out. This house is priced to sell quickly. Sold as is with no seller repairs. Split level house home with a covered carport. The seller just had an in house estate sale and most tings are gone. Some items inside are still for sale. Don't miss you oppertunity so schedule your private tour today.
Key facts
- Covered carport
- Split level house
- 0.55 acre lot
Tags
Neighborhood map
What this means for you Summary
Snapshot
- This is a 3-bed/1.5-bath single-family listed at $135k.
Deal economics
- At list price, monthly cash flow is $422 ($5k/yr) — positive.
- The deal already cash-flows at list — no discount required.
- Meets the 1% rule at list price ($2k rent vs $135k).
- Recommended offer: $131k (3.0% below list) — sets the bar for market timing.
- Cap rate 10.0% vs local median 4.9% in Mobile — top-decile yield for the area; either an underpriced asset or a hidden risk that comps aren't pricing in. Stress-test before assuming the spread holds.
Location & tenants
- Location reads 75/100 on livability (#20 in AL, #4,262 nationally) — a middle-class / working-renter tenant base. Strengths: commute A+, cost of living A+, housing A+; Watch: schools D-, crime F, employment D-.
- Mobile County (urban): math 15% / reading 39% proficiency, ranked #81 of 129 in AL (top 63%) — low school quality limits family demand, transient renter base, plan for 1-2y turnover; 67% free/reduced lunch — lower-income household profile, screen leases tightly.
- Market conditions: Rents flat; 142 active listings in the ZIP; 13 comparable units currently listed for rent nearby; rentals lingering (median 44d on market — plan ~5-8 weeks vacancy on turnover, expect pricing pressure); 54% of comp listings sitting > 30 days — soft ceiling on asking rent; 1,678 units permitted in Mobile County in 2024 (264 in 5+ unit buildings).
Forward outlook
- Local home prices are declining (-3.0%/yr); year-one equity from $933 of loan paydown is wiped out by about $4k of value loss. Plan a longer hold.
- Mobile County population projected to shrink 8% by 2050 — rents likely to lag national; underwrite the cash flow, not the appreciation.
Negotiation context
- It's been on market 31 days — a 3% lower offer ($131k) is reasonable based on typical stale-listing flexibility.
Risks & watch-outs
- Climate carrying-cost: severe wind risk, 99% chance of damaging wind over 30y; extreme-heat days projected 7→21/yr by 2055 (HVAC capex compounding) — expect insurance premiums to compound above CPI over the hold.
Questions for the listing agent
- It's been on market 31 days. Have you received any prior offers? Is the seller open to a 3% concession, seller financing, or rate buy-down credit?
- Is there a deadline driving the sale (1031 exchange, divorce, estate, relocation)? That informs how much negotiation room exists.
- Schools are D-rated, which usually means shorter tenancies and higher turnover. Who's the typical renter profile here, and what's been the actual vacancy rate?
- Crime grade is F in this area — have there been break-ins, vandalism, or insurance claims at this property in the last 3 years? What carrier currently insures it and at what premium?
- What's the average days-on-market for RENTAL listings here right now (not sales)? A rising rental-DOM trend means longer vacancies and softer asking-rent achievability than the comps imply.
- What's the recent tenant-quality profile in this submarket — average credit score on applications, eviction rate, late-payment / NSF rate, and stable-employment percentage? A property-management company in the area should have these aggregated.
- How much new for-sale + rental construction is in the pipeline within 1–3 miles? Heavy new supply typically softens prices + rents 12–24 months out; constrained supply supports both.
Investment metrics
- 1% rule
- 1.17% ✓
- Cap rate
- 10.05%
- Cash-on-cash
- 13.41%
- DSCR
- 1.60
- GRM
- 7.1
CMA / ARV
- ARV (median comp)
- $212,567
- List price
- $135,000
- Delta
- -36.49%
- Verdict
- UNDERPRICED
- Comps
- 20 within 1.0 mi
Show comp detail 12 sales within ~0.75 mi
| Address | Dist | Beds/Ba | Sqft | Sold | Price | $/sf | Match |
|---|---|---|---|---|---|---|---|
| 4160 Aldebaran Way | 0.00mi | 3/2.0 | 1,719 (0%) | 1mo | $127,500 | $74 | 97 |
| 4158 Highway 90 Dr | 0.19mi | 3/1.0 | 1,688 (-2%) | 1mo | $183,000 | $108 | 85 |
| 4270 Taurus Dr | 0.20mi | 3/2.0 | 1,746 (+2%) | 6mo | $218,000 | $125 | 81 |
| 1409 ALTAIR Ln | 0.28mi | 3/2.0 | 1,689 (-2%) | 2mo | $295,000 | $175 | 80 |
| 4203 Arcturus Ln | 0.05mi | 4/1.5 (+1) | 1,549 (-10%) | 0mo | $189,000 | $122 | 76 |
| 1226 Barcelona Dr | 0.43mi | 3/2.0 | 1,614 (-6%) | 1mo | $239,500 | $148 | 66 |
| 4117 Beacon Ln | 0.65mi | 3/2.0 | 1,721 (+0%) | 7mo | $279,900 | $163 | 62 |
| 3155 Maudelayne Dr E | 0.65mi | 3/2.0 | 1,770 (+3%) | 6mo | $155,000 | $88 | 58 |
| 4254 Spring Valley Dr S | 0.71mi | 3/2.0 | 1,781 (+4%) | 4mo | $228,000 | $128 | 56 |
| 1420 Vega Dr | 0.46mi | 3/1.0 | 1,890 (+10%) | 7mo | $187,000 | $99 | 54 |
| 1309 W Rainbow Dr | 0.57mi | 4/2.0 (+1) | 1,895 (+10%) | 6mo | $185,000 | $98 | 44 |
| 3150 Maudelayne Dr | 0.67mi | 2/2.0 (-1) | 1,908 (+11%) | 3mo | $234,900 | $123 | 41 |
Match score weights: distance 35% · size 25% · config 20% · recency 20%. Top-matched comps best support the ARV.
Projected returns pro-forma
-3.0% appreciation · 0.24% rent growth · sell at horizon
- IRR
- 0.5%
- Equity multiple
- 1.02×
- Total profit
- $715
- Equity at exit
- $20,129
- IRR
- 7.4%
- Equity multiple
- 1.49×
- Total profit
- $18,528
- Equity at exit
- $11,672
Cash invested: $37,800 (down + closing). Projections, not guarantees.
Landlord ↔ Tenant lean methodology
- Overall (STATE)
- 90 Strongly Landlord-Friendly
- State Alabama
- 90 Strongly Landlord-Friendly · R+15
- County
- — inherits STATE
- City
- — inherits STATE
ZIP-level market 36693
- Home prices YoY
- -28.1%
- Rents YoY
- 0.2%
- Active inventory
- 142
- Price-to-rent
- 7.1×
Monthly cashflow live
- Estimated rent
- $1,578 high interval (Pro) →
- Mortgage (P&I)
- −$708
- Tax from tax record
- −$60 /mo · $717/yr
- Insurance
- −$56
- HOA
- −$0
- Vacancy / Maint / Mgmt
- −$331
- Net cashflow
- $422
Break-even live
UW: 25.0% down · 7.5% · 30yr · 1.5% tax · 5.0% vac · 8.0% maint · 8.0% mgmt
Financing live
Cash to close
- Down payment
- $33,750
- Closing costs
- $4,050
- Reserves months
- —
- Total cash needed
- —
Loan-product check · same deal, 3 products live
Conventional
25% down · 7.5% · 30yr
- Down + closing
- —
- Monthly P&I
- —
- Monthly cashflow
- —
- DSCR
- —
- Eligible?
- —
Personal DTI + credit; lowest rate.
DSCR
20% down · 8.5% · 30yr
- Down + closing
- —
- Monthly P&I
- —
- Monthly cashflow
- —
- DSCR
- —
- Eligible?
- —
No personal income docs; deal must DSCR.
Hard money
10% down · 12.0% · 12mo
- Down + closing
- —
- Monthly P&I
- —
- Monthly cashflow
- —
- DSCR
- —
- Eligible?
- —
Short-term bridge; refi at stabilization.
Rent comps 13 comps
| Address | Beds | Baths | Sqft | Rent | $/sqft | DOM | Units | Dist |
|---|---|---|---|---|---|---|---|---|
| 4273 Vega Dr Mobile, AL | 3.0 | 1.5 | 1300 | $1,600 | $1.23 | 43d | 1 | 0.30mi |
| 4861 Woodcliff Dr N Mobile, AL | 3.0 | 2.0 | 1610 | $1,300 | $0.81 | 43d | 1 | 0.33mi |
| 4361 Montclair Cir E Mobile, AL | 3.0 | 2.0 | 1456 | $1,700 | $1.17 | 43d | 1 | 0.77mi |
| 2754 Seaton Ct Mobile, AL | 3.0 | 2.5 | 1640 | $1,950 | $1.19 | 13d | 1 | 0.96mi |
| 1611 Rochelle St Mobile, AL | 3.0 | 2.0 | 1085 | $1,650 | $1.52 | 21d | 1 | 0.96mi |
| 4950 Government Blvd Mobile, AL | 1.0–4.0 | 1.0–2.5 | 1225 | $1,321 | $1.08 | 13d | 7 | 1.24mi |
| 713 Raines Dr Mobile, AL | 4.0 | 2.0 | 1600 | $1,858 | $1.16 | 13d | 1 | 1.38mi |
| 4017 Cottage Hill Rd Mobile, AL | 3.0 | 2.5 | 1616 | $1,495 | $0.93 | 43d | 1 | 1.42mi |
| 4017 Cottage Hill Rd #69 Mobile, AL | 3.0 | 2.5 | 1616 | $1,495 | $0.93 | 21d | 1 | 1.42mi |
| 4213 Malibar Dr Mobile, AL | 3.0 | 1.0 | 1100 | $1,458 | $1.33 | 21d | 1 | 1.44mi |
| 4242 Marmora Dr Mobile, AL | 3.0 | 1.5 | 1053 | $1,500 | $1.42 | 43d | 1 | 1.45mi |
| 3993 Cottage Hill Rd Mobile, AL | 2.0 | 1.5 | 1150 | $895 | $0.78 | 43d | 1 | 1.45mi |
| 4077 Lancewood Dr S Mobile, AL | 4.0 | 1.0 | 1283 | $1,600 | $1.25 | 43d | 1 | 1.49mi |
Listing history 4 events
-
2026-05-03status Pending 387-char remark
Show marketing remark (387 chars)
Calling all investors. If your looking for your next project you must check this one out. This house is priced to sell quickly. Sold as is with no seller repairs. Split level house home with a covered carport. The seller just had an in house estate sale and most tings are gone. Some items inside are still for sale. Don't miss you oppertunity so schedule your private tour today.
-
2026-04-28price $135,000 387-char remark
Show marketing remark (387 chars)
Calling all investors. If your looking for your next project you must check this one out. This house is priced to sell quickly. Sold as is with no seller repairs. Split level house home with a covered carport. The seller just had an in house estate sale and most tings are gone. Some items inside are still for sale. Don't miss you oppertunity so schedule your private tour today.
-
2026-04-13price $138,500 387-char remark
Show marketing remark (387 chars)
Calling all investors. If your looking for your next project you must check this one out. This house is priced to sell quickly. Sold as is with no seller repairs. Split level house home with a covered carport. The seller just had an in house estate sale and most tings are gone. Some items inside are still for sale. Don't miss you oppertunity so schedule your private tour today.
-
2026-04-02$147,500 Active 387-char remark
Show marketing remark (387 chars)
Calling all investors. If your looking for your next project you must check this one out. This house is priced to sell quickly. Sold as is with no seller repairs. Split level house home with a covered carport. The seller just had an in house estate sale and most tings are gone. Some items inside are still for sale. Don't miss you oppertunity so schedule your private tour today.
ⓘ Source: listings_history table (triggers on properties + properties_extension) + one-shot
backfill from property_details.listing_events for pre-trigger history.
Tax reassessment forecast AL · Resets to sale price
- Current annual tax
- $717 · $60/mo
- Projected year-2 tax
- $717 · $60/mo
- Expected delta
- $0/yr ($0/mo · 0.0%)
ⓘ Screening estimate from a state-policy table — verify with the county assessor before closing.
Climate risk First Street
- Flood 3/10 Moderate FEMA zone X (unshaded) · 20% chance over 30 yrs
- Wildfire 1/10 Low
- Heat 9/10 Extreme 7 d/yr ≥105°F today · 21 d/yr by 30 yrs out
- Wind 9/10 Extreme 99% chance of damaging wind over 30 yrs
- Air quality 1/10 Low 0 unhealthy d/yr today · 0 by 30 yrs out
Nearby sold comps map
Loading sold comps map…
Walkable amenities ~0.75 mi
Loading nearby amenities…
Taxation est. · year 1
- Rental income
- $18,931
- − Mortgage interest
- −$7,562
- − Property taxes
- −$717
- − Insurance
- −$675
- − Repairs & maintenance
- −$1,514
- − Management
- −$1,514
- − Depreciation
- −$3,927
- Taxable income
- $3,020
- Est. tax owed @ 24.0%
- −$725
- After-tax cash flow
- $4,343/yr
For passive investors: Depreciation is non-cash, so a rental often shows a tax loss while cash-flowing — sheltering income. Rental losses are passive: they offset passive income freely, and up to $25,000/yr can offset ordinary (W-2) income if you actively participate and your MAGI is under $100k (phasing out to $0 by $150k); unused losses carry forward. On sale, claimed depreciation is recaptured at up to 25%, and gains may owe capital-gains tax (a 1031 exchange can defer both). Figures are a year-1 estimate at your 24.0% rate — not tax advice; consult a CPA.
Schools (NCES district)
- District
- Mobile County
- NCES district ID
- 0102370
- Math proficiency
- 15% ▼ -28.00%
- Reading proficiency
- 39% ▬ 0.00%
- Median HH income
- $42,455
- Composite
- 22.9/100
- National rank
- #8002
- State rank
- #81 of 129 in AL
Livability — Mobile
- Score
- 75/100
- State rank
- #20
- US rank
- #4262
Category grades
Schools grade is shown separately in the Schools card above.
Census & demographics
- Census place
- Mobile, AL
- County
- Mobile County · 246,577 people
- City population
- 205,729
- Metro
- Mobile, AL
- Population (ZIP)
- 18,726
- Household income
- $68,933
- Rent vs Own
- Severe rent burden
- 498.0
Population outlook (Mobile County) Hauer SSP2
- Today (2025)
- 415,303 people
- By 2030
- 411,755 · -0.9%
- By 2040
- 399,670 · -3.8%
- By 2050
- 382,616 · -7.9%
- By 2075
- 337,353 · -18.8%
- By 2100
- 283,391 · -31.8%
Race, ethnicity, and origin ACS 2023
- Neighborhood character
- Predominantly White (65%)
- Race & ethnicity
- White 65% Black 23% Hispanic / Latino 5% Asian 4% Two or more races 4%
- Common ancestry
- Slovak 4% Italian 3% Serbian 2%
- Foreign-born
- 8% · Canada, Vietnam
- Languages at home
- 90% English-only · Spanish 4% Tagalog/Filipino 2% Vietnamese 1%
Political lean MEDSL · Mobile
- 2024 margin
- R (+16.4) · D 41.3% · R 57.7%
- 2008→2024 swing
- -7.7pp toward R · 2008: -8.7pp · 2024: -16.4pp
- All cycles
- 2024: R+16.4 2020: R+11.9 2016: R+13.9 2012: R+9.3 2008: R+8.7
Not yet ingested
- Civics
- —
Market trends
- HPI YoY
- ▼ -71.22%
- Current HPI
- 182.6406
- Rent YoY
- ▲ 0.24%
- Metro
- Mobile, AL
- State GDP YoY
- ▲ 2.94%
- F500 in state
- 4
Industry mix (Fortune 500 HQ in AL)
| Industry | F500 HQs | Revenue |
|---|---|---|
| Financial Services | 1 | $8B |
|
||
| Healthcare | 1 | $5B |
|
||
Price history
-8.5% since first listed4 events — show timeline
- 2026-05-03 Pending — GCMLS AL
- 2026-04-28 Price Changed $135,000 GCMLS AL
- 2026-04-13 Price Changed $138,500 GCMLS AL
- 2026-04-02 Listed $147,500 GCMLS AL
Property tax history
+18.9%/yrLatest (2025): $717 · +99.9% YoY. Source: county tax records.
Cash-flow waterfall
monthlySold comps — $/sqft
last 12 mo · ≤1 miLoading sold comps…