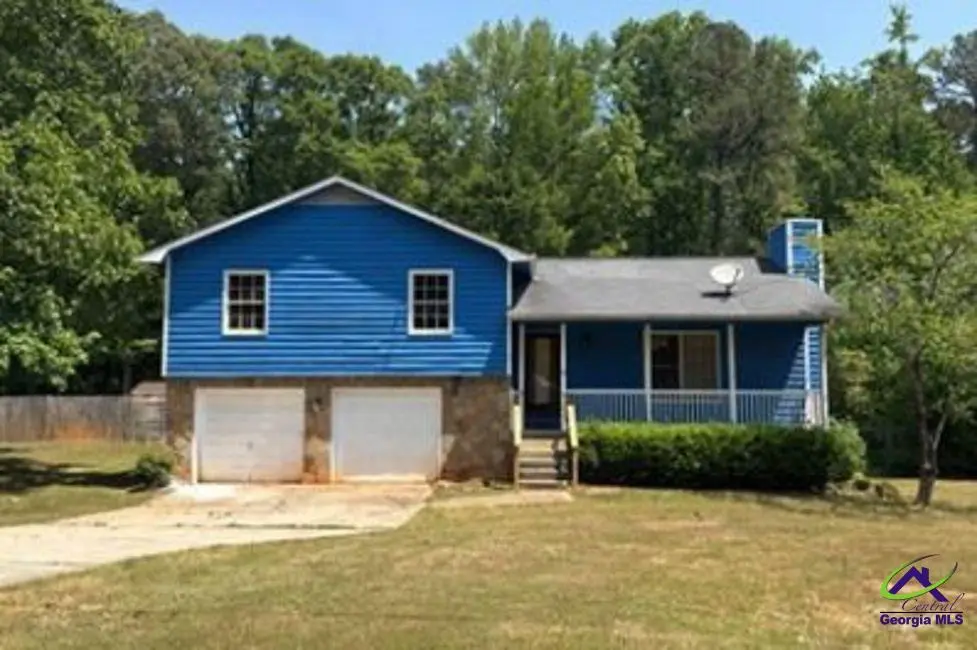
137 Longview Rd · Stockbridge, GA
Flood risk 1/10 · Minimal
- FEMA flood zone
- X (unshaded)
- Chance of flooding over 30 yrs
- 0.0%
- Est. flood insurance / yr
- $507 – $1,088
Fire risk 3/10 · Minor
- Est. fire insurance / yr
- $963 – $1,789
Heat risk 6/10 · Moderate
- Hot days now (above 106°F)
- 7 days/yr
- Hot days in 30 yrs
- 18 days/yr
Wind risk 6/10 · Moderate
- Chance of severe wind over 30 yrs
- 27.0%
Air-quality risk 4/10 · Minor
- Unhealthy air days now
- 5 days/yr
- Unhealthy air days in 30 yrs
- 7 days/yr
Risk factors via First Street. Map © Google.
Why this score? — see what drove the B- grade
The composite is a weighted blend of 9 inputs, each scored 0–100. Each bar is that input's sub-score; the figure is the points it added to the 100-point composite (weight × sub-score).
- Cash flow +24.1/30.0
- ARV discount +15.0/15.0
- DSCR +7.8/10.0
- 1% rule +7.4/10.0
- Livability +3.0/5.0
- Rent growth +2.7/5.0
- Schools +2.6/10.0
- Condition / age +2.5/5.0
- Appreciation +0.0/10.0
$147,556
🖨 Deal sheet (PDF) 📄 Offer letter ✓ Due diligence
Listing remarks
Offers to be placed on Xome.com. Interior inspections are not available, do not trespass! Forward all inquiries and questions to Xome Customer Service . NO REPRESENTATION TO VALIDITY OF INFORMATION IS MADE, BUYER TO VERIFY ALL INFORMATION WHERIN.
Key facts
- 1,306 sq ft lot
- 2 garage spots
- Built 1984
Property features AI
Finance
- Other: Located in the Bridgewood subdivision
Exterior
- Parking: Attached garage with 2 spaces
- Home design: Single-family detached residence; One-story
- Construction: Wood siding; Slab foundation; Built with crawl space
- Exterior features: Small lot (approx. 0.03 acres); Crawl space foundation
Interior
- Bathrooms: 2 full bathrooms; 1 half bathroom
- Heating & cooling: Central heating (electric); Central air conditioning
- Interior features: Fireplace (1)
Neighborhood map
What this means for you Summary
Snapshot
- This is a 3-bed/2.5-bath single-family listed at $148k.
Deal economics
- At list price, monthly cash flow is $291 ($3k/yr) — positive.
- The deal already cash-flows at list — no discount required.
- Meets the 1% rule at list price ($2k rent vs $148k).
- Recommended offer: $145k (1.5% below list) — sets the bar for market timing.
- Cap rate 8.7% vs local median 4.2% in Stockbridge — top-decile yield for the area; either an underpriced asset or a hidden risk that comps aren't pricing in. Stress-test before assuming the spread holds.
Location & tenants
- Location reads 60/100 on livability (#389 in GA) — a middle-class / working-renter tenant base. Strengths: housing A+, cost of living A; Watch: crime D, amenities F, commute F.
- Henry County (rural): math 24% / reading 33% proficiency, ranked #89 of 174 in GA (top 51%) — low school quality limits family demand, transient renter base, plan for 1-2y turnover.
- Zoned schools: Cotton Indian Elementary School (math 10% / reading 18%, grade F, #1,025 of 1,228 statewide, top 84%, 573 students, 67% FRL); Stockbridge Middle School (math 11% / reading 22%, grade F, #388 of 470 statewide, top 83%, 611 students, 70% FRL); Stockbridge High School (math 5% / reading 28%, grade F, #284 of 424 statewide, top 67%, 1,543 students, 54% FRL) — zoned schools average 64% FRL vs 43% district-wide (21 pts higher); higher-poverty schools than district average — tighter screening recommended.
- Zoned-school proficiency averages 16% at this address vs 28% district-wide (-13 pts) — the specific schools serving this property underperform the Henry County average; the district grade overstates school quality for this exact location.
- Market conditions: Rents flat; 611 active listings in the ZIP; 9 comparable units currently listed for rent nearby; rentals at typical pace (median 17d on market — plan ~3-4 weeks tenant-placement turnaround); 44% of comp listings sitting > 30 days — soft ceiling on asking rent; 1,989 units permitted in Henry County in 2024 (92 in 5+ unit buildings).
- This rent runs 31% of the median local income ($71k/yr) — at the standard rent-burdened threshold; future hikes will face affordability resistance.
Forward outlook
- Local home prices are declining (-3.0%/yr); year-one equity from $1k of loan paydown is wiped out by about $4k of value loss. Plan a longer hold.
- Henry County population projected at +29% by 2050 — long-run rental-demand tailwind backs the buy-and-hold thesis.
Negotiation context
- It's been on market 23 days — a 2% lower offer ($145k) is reasonable based on typical stale-listing flexibility.
Risks & watch-outs
- Watch-outs: property tax is 2.6% of price.
- Climate carrying-cost: major wind risk, 27% chance of damaging wind over 30y; extreme-heat days projected 7→18/yr by 2055 (HVAC capex compounding) — expect insurance premiums to compound above CPI over the hold.
Questions for the listing agent
- Property tax is high relative to price — has the assessment been appealed recently, and will the sale trigger a re-assessment?
- Is there a deadline driving the sale (1031 exchange, divorce, estate, relocation)? That informs how much negotiation room exists.
- Schools are D-rated, which usually means shorter tenancies and higher turnover. Who's the typical renter profile here, and what's been the actual vacancy rate?
- Crime grade is D in this area — have there been break-ins, vandalism, or insurance claims at this property in the last 3 years? What carrier currently insures it and at what premium?
- What's the average days-on-market for RENTAL listings here right now (not sales)? A rising rental-DOM trend means longer vacancies and softer asking-rent achievability than the comps imply.
- What's the recent tenant-quality profile in this submarket — average credit score on applications, eviction rate, late-payment / NSF rate, and stable-employment percentage? A property-management company in the area should have these aggregated.
- How much new for-sale + rental construction is in the pipeline within 1–3 miles? Heavy new supply typically softens prices + rents 12–24 months out; constrained supply supports both.
Investment metrics
- 1% rule
- 1.24% ✓
- Cap rate
- 8.66%
- Cash-on-cash
- 8.44%
- DSCR
- 1.38
- GRM
- 6.7
CMA / ARV
- ARV (median comp)
- $252,664
- List price
- $147,556
- Delta
- -41.60%
- Verdict
- UNDERPRICED
- Comps
- 20 within 1.0 mi
Show comp detail 12 sales within ~0.75 mi
| Address | Dist | Beds/Ba | Sqft | Sold | Price | $/sf | Match |
|---|---|---|---|---|---|---|---|
| 105 Longview Cir | 0.12mi | 3/2.0 | 1,552 (-1%) | 3mo | $249,900 | $161 | 88 |
| 20 King Pl | 0.61mi | 3/2.0 | 1,570 (+0%) | 6mo | $256,900 | $164 | 64 |
| 115 Stillwater Rd | 0.13mi | 3/2.0 | 1,672 (+7%) | 22mo | $250,000 | $150 | 62 |
| 80 Glenn Burnie Dr | 0.44mi | 3/2.0 | 1,700 (+8%) | 8mo | $80,000 | $47 | 57 |
| 160 Springvalley Cir | 0.18mi | 4/2.0 (+1) | 1,774 (+13%) | 8mo | $263,000 | $148 | 56 |
| 155 Hickory Dr | 0.68mi | 3/2.5 | 1,721 (+10%) | 4mo | $299,000 | $174 | 48 |
| 245 Amanda Ct | 0.62mi | 3/2.0 | 1,356 (-14%) | 2mo | $245,000 | $181 | 45 |
| 349 Mays Rd | 0.47mi | 3/2.0 | 1,369 (-13%) | 13mo | $230,000 | $168 | 44 |
| 172 Edison Dr | 0.66mi | 3/2.0 | 1,503 (-4%) | 20mo | $290,900 | $194 | 44 |
| 240 Briarcliff Pl | 0.70mi | 4/2.0 (+1) | 1,394 (-11%) | 5mo | $249,000 | $179 | 38 |
| 75 Walker Dr | 0.72mi | 4/2.0 (+1) | 1,798 (+15%) | 2mo | $285,000 | $159 | 34 |
| 100 Mays Landing Rd | 0.67mi | 3/3.0 | 1,788 (+14%) | 17mo | $199,000 | $111 | 29 |
Match score weights: distance 35% · size 25% · config 20% · recency 20%. Top-matched comps best support the ARV.
Projected returns pro-forma
-3.0% appreciation · 0.87% rent growth · sell at horizon
- IRR
- -6.1%
- Equity multiple
- 0.78×
- Total profit
- $-9,129
- Equity at exit
- $22,001
- IRR
- 0.5%
- Equity multiple
- 1.03×
- Total profit
- $1,238
- Equity at exit
- $12,758
Cash invested: $41,316 (down + closing). Projections, not guarantees.
Landlord ↔ Tenant lean methodology
- Overall (STATE)
- 90 Strongly Landlord-Friendly
- State Georgia
- 90 Strongly Landlord-Friendly · R+3
- County
- — inherits STATE
- City
- — inherits STATE
ZIP-level market 30281
- Home prices YoY
- -33.6%
- Rents YoY
- 0.9%
- Active inventory
- 611
- Price-to-rent
- 6.7×
Monthly cashflow live
- Estimated rent
- $1,830 high interval (Pro) →
- Mortgage (P&I)
- −$774
- Tax from tax record
- −$319 /mo · $3,833/yr
- Insurance
- −$61
- HOA
- −$0
- Vacancy / Maint / Mgmt
- −$384
- Net cashflow
- $291
Break-even live
Sensitivity live
| Price | -10% $374 | -5% $332 | +0% $291 | +5% $249 | +10% $207 |
|---|---|---|---|---|---|
| Rent | -10% $146 | -5% $218 | +0% $291 | +5% $363 | +10% $435 |
| Rate | -1.0pp $365 | -0.5pp $328 | base $291 | +0.5pp $252 | +1.0pp $213 |
UW: 25.0% down · 7.5% · 30yr · 1.5% tax · 5.0% vac · 8.0% maint · 8.0% mgmt
Financing live
Cash to close
- Down payment
- $36,889
- Closing costs
- $4,427
- Reserves months
- —
- Total cash needed
- —
Loan-product check · same deal, 3 products live
Conventional
25% down · 7.5% · 30yr
- Down + closing
- —
- Monthly P&I
- —
- Monthly cashflow
- —
- DSCR
- —
- Eligible?
- —
Personal DTI + credit; lowest rate.
DSCR
20% down · 8.5% · 30yr
- Down + closing
- —
- Monthly P&I
- —
- Monthly cashflow
- —
- DSCR
- —
- Eligible?
- —
No personal income docs; deal must DSCR.
Hard money
10% down · 12.0% · 12mo
- Down + closing
- —
- Monthly P&I
- —
- Monthly cashflow
- —
- DSCR
- —
- Eligible?
- —
Short-term bridge; refi at stabilization.
Rent comps 9 comps
| Address | Beds | Baths | Sqft | Rent | $/sqft | DOM | Units | Dist |
|---|---|---|---|---|---|---|---|---|
| 217 Briarpatch Ct Stockbridge, GA | 3.0 | 2.0 | 1228 | $1,995 | $1.62 | 45d | 1 | 0.72mi |
| 141 Edison Dr Stockbridge, GA | 3.0 | 2.5 | 1621 | $1,701 | $1.05 | 45d | 1 | 0.81mi |
| 245 Pinehurst Dr Stockbridge, GA | 3.0 | 2.0 | 1340 | $1,706 | $1.27 | 45d | 1 | 0.86mi |
| 200 Pinehurst Dr Stockbridge, GA | 3.0 | 2.0 | 1200 | $1,595 | $1.33 | 13d | 1 | 0.94mi |
| 1515 Flat Rock Rd Stockbridge, GA | 3.0 | 2.0 | 1700 | $1,536 | $0.90 | 6d | 1 | 1.10mi |
| 70 Summerfield Ct Stockbridge, GA | 3.0 | 2.0 | 1444 | $1,795 | $1.24 | 45d | 1 | 1.28mi |
| 125 Cowan Dr Stockbridge, GA | 3.0 | 2.0 | 1710 | $1,920 | $1.12 | 16d | 1 | 1.33mi |
| 119 Lambert Dr Stockbridge, GA | 3.0 | 2.0 | 1392 | $1,800 | $1.29 | 6d | 1 | 1.44mi |
| 115 Rock Quarry Rd Stockbridge, GA | 2.0 | 1.0–2.0 | 1020 | $1,349 | $1.32 | 2d | 6 | 1.48mi |
Listing history 2 events
-
2026-04-27$147,556 Active 246-char remark
-
2002-11-06soldstatus $124,900
ⓘ Source: listings_history table (triggers on properties + properties_extension) + one-shot
backfill from property_details.listing_events for pre-trigger history.
Tax reassessment forecast GA · Resets to sale price
- Current annual tax
- $3,833 · $319/mo
- Projected year-2 tax
- $3,833 · $319/mo
- Expected delta
- $0/yr ($0/mo · 0.0%)
ⓘ Screening estimate from a state-policy table — verify with the county assessor before closing.
Climate risk First Street
- Flood 1/10 Low FEMA zone X (unshaded) · 0% chance over 30 yrs
- Wildfire 3/10 Moderate
- Heat 6/10 Major 7 d/yr ≥106°F today · 18 d/yr by 30 yrs out
- Wind 6/10 Major 27% chance of damaging wind over 30 yrs
- Air quality 4/10 Moderate 5 unhealthy d/yr today · 7 by 30 yrs out
Nearby sold comps map
Loading sold comps map…
Walkable amenities ~0.75 mi
Loading nearby amenities…
Taxation est. · year 1
- Rental income
- $21,955
- − Mortgage interest
- −$8,265
- − Property taxes
- −$3,833
- − Insurance
- −$738
- − Repairs & maintenance
- −$1,756
- − Management
- −$1,756
- − Depreciation
- −$4,293
- Taxable income
- $1,313
- Est. tax owed @ 24.0%
- −$315
- After-tax cash flow
- $3,172/yr
For passive investors: Depreciation is non-cash, so a rental often shows a tax loss while cash-flowing — sheltering income. Rental losses are passive: they offset passive income freely, and up to $25,000/yr can offset ordinary (W-2) income if you actively participate and your MAGI is under $100k (phasing out to $0 by $150k); unused losses carry forward. On sale, claimed depreciation is recaptured at up to 25%, and gains may owe capital-gains tax (a 1031 exchange can defer both). Figures are a year-1 estimate at your 24.0% rate — not tax advice; consult a CPA.
Schools (NCES district)
- District
- Henry County
- NCES district ID
- 1302820
- Math proficiency
- 24% ▼ -9.00%
- Reading proficiency
- 33% ▼ -7.00%
- Median HH income
- $62,594
- Composite
- 26.13/100
- National rank
- #7279
- State rank
- #89 of 174 in GA
Livability — Stockbridge
- Score
- 60/100
- State rank
- #389
- US rank
- #19479
Category grades
Schools grade is shown separately in the Schools card above.
Census & demographics
- County
- Henry County · 316,359 people
- City population
- 71,603
- Metro
- Atlanta-Sandy Springs-Alpharetta, GA
- Population (ZIP)
- 71,603
- Household income
- $71,213
- Rent vs Own
- Severe rent burden
- 2464.0
Population outlook (Henry County) Hauer SSP2
- Today (2025)
- 249,041 people
- By 2030
- 264,369 · +6.2%
- By 2040
- 294,459 · +18.2%
- By 2050
- 322,249 · +29.4%
- By 2075
- 392,310 · +57.5%
- By 2100
- 437,836 · +75.8%
Race, ethnicity, and origin ACS 2023
- Neighborhood character
- Diverse neighborhood (Simpson 0.61)
- Race & ethnicity
- Black 55% White 28% Hispanic / Latino 11% Two or more races 6% Asian 4%
- Hispanic origin (detail)
- Mexican 7%
- Common ancestry
- Hispanic 1% Italian 1% Romanian 1%
- Foreign-born
- 9% · Canada, Vietnam
- Languages at home
- 86% English-only · Spanish 8% Vietnamese 2% French/Haitian/Cajun 1%
Political lean MEDSL · Henry
- 2024 margin
- Strong D (+29.7) · D 64.5% · R 34.9%
- 2008→2024 swing
- +37.1pp toward D · 2008: -7.5pp · 2024: 29.7pp
- All cycles
- 2024: D+29.7 2020: D+20.5 2016: D+4.3 2012: R+3.2 2008: R+7.5
Not yet ingested
- Civics
- —
Market trends
- HPI YoY
- ▼ -104.76%
- Current HPI
- 207.2332
- Rent YoY
- ▲ 0.87%
- Metro
- Atlanta-Sandy Springs-Alpharetta, GA
- State GDP YoY
- ▲ 2.66%
- F500 in state
- 28
Industry mix (Fortune 500 HQ in GA)
| Industry | F500 HQs | Revenue |
|---|---|---|
| Paper / Packaging | 2 | $29B |
|
||
| Retail | 1 | $160B |
|
||
| Transportation / Logistics | 1 | $91B |
|
||
| Airlines | 1 | $62B |
|
||
| Consumer Goods | 1 | $47B |
|
||
| Utilities | 1 | $25B |
|
||
Price history
+31.7% since first listed4 events — show timeline
- 2026-06-05 Sold (MLS) $164,500 CGMLS
- 2026-05-21 Pending — CGMLS
- 2026-04-27 Listed $147,556 CGMLS
- 2002-11-06 Sold (Public Records) $124,900 Public Records
Property tax history
+5.7%/yrLatest (2025): $3,833 · +8.3% YoY. Source: county tax records.
Cash-flow waterfall
monthlySold comps — $/sqft
last 12 mo · ≤1 miLoading sold comps…