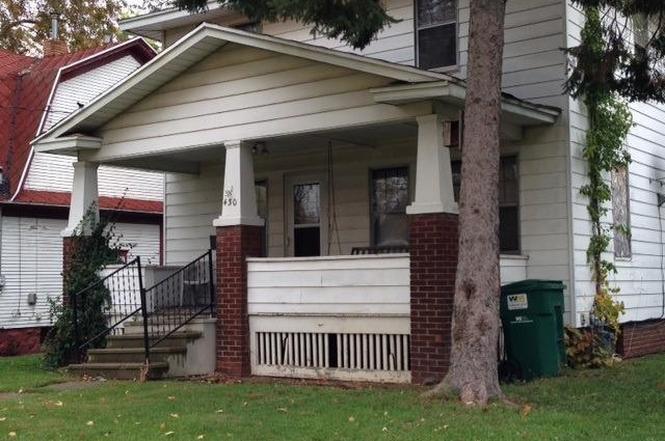
430 N 21st St · Springfield, MI
Flood risk 3/10 · Minor
- FEMA flood zone
- X (unshaded)
- Chance of flooding over 30 yrs
- 0.2%
- Est. flood insurance / yr
- $473 – $860
Fire risk 1/10 · Minimal
- Est. fire insurance / yr
- $784 – $1,456
Heat risk 3/10 · Minor
- Hot days now (above 98°F)
- 7 days/yr
- Hot days in 30 yrs
- 16 days/yr
Wind risk 2/10 · Minimal
- Chance of severe wind over 30 yrs
- —
Air-quality risk 3/10 · Minor
- Unhealthy air days now
- 2 days/yr
- Unhealthy air days in 30 yrs
- 3 days/yr
Risk factors via First Street. Map © Google.
Why this score? — see what drove the B+ grade
The composite is a weighted blend of 9 inputs, each scored 0–100. Each bar is that input's sub-score; the figure is the points it added to the 100-point composite (weight × sub-score).
- Cash flow +30.0/30.0
- ARV discount +15.0/15.0
- 1% rule +10.0/10.0
- DSCR +10.0/10.0
- Rent growth +5.0/5.0
- Livability +3.2/5.0
- Condition / age +2.5/5.0
- Schools +1.1/10.0
- Appreciation +0.0/10.0
$84,000
🖨 Deal sheet 📄 Offer letter ✓ Due diligence
Listing remarks
3 bedroom springfield home with full basement and 2 car garage serviced by alleyway. This is home requires work, but motivated sellers will consider all reasonable offers. If you seek to acquire property at bargain terms, do not let this home slip through your radar. Consider using the FHA 203K Re-Hab loan.
Key facts
- 5,663 sq ft lot
- 2 garage spots
- Built 1960
Neighborhood map
What this means for you Summary
Snapshot
- This is a 3-bed/1.0-bath single-family listed at $84k.
Deal economics
- At list price, monthly cash flow is $586 ($7k/yr) — positive.
- The deal already cash-flows at list — no discount required.
- Meets the 1% rule at list price ($1k rent vs $84k).
- Cap rate 14.7% vs local median 2.0% in Springfield — top-decile yield for the area; either an underpriced asset or a hidden risk that comps aren't pricing in. Stress-test before assuming the spread holds.
Location & tenants
- Location reads 65/100 on livability (#472 in MI) — a middle-class / working-renter tenant base. Strengths: cost of living A+, housing A+; Watch: crime C-, schools F, amenities F.
- Battle Creek Public Schools (urban): math 8% / reading 19% proficiency, ranked #510 of 540 in MI (top 94%) — low school quality limits family demand, transient renter base, plan for 1-2y turnover; 75% free/reduced lunch — lower-income household profile, screen leases tightly.
- Market conditions: Rents rising fast (+11.8%/yr); 236 active listings in the ZIP; 2 comparable units currently listed for rent nearby; lower-income renter base — watch delinquency; 132 units permitted in Calhoun County in 2024 (0 in 5+ unit buildings).
- This rent runs 40% of the median local income ($43k/yr) — at the standard rent-burdened threshold; future hikes will face affordability resistance.
Forward outlook
- Local home prices are declining (-3.0%/yr); year-one equity from $581 of loan paydown is wiped out by about $3k of value loss. Plan a longer hold.
- Calhoun County population projected at -16% by 2050 — secular population decline; favor cash flow + early exit over multi-decade hold.
- At projected returns (-3.0% appreciation + 8.0% rent growth), your $24k cash investment doubles in ~4 years — after that, you're playing with house money.
Negotiation context
- Only 4 days on market — expect competitive offers; lowballing is unlikely to land.
- 5 sale attempts since 12y ago with the ask held roughly flat each time — persistent listings suggest the price (not the market) is what's stuck; bring a comps-based counter.
- Current owner paid $12k; list at $84k implies a 600% gain — meaningful room to come down on a strong offer.
Questions for the listing agent
- Built in 1960 — when were the roof, HVAC, electrical panel, plumbing, and water heater last replaced?
- Is there a deadline driving the sale (1031 exchange, divorce, estate, relocation)? That informs how much negotiation room exists.
- Schools are F-rated, which usually means shorter tenancies and higher turnover. Who's the typical renter profile here, and what's been the actual vacancy rate?
- What's the average days-on-market for RENTAL listings here right now (not sales)? A rising rental-DOM trend means longer vacancies and softer asking-rent achievability than the comps imply.
- What's the recent tenant-quality profile in this submarket — average credit score on applications, eviction rate, late-payment / NSF rate, and stable-employment percentage? A property-management company in the area should have these aggregated.
- How much new for-sale + rental construction is in the pipeline within 1–3 miles? Heavy new supply typically softens prices + rents 12–24 months out; constrained supply supports both.
Investment metrics
- 1% rule
- 1.69% ✓
- Cap rate
- 14.66%
- Cash-on-cash
- 29.88%
- DSCR
- 2.33
- GRM
- 4.9
CMA / ARV
- ARV (median comp)
- $118,338
- List price
- $84,000
- Delta
- -29.02%
- Verdict
- UNDERPRICED
- Comps
- 20 within 1.0 mi
Show comp detail 8 sales within ~0.75 mi
| Address | Dist | Beds/Ba | Sqft | Sold | Price | $/sf | Match |
|---|---|---|---|---|---|---|---|
| 634 Upton Ave | 0.18mi | 3/2.0 | 1,240 (+8%) | 22mo | $82,000 | $66 | 57 |
| 412 N 22nd St | 0.09mi | 3/1.5 | 1,008 (-12%) | 20mo | $40,000 | $40 | 56 |
| 170 Nettles St | 0.48mi | 3/1.0 | 1,054 (-8%) | 10mo | $139,900 | $133 | 55 |
| 396 & 398 N 20th St | 0.27mi | 2/2.0 (-1) | 992 (-14%) | 2mo | $240,000 | $242 | 53 |
| 1131 Frisbie Blvd | 0.72mi | 3/1.0 | 1,054 (-8%) | 5mo | $155,000 | $147 | 48 |
| 267 24th St N | 0.73mi | 4/1.0 (+1) | 1,080 (-6%) | 10mo | $156,000 | $144 | 43 |
| 114 Wellworth Ave | 0.71mi | 3/1.5 | 988 (-14%) | 6mo | $135,000 | $137 | 36 |
| 1104 Frisbie Blvd | 0.65mi | 3/1.0 | 1,306 (+13%) | 14mo | $147,000 | $113 | 36 |
Match score weights: distance 35% · size 25% · config 20% · recency 20%. Top-matched comps best support the ARV.
Projected returns pro-forma
-3.0% appreciation · 8.0% rent growth · sell at horizon
- IRR
- 29.8%
- Equity multiple
- 2.33×
- Total profit
- $31,181
- Equity at exit
- $12,525
- IRR
- 39.8%
- Equity multiple
- 5.65×
- Total profit
- $109,270
- Equity at exit
- $7,263
Cash invested: $23,520 (down + closing). Projections, not guarantees.
Landlord ↔ Tenant lean methodology
- Overall (STATE)
- 62 Landlord-Friendly
- State Michigan
- 62 Landlord-Friendly · EVEN
- County
- — inherits STATE
- City
- — inherits STATE
ZIP-level market 49037
- Home prices YoY
- -29.0%
- Rents YoY
- 11.8%
- Active inventory
- 236
- Price-to-rent
- 4.9×
Monthly cashflow live
- Estimated rent
- $1,418 medium interval (Pro) →
- Mortgage (P&I)
- −$441
- Tax from tax record
- −$59 /mo · $708/yr
- Insurance
- −$35
- HOA
- −$0
- Vacancy / Maint / Mgmt
- −$298
- Net cashflow
- $586
Break-even live
UW: 25.0% down · 7.5% · 30yr · 1.5% tax · 5.0% vac · 8.0% maint · 8.0% mgmt
Financing live
Cash to close
- Down payment
- $21,000
- Closing costs
- $2,520
- Reserves months
- —
- Total cash needed
- —
Loan-product check · same deal, 3 products live
Conventional
25% down · 7.5% · 30yr
- Down + closing
- —
- Monthly P&I
- —
- Monthly cashflow
- —
- DSCR
- —
- Eligible?
- —
Personal DTI + credit; lowest rate.
DSCR
20% down · 8.5% · 30yr
- Down + closing
- —
- Monthly P&I
- —
- Monthly cashflow
- —
- DSCR
- —
- Eligible?
- —
No personal income docs; deal must DSCR.
Hard money
10% down · 12.0% · 12mo
- Down + closing
- —
- Monthly P&I
- —
- Monthly cashflow
- —
- DSCR
- —
- Eligible?
- —
Short-term bridge; refi at stabilization.
Rent comps 2 comps
| Address | Beds | Baths | Sqft | Rent | $/sqft | DOM | Units | Dist |
|---|---|---|---|---|---|---|---|---|
| 449 24th St N Springfield, MI | 3.0 | 1.5 | 1227 | $1,550 | $1.26 | 43d | 1 | 0.19mi |
| 420 Arbor Pointe Dr Battle Creek, MI | 1.0–2.0 | 1.0 | 820 | $1,140 | $1.39 | 13d | 6 | 0.73mi |
Listing history 14 events
-
2026-06-19days on market $84,000 Active 4 DOM
-
2026-06-18days on market $84,000 Active 3 DOM
-
2026-06-17days on market $84,000 Active 2 DOM
-
2026-06-15statusdays on market $84,000 Active 1 DOM
-
2026-05-12historical
-
2026-05-06status Active
-
2026-05-06status Active
-
2026-05-06status Pending
-
2026-05-06status Pending
-
2026-05-06historical
-
2026-01-11$84,000 Active
-
2026-01-11$84,000 Active
-
2014-04-11soldstatus $12,000
-
2014-03-09$18,000
ⓘ Source: listings_history table (triggers on properties + properties_extension) + one-shot
backfill from property_details.listing_events for pre-trigger history.
Tax reassessment forecast MI · Partial reset (capped growth)
- Current annual tax
- $708 · $59/mo
- Projected year-2 tax
- $1,001 · $83/mo
- Expected delta
- +$293/yr (+$24/mo · 41.3%)
ⓘ Screening estimate from a state-policy table — verify with the county assessor before closing.
Climate risk First Street
- Flood 3/10 Moderate FEMA zone X (unshaded) · 20% chance over 30 yrs
- Wildfire 1/10 Low
- Heat 3/10 Moderate 7 d/yr ≥98°F today · 16 d/yr by 30 yrs out
- Wind 2/10 Low
- Air quality 3/10 Moderate 2 unhealthy d/yr today · 3 by 30 yrs out
Nearby sold comps map
Loading sold comps map…
Walkable amenities ~0.75 mi
Loading nearby amenities…
Taxation est. · year 1
- Rental income
- $17,017
- − Mortgage interest
- −$4,705
- − Property taxes
- −$708
- − Insurance
- −$420
- − Repairs & maintenance
- −$1,361
- − Management
- −$1,361
- − Depreciation
- −$2,444
- Taxable income
- $6,017
- Est. tax owed @ 24.0%
- −$1,444
- After-tax cash flow
- $5,585/yr
For passive investors: Depreciation is non-cash, so a rental often shows a tax loss while cash-flowing — sheltering income. Rental losses are passive: they offset passive income freely, and up to $25,000/yr can offset ordinary (W-2) income if you actively participate and your MAGI is under $100k (phasing out to $0 by $150k); unused losses carry forward. On sale, claimed depreciation is recaptured at up to 25%, and gains may owe capital-gains tax (a 1031 exchange can defer both). Figures are a year-1 estimate at your 24.0% rate — not tax advice; consult a CPA.
Schools (NCES district)
- District
- Battle Creek Public Schools
- NCES district ID
- 2600005
- Math proficiency
- 8% ▼ -2.00%
- Reading proficiency
- 19% ▬ 0.00%
- Median HH income
- $31,697
- Composite
- 10.73/100
- National rank
- #9769
- State rank
- #510 of 540 in MI
Livability — Springfield
- Score
- 65/100
- State rank
- #472
- US rank
- #13384
Category grades
Schools grade is shown separately in the Schools card above.
Census & demographics
- Census place
- Springfield, MI
- County
- Calhoun County · 91,590 people
- Metro
- Battle Creek, MI
- Population (ZIP)
- 20,550
- Household income
- $42,690
- Rent vs Own
- Severe rent burden
- 717.0
Population outlook (Calhoun County) Hauer SSP2
- Today (2025)
- 130,157 people
- By 2030
- 126,691 · -2.7%
- By 2040
- 118,517 · -8.9%
- By 2050
- 109,855 · -15.6%
- By 2075
- 90,486 · -30.5%
- By 2100
- 70,766 · -45.6%
Race, ethnicity, and origin ACS 2023
- Neighborhood character
- Diverse neighborhood (Simpson 0.60)
- Race & ethnicity
- White 58% Black 23% Two or more races 11% Hispanic / Latino 7% Asian 3%
- Hispanic origin (detail)
- Mexican 5% Puerto Rican 1%
- Common ancestry
- Slovak 3% Romanian 2% Lithuanian 2%
- Foreign-born
- 4% · Canada, Philippines
- Languages at home
- 92% English-only · Spanish 4% Other Asian/Pacific 2% Other Indo-European 1%
Political lean MEDSL · Calhoun
- 2024 margin
- R (+14.1) · D 42.3% · R 56.4% · Other 1.3%
- 2008→2024 swing
- -23.4pp toward R · 2008: 9.4pp · 2024: -14.1pp
- All cycles
- 2024: R+14.1 2020: R+11.1 2016: R+12.5 2012: D+1.6 2008: D+9.4
Not yet ingested
- Civics
- —
Market trends
- HPI YoY
- ▼ -111.62%
- Current HPI
- 273.2446
- Rent YoY
- ▲ 11.76%
- Metro
- Battle Creek, MI
- State GDP YoY
- ▲ 1.37%
- F500 in state
- 28
Industry mix (Fortune 500 HQ in MI)
| Industry | F500 HQs | Revenue |
|---|---|---|
| Automotive Parts | 3 | $48B |
|
||
| Automotive | 2 | $372B |
|
||
| Chemicals | 1 | $45B |
|
||
| Automotive Retail | 1 | $29B |
|
||
| Healthcare / Medical Devices | 1 | $23B |
|
||
| Automotive Technology | 1 | $20B |
|
||
Price history
+366.7% since first listed10 events — show timeline
- 2026-05-12 Listing Removed — MiRealSource-MiMLS
- 2026-05-06 Relisted — REALCOMP
- 2026-05-06 Relisted — MiRealSource-MiMLS
- 2026-05-06 Pending — REALCOMP
- 2026-05-06 Pending — MiRealSource-MiMLS
- 2026-05-06 Listing Removed — REALCOMP
- 2026-01-11 Listed $84,000 REALCOMP
- 2026-01-11 Listed $84,000 MiRealSource-MiMLS
- 2014-04-11 Sold (MLS) $12,000 REALCOMP
- 2014-03-09 Listed $18,000 REALCOMP
Property tax history
-0.6%/yrLatest (2025): $708 · -24.6% YoY. Source: county tax records.
Cash-flow waterfall
monthlySold comps — $/sqft
last 12 mo · ≤1 miLoading sold comps…