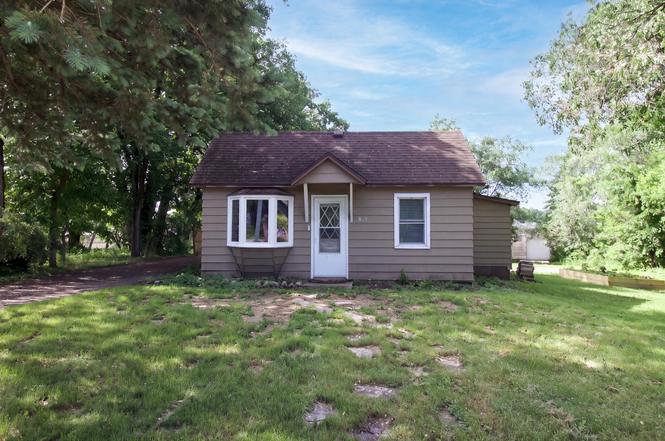
829 Willow St W · Detroit Lakes, MN
Flood risk 1/10 · Minimal
- FEMA flood zone
- X
- Chance of flooding over 30 yrs
- 0.0%
- Est. flood insurance / yr
- $473 – $860
Fire risk 5/10 · Moderate
- Est. fire insurance / yr
- $888 – $1,650
Heat risk 1/10 · Minimal
- Hot days now (above 96°F)
- 7 days/yr
- Hot days in 30 yrs
- 12 days/yr
Wind risk 1/10 · Minimal
- Chance of severe wind over 30 yrs
- —
Air-quality risk 3/10 · Minor
- Unhealthy air days now
- 2 days/yr
- Unhealthy air days in 30 yrs
- 2 days/yr
Risk factors via First Street. Map © Google.
Why this score? — see what drove the B- grade
The composite is a weighted blend of 9 inputs, each scored 0–100. Each bar is that input's sub-score; the figure is the points it added to the 100-point composite (weight × sub-score).
- Cash flow +30.0/30.0
- DSCR +10.0/10.0
- 1% rule +8.4/10.0
- ARV discount +7.5/15.0
- Schools +4.0/10.0
- Livability +4.0/5.0
- Rent growth +2.5/5.0
- Condition / age +2.5/5.0
- Appreciation +0.0/10.0
$209,900
🖨 Deal sheet (PDF) 📄 Offer letter ✓ Due diligence
Listing remarks MLS
MOVE IN READY HOME. Sweet 2 bedroom, 1 bath home with nice location to school, beach, parks, shopping/dining and downtown Detroit Lakes. Updated kitchen with SS appliances, 3/4 bath w tiled walk-in shower, cozy open space inside, clean lower-level for storage or perfect glam closet. Partially fenced yard with stained concrete patio and roomy 3 stall garage round out the package. Check the market...nothing move-in ready in this price point with this much going for it. Call today.
Key facts
- Insulated garage
- Updated finishes
- Move in ready
Tags
Property features AI
Exterior
- Parking: Attached or detached 3-car garage
- Utilities: City water connected; City sewer connected; Natural gas
- Home design: Residential one-story home; Entry level: main; Above-grade finished area 740 (living area)
- Construction: Asphalt roof; Poured concrete foundation; Block partial basement; Built with vinyl siding
- Exterior features: Vinyl exterior; Patio; Partial fencing; Lot approximately 0.52 acres (75 x 150)
Interior
- Kitchen: Includes Dishwasher, Microwave, Range, Refrigerator
- Bedrooms: 2 bedrooms
- Bathrooms: 1 full bathroom
- Heating & cooling: Forced air heating; Central air conditioning
- Interior features: Dishwasher, Microwave, Range, Refrigerator; Forced air heating; Central air conditioning; Has basement (block, partial)
- Laundry & utility: Laundry in basement
Neighborhood map
What this means for you Summary
Snapshot
- This is a 2-bed/1.0-bath single-family listed at $210k.
Deal economics
- At list price, monthly cash flow is $829 ($10k/yr) — positive.
- The deal already cash-flows at list — no discount required.
- Meets the 1% rule at list price ($3k rent vs $210k).
- Cap rate 11.0% vs local median 4.7% in Detroit Lakes — top-decile yield for the area; either an underpriced asset or a hidden risk that comps aren't pricing in. Stress-test before assuming the spread holds.
Location & tenants
- Location reads 80/100 on livability (#78 in MN, #1,847 nationally) — a professional / high-income tenant draw. Strengths: housing A+, health & safety A+, cost of living A; Watch: amenities F, commute F.
- Detroit Lakes Public School District (town): math 44% / reading 50% proficiency, ranked #155 of 301 in MN (top 52%) — families likely to look elsewhere, expect single-tenant / working-renter base with shorter leases.
- Market conditions: 307 active listings in the ZIP; 156 units permitted in Becker County in 2024 (0 in 5+ unit buildings).
Forward outlook
- Local home prices are declining (-3.0%/yr); year-one equity from $1k of loan paydown is wiped out by about $6k of value loss. Plan a longer hold.
- Becker County population projected at +4% by 2050 — modest demand growth; plan on rents tracking national, not racing it.
- At projected returns (-3.0% appreciation + 3.0% rent growth), your $59k cash investment doubles in ~8 years — after that, you're playing with house money.
Negotiation context
- Only 6 days on market — expect competitive offers; lowballing is unlikely to land.
- 5 sale attempts since 4y ago with the ask held roughly flat each time — persistent listings suggest the price (not the market) is what's stuck; bring a comps-based counter.
Risks & watch-outs
- Watch-outs: built in 1942 — expect roof / HVAC / electrical / plumbing capex.
- Climate carrying-cost: moderate wildfire risk — expect insurance premiums to compound above CPI over the hold.
Questions for the listing agent
- Built in 1942 — when were the roof, HVAC, electrical panel, plumbing, and water heater last replaced?
- Is there a deadline driving the sale (1031 exchange, divorce, estate, relocation)? That informs how much negotiation room exists.
- Schools are B-rated — typically a magnet for longer-tenancy family renters. What's the average tenant stay here, and is there a school-zone premium baked into asking?
- What's the average days-on-market for RENTAL listings here right now (not sales)? A rising rental-DOM trend means longer vacancies and softer asking-rent achievability than the comps imply.
- What's the recent tenant-quality profile in this submarket — average credit score on applications, eviction rate, late-payment / NSF rate, and stable-employment percentage? A property-management company in the area should have these aggregated.
- How much new for-sale + rental construction is in the pipeline within 1–3 miles? Heavy new supply typically softens prices + rents 12–24 months out; constrained supply supports both.
Investment metrics
- 1% rule
- 1.34% ✓
- Cap rate
- 11.03%
- Cash-on-cash
- 16.92%
- DSCR
- 1.75
- GRM
- 6.2
CMA / ARV
No comps found within radius.
Projected returns pro-forma
-3.0% appreciation · 3.0% rent growth · sell at horizon
- IRR
- 8.2%
- Equity multiple
- 1.32×
- Total profit
- $18,778
- Equity at exit
- $31,297
- IRR
- 17.4%
- Equity multiple
- 2.44×
- Total profit
- $84,352
- Equity at exit
- $18,148
Cash invested: $58,772 (down + closing). Projections, not guarantees.
Landlord ↔ Tenant lean methodology
- Overall (STATE)
- 46 Balanced
- State Minnesota
- 46 Balanced · D+2
- County
- — inherits STATE
- City
- — inherits STATE
ZIP-level market 56501
- Active inventory
- 307
- Price-to-rent
- 6.2×
Monthly cashflow live
- Estimated rent
- $2,815 medium interval (Pro) →
- Mortgage (P&I)
- −$1,101
- Tax from tax record
- −$207 /mo · $2,482/yr
- Insurance
- −$87
- HOA
- −$0
- Vacancy / Maint / Mgmt
- −$591
- Net cashflow
- $829
Break-even live
Sensitivity live
| Price | -10% $948 | -5% $888 | +0% $829 | +5% $769 | +10% $710 |
|---|---|---|---|---|---|
| Rent | -10% $606 | -5% $718 | +0% $829 | +5% $940 | +10% $1,051 |
| Rate | -1.0pp $934 | -0.5pp $882 | base $829 | +0.5pp $774 | +1.0pp $719 |
UW: 25.0% down · 7.5% · 30yr · 1.5% tax · 5.0% vac · 8.0% maint · 8.0% mgmt
Financing live
Cash to close
- Down payment
- $52,475
- Closing costs
- $6,297
- Reserves months
- —
- Total cash needed
- —
Loan-product check · same deal, 3 products live
Conventional
25% down · 7.5% · 30yr
- Down + closing
- —
- Monthly P&I
- —
- Monthly cashflow
- —
- DSCR
- —
- Eligible?
- —
Personal DTI + credit; lowest rate.
DSCR
20% down · 8.5% · 30yr
- Down + closing
- —
- Monthly P&I
- —
- Monthly cashflow
- —
- DSCR
- —
- Eligible?
- —
No personal income docs; deal must DSCR.
Hard money
10% down · 12.0% · 12mo
- Down + closing
- —
- Monthly P&I
- —
- Monthly cashflow
- —
- DSCR
- —
- Eligible?
- —
Short-term bridge; refi at stabilization.
Listing history 6 events
-
2026-06-21days on market $209,900 Active 6 DOM
-
2026-06-21pricedays on market $209,900 Active 5 DOM
-
2026-06-18days on market $215,000 Active 3 DOM
-
2026-06-17days on market $215,000 Active 2 DOM
-
2026-06-16remarks 699-char remark
-
2026-06-16$215,000 Active 1 DOM
ⓘ Source: listings_history table (triggers on properties + properties_extension) + one-shot
backfill from property_details.listing_events for pre-trigger history.
Tax reassessment forecast MN · Partial reset (capped growth)
- Current annual tax
- $2,482 · $207/mo
- Projected year-2 tax
- $2,482 · $207/mo
- Expected delta
- $0/yr ($0/mo · 0.0%)
ⓘ Screening estimate from a state-policy table — verify with the county assessor before closing.
Climate risk First Street
- Flood 1/10 Low FEMA zone X · 0% chance over 30 yrs
- Wildfire 5/10 Major
- Heat 1/10 Low 7 d/yr ≥96°F today · 12 d/yr by 30 yrs out
- Wind 1/10 Low
- Air quality 3/10 Moderate 2 unhealthy d/yr today · 2 by 30 yrs out
Nearby sold comps map
Loading sold comps map…
Walkable amenities ~0.75 mi
Loading nearby amenities…
Taxation est. · year 1
- Rental income
- $33,779
- − Mortgage interest
- −$11,758
- − Property taxes
- −$2,482
- − Insurance
- −$1,050
- − Repairs & maintenance
- −$2,702
- − Management
- −$2,702
- − Depreciation
- −$6,106
- Taxable income
- $6,979
- Est. tax owed @ 24.0%
- −$1,675
- After-tax cash flow
- $8,270/yr
For passive investors: Depreciation is non-cash, so a rental often shows a tax loss while cash-flowing — sheltering income. Rental losses are passive: they offset passive income freely, and up to $25,000/yr can offset ordinary (W-2) income if you actively participate and your MAGI is under $100k (phasing out to $0 by $150k); unused losses carry forward. On sale, claimed depreciation is recaptured at up to 25%, and gains may owe capital-gains tax (a 1031 exchange can defer both). Figures are a year-1 estimate at your 24.0% rate — not tax advice; consult a CPA.
Schools (NCES district)
- District
- Detroit Lakes Public School District
- NCES district ID
- 2710230
- Math proficiency
- 44% ▼ -11.00%
- Reading proficiency
- 50% ▼ -11.00%
- Median HH income
- $50,571
- Composite
- 40.33/100
- National rank
- #3746
- State rank
- #155 of 301 in MN
Livability — Detroit Lakes
- Score
- 80/100
- State rank
- #78
- US rank
- #1847
Category grades
Schools grade is shown separately in the Schools card above.
Census & demographics
- Census place
- Detroit Lakes, MN
- City population
- 18,239
- Population (ZIP)
- 18,239
Population outlook (Becker County) Hauer SSP2
- Today (2025)
- 34,604 people
- By 2030
- 35,095 · +1.4%
- By 2040
- 35,691 · +3.1%
- By 2050
- 35,869 · +3.7%
- By 2075
- 36,103 · +4.3%
- By 2100
- 32,798 · -5.2%
Race, ethnicity, and origin ACS 2023
- Neighborhood character
- Predominantly White (91%)
- Race & ethnicity
- White 91% Two or more races 5% Native American 2%
- Common ancestry
- Portuguese 25% Scottish 4% Lithuanian 3%
- Foreign-born
- 1% · Canada
- Languages at home
- 98% English-only · Spanish 1%
Political lean MEDSL · Becker
- 2024 margin
- Solid R (+33.1) · D 32.7% · R 65.8% · Other 1.5%
- 2008→2024 swing
- -26.3pp toward R · 2008: -6.9pp · 2024: -33.1pp
- All cycles
- 2024: R+33.1 2020: R+30.1 2016: R+33.2 2012: R+14.6 2008: R+6.9
Not yet ingested
- Civics
- —
Market trends
- HPI YoY
- ▼ -222.40%
- Current HPI
- 217.4973
- Rent YoY
- —
- Metro
- —
- State GDP YoY
- ▲ 2.41%
- F500 in state
- 34
Industry mix (Fortune 500 HQ in MN)
| Industry | F500 HQs | Revenue |
|---|---|---|
| Healthcare | 2 | $407B |
|
||
| Retail | 2 | $150B |
|
||
| Consumer Goods | 2 | $32B |
|
||
| Industrial Machinery | 2 | $6B |
|
||
| Agriculture | 1 | $40B |
|
||
| Healthcare / Medical Devices | 1 | $32B |
|
||
Price history
+316.7% since first listed18 events — show timeline
- 2026-06-15 Listed $215,000 NORTHSTARMLS as Distributed by MLS Grid
- 2024-03-11 Sold (Public Records) $185,000 Public Records
- 2024-03-05 Sold (MLS) $185,000 NORTHSTARMLS as Distributed by MLS Grid
- 2024-03-01 Pending — NORTHSTARMLS as Distributed by MLS Grid
- 2024-02-06 Contingent — NORTHSTARMLS as Distributed by MLS Grid
- 2024-01-29 Listed $189,000 NORTHSTARMLS as Distributed by MLS Grid
- 2023-03-03 Sold (MLS) $145,000 NORTHSTARMLS as Distributed by MLS Grid
- 2023-01-29 Contingent — NORTHSTARMLS as Distributed by MLS Grid
- 2023-01-06 Relisted — NORTHSTARMLS as Distributed by MLS Grid
- 2022-12-31 Contingent — NORTHSTARMLS as Distributed by MLS Grid
- 2022-10-31 Price Changed $174,900 NORTHSTARMLS as Distributed by MLS Grid
- 2022-10-20 Relisted — NORTHSTARMLS as Distributed by MLS Grid
- 2022-10-06 Pending — NORTHSTARMLS as Distributed by MLS Grid
- 2022-10-01 Contingent — NORTHSTARMLS as Distributed by MLS Grid
- 2022-09-12 Price Changed $184,900 NORTHSTARMLS as Distributed by MLS Grid
- 2022-08-29 Listed $199,900 NORTHSTARMLS as Distributed by MLS Grid
- 2017-03-14 Sold (Public Records) $128,000 Public Records
- 2005-01-11 Sold (Public Records) $51,600 Public Records
Property tax history
+19.0%/yrLatest (2025): $2,482 · -7.8% YoY. Source: county tax records.
Cash-flow waterfall
monthlySold comps — $/sqft
last 12 mo · ≤1 miLoading sold comps…