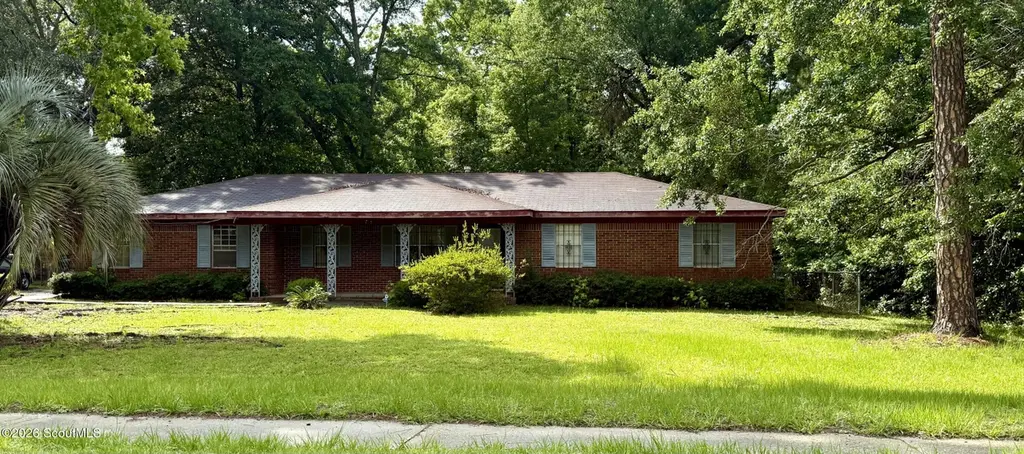
713 N Fourth St · Jesup, GA
Flood risk 1/10 · Minimal
- FEMA flood zone
- X (unshaded)
- Chance of flooding over 30 yrs
- 0.0%
- Est. flood insurance / yr
- $507 – $1,088
Fire risk 3/10 · Minor
- Est. fire insurance / yr
- $963 – $1,789
Heat risk 8/10 · Major
- Hot days now (above 109°F)
- 7 days/yr
- Hot days in 30 yrs
- 18 days/yr
Wind risk 8/10 · Major
- Chance of severe wind over 30 yrs
- 99.0%
Air-quality risk 2/10 · Minimal
- Unhealthy air days now
- 2 days/yr
- Unhealthy air days in 30 yrs
- 2 days/yr
Risk factors via First Street. Map © Google.
Why this score? — see what drove the B- grade
The composite is a weighted blend of 9 inputs, each scored 0–100. Each bar is that input's sub-score; the figure is the points it added to the 100-point composite (weight × sub-score).
- Cash flow +30.0/30.0
- 1% rule +10.0/10.0
- DSCR +10.0/10.0
- ARV discount +7.5/15.0
- Livability +3.5/5.0
- Schools +2.9/10.0
- Rent growth +2.5/5.0
- Condition / age +2.5/5.0
- Appreciation +0.0/10.0
$115,000
🖨 Deal sheet (PDF) 📄 Offer letter ✓ Due diligence
Listing remarks
Brick home in need of some TLC.
Key facts
- 0.38 acre lot
- 2 parking spots
- Built 1973
Neighborhood map
What this means for you Summary
Snapshot
- This is a 3-bed/2.0-bath single-family listed at $115k.
Deal economics
- At list price, monthly cash flow is $629 ($8k/yr) — positive.
- The deal already cash-flows at list — no discount required.
- Meets the 1% rule at list price ($2k rent vs $115k).
- Cap rate 12.9% vs local median 4.5% in Jesup — top-decile yield for the area; either an underpriced asset or a hidden risk that comps aren't pricing in. Stress-test before assuming the spread holds.
Location & tenants
- Location reads 69/100 on livability (#112 in GA) — a middle-class / working-renter tenant base. Strengths: cost of living A+, housing A+, health & safety A+; Watch: schools F, amenities F, commute F.
- Wayne County (rural): math 35% / reading 35% proficiency, ranked #68 of 174 in GA (top 39%) — families likely to look elsewhere, expect single-tenant / working-renter base with shorter leases; 60% free/reduced lunch — lower-income household profile, screen leases tightly.
- Market conditions: 172 active listings in the ZIP; 1 comparable units currently listed for rent nearby; 163 units permitted in Wayne County in 2024 (0 in 5+ unit buildings).
Forward outlook
- Local home prices are declining (-3.0%/yr); year-one equity from $795 of loan paydown is wiped out by about $3k of value loss. Plan a longer hold.
- Wayne County population projected to shrink 10% by 2050 — rents likely to lag national; underwrite the cash flow, not the appreciation.
- At projected returns (-3.0% appreciation + 3.0% rent growth), your $32k cash investment doubles in ~6 years — after that, you're playing with house money.
Negotiation context
- Only 0 days on market — expect competitive offers; lowballing is unlikely to land.
Risks & watch-outs
- Climate carrying-cost: severe wind risk, 99% chance of damaging wind over 30y; extreme-heat days projected 7→18/yr by 2055 (HVAC capex compounding) — expect insurance premiums to compound above CPI over the hold.
Questions for the listing agent
- Built in 1973 — when were the roof, HVAC, electrical panel, plumbing, and water heater last replaced?
- Is there a deadline driving the sale (1031 exchange, divorce, estate, relocation)? That informs how much negotiation room exists.
- Schools are F-rated, which usually means shorter tenancies and higher turnover. Who's the typical renter profile here, and what's been the actual vacancy rate?
- What's the average days-on-market for RENTAL listings here right now (not sales)? A rising rental-DOM trend means longer vacancies and softer asking-rent achievability than the comps imply.
- What's the recent tenant-quality profile in this submarket — average credit score on applications, eviction rate, late-payment / NSF rate, and stable-employment percentage? A property-management company in the area should have these aggregated.
- How much new for-sale + rental construction is in the pipeline within 1–3 miles? Heavy new supply typically softens prices + rents 12–24 months out; constrained supply supports both.
Investment metrics
- 1% rule
- 1.52% ✓
- Cap rate
- 12.85%
- Cash-on-cash
- 23.42%
- DSCR
- 2.04
- GRM
- 5.5
CMA / ARV
- ARV (on-the-fly)
- $313,968
- Comps found
- 2
Show comp detail 2 sales within ~0.75 mi
| Address | Dist | Beds/Ba | Sqft | Sold | Price | $/sf | Match |
|---|---|---|---|---|---|---|---|
| 675 E Cherry St | 0.74mi | 3/2.0 | 1,400 (-6%) | 14mo | $295,000 | $211 | 44 |
| 218 Pine Ridge Rd | 0.62mi | 3/2.0 | 1,278 (-14%) | 5mo | $214,900 | $168 | 44 |
Match score weights: distance 35% · size 25% · config 20% · recency 20%. Top-matched comps best support the ARV.
Projected returns pro-forma
-3.0% appreciation · 3.0% rent growth · sell at horizon
- IRR
- 16.5%
- Equity multiple
- 1.66×
- Total profit
- $21,399
- Equity at exit
- $17,147
- IRR
- 25.1%
- Equity multiple
- 3.18×
- Total profit
- $70,187
- Equity at exit
- $9,943
Cash invested: $32,200 (down + closing). Projections, not guarantees.
Landlord ↔ Tenant lean methodology
- Overall (STATE)
- 90 Strongly Landlord-Friendly
- State Georgia
- 90 Strongly Landlord-Friendly · R+3
- County
- — inherits STATE
- City
- — inherits STATE
ZIP-level market 31545
- Home prices YoY
- -6.4%
- Active inventory
- 172
- Price-to-rent
- 5.5×
Monthly cashflow live
- Estimated rent
- $1,750 medium interval (Pro) →
- Mortgage (P&I)
- −$603
- Tax from tax record
- −$103 /mo · $1,236/yr
- Insurance
- −$48
- HOA
- −$0
- Vacancy / Maint / Mgmt
- −$368
- Net cashflow
- $629
Break-even live
Sensitivity live
| Price | -10% $694 | -5% $661 | +0% $629 | +5% $596 | +10% $563 |
|---|---|---|---|---|---|
| Rent | -10% $490 | -5% $559 | +0% $629 | +5% $698 | +10% $767 |
| Rate | -1.0pp $686 | -0.5pp $658 | base $629 | +0.5pp $599 | +1.0pp $568 |
UW: 25.0% down · 7.5% · 30yr · 1.5% tax · 5.0% vac · 8.0% maint · 8.0% mgmt
Financing live
Cash to close
- Down payment
- $28,750
- Closing costs
- $3,450
- Reserves months
- —
- Total cash needed
- —
Loan-product check · same deal, 3 products live
Conventional
25% down · 7.5% · 30yr
- Down + closing
- —
- Monthly P&I
- —
- Monthly cashflow
- —
- DSCR
- —
- Eligible?
- —
Personal DTI + credit; lowest rate.
DSCR
20% down · 8.5% · 30yr
- Down + closing
- —
- Monthly P&I
- —
- Monthly cashflow
- —
- DSCR
- —
- Eligible?
- —
No personal income docs; deal must DSCR.
Hard money
10% down · 12.0% · 12mo
- Down + closing
- —
- Monthly P&I
- —
- Monthly cashflow
- —
- DSCR
- —
- Eligible?
- —
Short-term bridge; refi at stabilization.
Rent comps 1 comps
| Address | Beds | Baths | Sqft | Rent | $/sqft | DOM | Units | Dist |
|---|---|---|---|---|---|---|---|---|
| 151 Arabian Ln Jesup, GA | 3.0 | 2.0 | 1100 | $1,750 | $1.59 | 44d | 1 | 1.08mi |
Listing history 2 events
-
2026-06-05remarks 31-char remark
-
2026-06-05$115,000 Pending
ⓘ Source: listings_history table (triggers on properties + properties_extension) + one-shot
backfill from property_details.listing_events for pre-trigger history.
Tax reassessment forecast GA · Resets to sale price
- Current annual tax
- $1,236 · $103/mo
- Projected year-2 tax
- $1,236 · $103/mo
- Expected delta
- $0/yr ($0/mo · 0.0%)
ⓘ Screening estimate from a state-policy table — verify with the county assessor before closing.
Climate risk First Street
- Flood 1/10 Low FEMA zone X (unshaded) · 0% chance over 30 yrs
- Wildfire 3/10 Moderate
- Heat 8/10 Severe 7 d/yr ≥109°F today · 18 d/yr by 30 yrs out
- Wind 8/10 Severe 99% chance of damaging wind over 30 yrs
- Air quality 2/10 Low 2 unhealthy d/yr today · 2 by 30 yrs out
Nearby sold comps map
Loading sold comps map…
Walkable amenities ~0.75 mi
Loading nearby amenities…
Taxation est. · year 1
- Rental income
- $21,000
- − Mortgage interest
- −$6,442
- − Property taxes
- −$1,236
- − Insurance
- −$575
- − Repairs & maintenance
- −$1,680
- − Management
- −$1,680
- − Depreciation
- −$3,345
- Taxable income
- $6,042
- Est. tax owed @ 24.0%
- −$1,450
- After-tax cash flow
- $6,092/yr
For passive investors: Depreciation is non-cash, so a rental often shows a tax loss while cash-flowing — sheltering income. Rental losses are passive: they offset passive income freely, and up to $25,000/yr can offset ordinary (W-2) income if you actively participate and your MAGI is under $100k (phasing out to $0 by $150k); unused losses carry forward. On sale, claimed depreciation is recaptured at up to 25%, and gains may owe capital-gains tax (a 1031 exchange can defer both). Figures are a year-1 estimate at your 24.0% rate — not tax advice; consult a CPA.
Schools (NCES district)
- District
- Wayne County
- NCES district ID
- 1305550
- Math proficiency
- 35% ▼ -4.00%
- Reading proficiency
- 35% ▼ -3.00%
- Median HH income
- $38,918
- Composite
- 29.3/100
- National rank
- #6554
- State rank
- #68 of 174 in GA
Livability — Jesup
- Score
- 69/100
- State rank
- #112
- US rank
- #8442
Category grades
Schools grade is shown separately in the Schools card above.
Census & demographics
- Census place
- Jesup, GA
- City population
- 1,050
- Population (ZIP)
- 16,057
Population outlook (Wayne County) Hauer SSP2
- Today (2025)
- 28,891 people
- By 2030
- 28,388 · -1.7%
- By 2040
- 27,396 · -5.2%
- By 2050
- 26,135 · -9.5%
- By 2075
- 23,253 · -19.5%
- By 2100
- 19,481 · -32.6%
Race, ethnicity, and origin ACS 2023
- Neighborhood character
- Predominantly White (67%)
- Race & ethnicity
- White 67% Black 20% Hispanic / Latino 7% Two or more races 4% Asian 2%
- Hispanic origin (detail)
- Mexican 5% Puerto Rican 1%
- Common ancestry
- Romanian 2% Lithuanian 1% Italian 1%
- Foreign-born
- 3% · Canada, Philippines
- Languages at home
- 94% English-only · Spanish 4% Other Asian/Pacific 2%
Political lean MEDSL · Wayne
- 2024 margin
- Solid R (+59.8) · D 20.0% · R 79.7%
- 2008→2024 swing
- -14.8pp toward R · 2008: -44.9pp · 2024: -59.8pp
- All cycles
- 2024: R+59.8 2020: R+57.1 2016: R+58.9 2012: R+48.3 2008: R+44.9
Not yet ingested
- Civics
- —
Market trends
- HPI YoY
- ▼ -17.10%
- Current HPI
- 249.3504
- Rent YoY
- —
- Metro
- —
- State GDP YoY
- ▲ 2.66%
- F500 in state
- 28
Industry mix (Fortune 500 HQ in GA)
| Industry | F500 HQs | Revenue |
|---|---|---|
| Paper / Packaging | 2 | $29B |
|
||
| Retail | 1 | $160B |
|
||
| Transportation / Logistics | 1 | $91B |
|
||
| Airlines | 1 | $62B |
|
||
| Consumer Goods | 1 | $47B |
|
||
| Utilities | 1 | $25B |
|
||
Property tax history
+2.0%/yrLatest (2025): $1,236 · +4.0% YoY. Source: county tax records.
Cash-flow waterfall
monthlySold comps — $/sqft
last 12 mo · ≤1 miLoading sold comps…