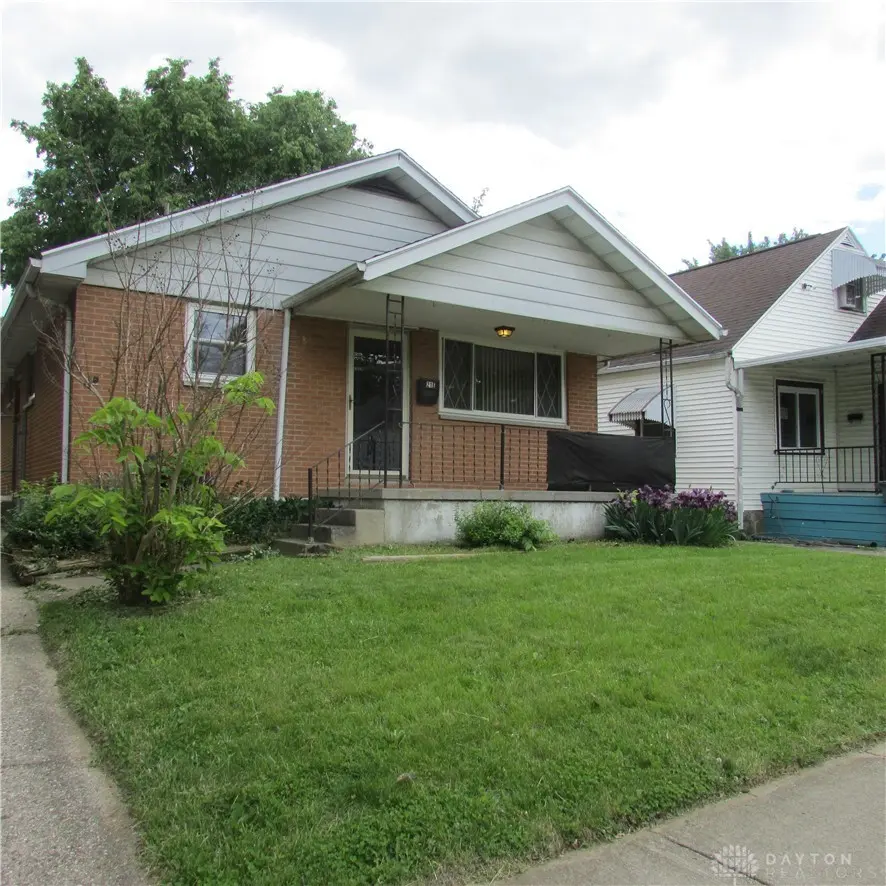
218 E Parkwood Dr · Dayton, OH
Flood risk 4/10 · Minor
- FEMA flood zone
- X (unshaded)
- Chance of flooding over 30 yrs
- 0.2%
- Est. flood insurance / yr
- $473 – $860
Fire risk 1/10 · Minimal
- Est. fire insurance / yr
- $713 – $1,323
Heat risk 4/10 · Minor
- Hot days now (above 104°F)
- 7 days/yr
- Hot days in 30 yrs
- 18 days/yr
Wind risk 2/10 · Minimal
- Chance of severe wind over 30 yrs
- —
Air-quality risk 3/10 · Minor
- Unhealthy air days now
- 2 days/yr
- Unhealthy air days in 30 yrs
- 4 days/yr
Risk factors via First Street. Map © Google.
Why this score? — see what drove the C- grade
The composite is a weighted blend of 9 inputs, each scored 0–100. Each bar is that input's sub-score; the figure is the points it added to the 100-point composite (weight × sub-score).
- Cash flow +26.0/30.0
- DSCR +8.7/10.0
- 1% rule +6.6/10.0
- Rent growth +3.6/5.0
- Livability +3.2/5.0
- Condition / age +2.5/5.0
- Schools +1.3/10.0
- ARV discount +0.0/15.0
- Appreciation +0.0/10.0
$92,500
🖨 Deal sheet 📄 Offer letter ✓ Due diligence
Listing remarks
Discover a charming brick bungalow offering an exceptional blend of classic appeal and urban convenience in Dayton. This inviting residence, boasting three bedrooms and one full and one half bathrooms, provides a comfortable living experience across its single story. The eat-in kitchen is perfectly situated for daily meals and gatherings, while the expansive three-car garage, complemented by additional off-street parking, offers unparalleled utility and storage solutions. The home features a welcoming porch, perfect for enjoying quiet mornings or relaxing evenings. Its prime location places it remarkably close to the vibrant downtown area, ensuring easy access to city amenities and cultural
Key facts
- Brick bungalow
- Eat-in kitchen
- Prime location
Tags
Property features AI
Finance
- Other: Lot dimensions approximately 35 x 110
- Financial info: Offered for sale
Exterior
- Parking: Attached garage with 3 parking spaces
- Utilities: Central air conditioning; Forced air heating
- Home design: Single-story residence; Brick construction; Residential zoning
- Construction: Brick exterior; One story
- Exterior features: Partial fencing
Interior
- Kitchen: Eat-in kitchen; Disposal; Range; Refrigerator
- Bedrooms: Three main-level bedrooms (sizes approximately 10 x 12, 10 x 8, and 8 x 8)
- Bathrooms: One full bathroom; One half bathroom; One main-level bathroom
- Heating & cooling: Forced air heating; Central air conditioning
- Interior features: Full, partially finished basement; Wood-burning fireplace
Neighborhood map
What this means for you Summary
Snapshot
- This is a 3-bed/2.0-bath single-family listed at $92k.
Deal economics
- At list price, monthly cash flow is $230 ($3k/yr) — positive.
- The deal already cash-flows at list — no discount required.
- Meets the 1% rule at list price ($1k rent vs $92k).
- Recommended offer: $90k (3.0% below list) — sets the bar for market timing.
- Cap rate 9.3% vs local median 7.4% in Dayton — meaningfully above typical; check what's discounted (condition, days-on-market, listing class) to confirm the premium yield is real.
Location & tenants
- Location reads 65/100 on livability (#716 in OH) — a middle-class / working-renter tenant base. Strengths: cost of living A+, housing A+, health & safety A; Watch: schools C-, amenities C-, crime F.
- Dayton City (urban): math 12% / reading 21% proficiency, ranked #641 of 656 in OH (top 98%) — low school quality limits family demand, transient renter base, plan for 1-2y turnover; 74% free/reduced lunch — lower-income household profile, screen leases tightly.
- Market conditions: Rents rising fast (+4.3%/yr); 134 active listings in the ZIP; 40 comparable units currently listed for rent nearby; rentals lingering (median 44d on market — plan ~5-8 weeks vacancy on turnover, expect pricing pressure); 52% of comp listings sitting > 30 days — soft ceiling on asking rent; lower-income renter base — watch delinquency; 907 units permitted in Montgomery County in 2024 (416 in 5+ unit buildings).
Forward outlook
- Local home prices are declining (-3.0%/yr); year-one equity from $640 of loan paydown is wiped out by about $3k of value loss. Plan a longer hold.
- Montgomery County population projected at -10% by 2050 — secular population decline; favor cash flow + early exit over multi-decade hold.
- At projected returns (-3.0% appreciation + 4.3% rent growth), your $26k cash investment doubles in ~9 years — after that, you're playing with house money.
Negotiation context
- It's been on market 34 days — a 3% lower offer ($90k) is reasonable based on typical stale-listing flexibility.
- Current owner paid $57k; list at $92k implies a 61% gain — meaningful room to come down on a strong offer.
Questions for the listing agent
- It's been on market 34 days. Have you received any prior offers? Is the seller open to a 3% concession, seller financing, or rate buy-down credit?
- Built in 1960 — when were the roof, HVAC, electrical panel, plumbing, and water heater last replaced?
- Is there a deadline driving the sale (1031 exchange, divorce, estate, relocation)? That informs how much negotiation room exists.
- Crime grade is F in this area — have there been break-ins, vandalism, or insurance claims at this property in the last 3 years? What carrier currently insures it and at what premium?
- What's the average days-on-market for RENTAL listings here right now (not sales)? A rising rental-DOM trend means longer vacancies and softer asking-rent achievability than the comps imply.
- What's the recent tenant-quality profile in this submarket — average credit score on applications, eviction rate, late-payment / NSF rate, and stable-employment percentage? A property-management company in the area should have these aggregated.
- How much new for-sale + rental construction is in the pipeline within 1–3 miles? Heavy new supply typically softens prices + rents 12–24 months out; constrained supply supports both.
Investment metrics
- 1% rule
- 1.16% ✓
- Cap rate
- 9.27%
- Cash-on-cash
- 10.64%
- DSCR
- 1.47
- GRM
- 7.2
CMA / ARV
- ARV (median comp)
- $70,026
- List price
- $92,500
- Delta
- 32.09%
- Verdict
- OVERPRICED
- Comps
- 20 within 1.0 mi
Show comp detail 12 sales within ~0.75 mi
| Address | Dist | Beds/Ba | Sqft | Sold | Price | $/sf | Match |
|---|---|---|---|---|---|---|---|
| 212 E Hillcrest Ave | 0.18mi | 3/1.0 | 1,144 (0%) | 2mo | $90,000 | $79 | 86 |
| 250 E Parkwood Dr | 0.05mi | 3/1.0 | 1,176 (+3%) | 4mo | $120,000 | $102 | 86 |
| 128 E Parkwood Dr | 0.10mi | 3/1.0 | 1,228 (+7%) | 1mo | $29,810 | $24 | 79 |
| 165 Basswood Ave | 0.12mi | 3/1.0 | 1,253 (+10%) | 2mo | $107,500 | $86 | 73 |
| 2624 Newport Ave | 0.18mi | 2/1.0 (-1) | 1,207 (+6%) | 2mo | $92,800 | $77 | 71 |
| 2933 Lindale Ave | 0.56mi | 3/2.0 | 1,132 (-1%) | 2mo | $208,000 | $184 | 71 |
| 148 Valleyview Dr | 0.61mi | 3/1.0 | 1,163 (+2%) | 2mo | $125,000 | $107 | 64 |
| 332 Ashwood Ave | 0.63mi | 3/1.0 | 1,176 (+3%) | 3mo | $134,900 | $115 | 60 |
| 126 Fernwood Ave | 0.42mi | 3/1.0 | 1,028 (-10%) | 3mo | $65,000 | $63 | 57 |
| 136 Niagara Ave | 0.65mi | 3/1.0 | 1,081 (-6%) | 4mo | $94,000 | $87 | 53 |
| 3220 Zephyr Dr | 0.55mi | 3/2.0 | 1,292 (+13%) | 4mo | $219,000 | $170 | 49 |
| 202 Santa Clara Ave | 0.62mi | 3/1.0 | 1,302 (+14%) | 4mo | $125,400 | $96 | 41 |
Match score weights: distance 35% · size 25% · config 20% · recency 20%. Top-matched comps best support the ARV.
Projected returns pro-forma
-3.0% appreciation · 4.34% rent growth · sell at horizon
- IRR
- 1.1%
- Equity multiple
- 1.04×
- Total profit
- $1,103
- Equity at exit
- $13,792
- IRR
- 12.0%
- Equity multiple
- 2.00×
- Total profit
- $25,972
- Equity at exit
- $7,998
Cash invested: $25,900 (down + closing). Projections, not guarantees.
Landlord ↔ Tenant lean methodology
- Overall (STATE)
- 73 Landlord-Friendly
- State Ohio
- 73 Landlord-Friendly · R+6
- County
- — inherits STATE
- City
- — inherits STATE
ZIP-level market 45405
- Rents YoY
- 4.3%
- Active inventory
- 134
- Price-to-rent
- 7.2×
Monthly cashflow live
- Estimated rent
- $1,071 high interval (Pro) →
- Mortgage (P&I)
- −$485
- Tax from tax record
- −$92 /mo · $1,109/yr
- Insurance
- −$39
- HOA
- −$0
- Vacancy / Maint / Mgmt
- −$225
- Net cashflow
- $230
Break-even live
UW: 25.0% down · 7.5% · 30yr · 1.5% tax · 5.0% vac · 8.0% maint · 8.0% mgmt
Financing live
Cash to close
- Down payment
- $23,125
- Closing costs
- $2,775
- Reserves months
- —
- Total cash needed
- —
Loan-product check · same deal, 3 products live
Conventional
25% down · 7.5% · 30yr
- Down + closing
- —
- Monthly P&I
- —
- Monthly cashflow
- —
- DSCR
- —
- Eligible?
- —
Personal DTI + credit; lowest rate.
DSCR
20% down · 8.5% · 30yr
- Down + closing
- —
- Monthly P&I
- —
- Monthly cashflow
- —
- DSCR
- —
- Eligible?
- —
No personal income docs; deal must DSCR.
Hard money
10% down · 12.0% · 12mo
- Down + closing
- —
- Monthly P&I
- —
- Monthly cashflow
- —
- DSCR
- —
- Eligible?
- —
Short-term bridge; refi at stabilization.
Rent comps 40 comps
| Address | Beds | Baths | Sqft | Rent | $/sqft | DOM | Units | Dist |
|---|---|---|---|---|---|---|---|---|
| 152 Laura Ave Dayton, OH | 2.0 | 1.0 | 990 | $895 | $0.90 | 43d | 1 | 0.10mi |
| 147 Laura Ave Dayton, OH | 2.0 | 1.0 | 1096 | $975 | $0.89 | 23d | 1 | 0.13mi |
| 102 E Norman Ave Dayton, OH | 2.0 | 1.0 | 800 | $925 | $1.16 | 23d | 1 | 0.21mi |
| 31 E Norman Ave Dayton, OH | 3.0 | 1.0 | 1100 | $1,150 | $1.05 | 23d | 1 | 0.24mi |
| 2327 N Main St Unit 2 Dayton, OH | 2.0 | 1.0 | 900 | $1,200 | $1.33 | 23d | 1 | 0.28mi |
| 41 W Fairview Ave Unit 2 Dayton, OH | 3.0 | 1.0 | 1452 | $1,200 | $0.83 | 14d | 1 | 0.34mi |
| 65 E Maplewood Ave Dayton, OH | 2.0 | 1.0 | 1064 | $723 | $0.68 | 43d | 1 | 0.41mi |
| 220 Fernwood Ave Dayton, OH | 2.0 | 1.0 | 884 | $900 | $1.02 | 3d | 1 | 0.42mi |
| 317 Fernwood Ave Dayton, OH | 3.0 | 1.0 | 1320 | $1,100 | $0.83 | 11d | 1 | 0.42mi |
| 26 W Beechwood Ave Dayton, OH | 3.0 | 1.5 | 1468 | $1,050 | $0.72 | 43d | 1 | 0.44mi |
| 42 Pointview Ave Unit 42 Dayton, OH | 3.0 | 2.0 | 1240 | $1,200 | $0.97 | 3d | 1 | 0.48mi |
| 38 Pointview Ave Dayton, OH | 2.0 | 1.0 | 1140 | $900 | $0.79 | 14d | 1 | 0.49mi |
| 181 W Norman Ave Dayton, OH | 3.0 | 2.0 | 1228 | $1,150 | $0.94 | 43d | 1 | 0.56mi |
| 167 W Hudson Ave Dayton, OH | 3.0 | 1.5 | 1344 | $1,185 | $0.88 | 43d | 1 | 0.57mi |
| 202 E Bruce Ave Apt 2 Dayton, OH | 2.0 | 1.0 | 1250 | $800 | $0.64 | 23d | 1 | 0.58mi |
| 201 W Norman Ave Dayton, OH | 3.0 | 1.0 | 1424 | $1,200 | $0.84 | 43d | 1 | 0.58mi |
| 337 Ryburn Ave Unit 2 Dayton, OH | 2.0 | 1.0 | 900 | $800 | $0.89 | 43d | 1 | 0.62mi |
| 101 E Bruce Ave Dayton, OH | 3.0 | 1.0 | 1455 | $1,150 | $0.79 | 2d | 1 | 0.64mi |
| 234 Santa Clara Ave Dayton, OH | 3.0 | 1.0 | 1368 | $1,125 | $0.82 | 43d | 1 | 0.64mi |
| 412 W Parkwood Dr Unit 1 Dayton, OH | 2.0 | 1.0 | 900 | $875 | $0.97 | 23d | 1 | 0.66mi |
| 439 W Fairview Ave Dayton, OH | 3.0 | 1.0 | 1500 | $1,200 | $0.80 | 43d | 1 | 0.71mi |
| 265 Victor Ave Dayton, OH | 3.0 | 1.0 | 1204 | $900 | $0.75 | 43d | 1 | 0.76mi |
| 244 E Siebenthaler Ave Dayton, OH | 2.0 | 1.5 | 1273 | $1,175 | $0.92 | 2d | 1 | 0.78mi |
| 228 E Siebenthaler Ave Dayton, OH | 2.0 | 1.0 | 934 | $1,200 | $1.28 | 43d | 1 | 0.78mi |
| 419 Sandhurst Dr Dayton, OH | 2.0 | 1.0 | 950 | $975 | $1.03 | 23d | 1 | 0.82mi |
| 2333 Rustic Rd Unit 4 Dayton, OH | 2.0 | 1.0 | 1000 | $840 | $0.84 | 2d | 1 | 0.82mi |
| 2333 Rustic Rd Dayton, OH | 2.0 | 1.0 | 1000 | $840 | $0.84 | 43d | 1 | 0.82mi |
| 628 W Norman Ave Unit 628 Dayton, OH | 2.0 | 1.0 | 918 | $795 | $0.87 | 43d | 1 | 0.89mi |
| 518 Delaware Ave Dayton, OH | 2.0 | 1.0 | 1500 | $750 | $0.50 | 43d | 1 | 0.89mi |
| 605 Forest Ave Dayton, OH | 2.0 | 1.0 | 978 | $650 | $0.66 | 23d | 1 | 0.96mi |
| 1019 Cherry Dr Dayton, OH | 4.0 | 1.0 | 1057 | $1,125 | $1.06 | 43d | 1 | 1.04mi |
| 1067 Salem Ave Unit 2 Dayton, OH | 2.0 | 1.5 | 1100 | $900 | $0.82 | 43d | 1 | 1.04mi |
| 1067 Salem Ave Unit 3 Dayton, OH | 2.0 | 1.5 | 1100 | $900 | $0.82 | 43d | 1 | 1.04mi |
| 1067 Salem Ave Dayton, OH | 2.0 | 1.0 | 1100 | $900 | $0.82 | 43d | 1 | 1.04mi |
| 15 Camden Ave Dayton, OH | 2.0 | 1.0 | 833 | $950 | $1.14 | 43d | 1 | 1.06mi |
| 1004 W Fairview Ave Dayton, OH | 2.0 | 1.0 | 1053 | $950 | $0.90 | 23d | 1 | 1.08mi |
| 44 5 Oaks Ave Unit 2 Dayton, OH | 2.0 | 1.0 | 700 | $800 | $1.14 | 43d | 1 | 1.08mi |
| 138 Rockwood Ave Dayton, OH | 3.0 | 1.5 | 1439 | $1,200 | $0.83 | 23d | 1 | 1.10mi |
| 136 Rockwood Ave Dayton, OH | 3.0 | 1.5 | 1439 | $1,200 | $0.83 | 43d | 1 | 1.11mi |
| 57 Walbrook Ave Dayton, OH | 2.0 | 1.0 | 861 | $975 | $1.13 | 3d | 1 | 1.11mi |
Listing history 18 events
-
2026-06-18days on market $92,500 Active 34 DOM
-
2026-06-17days on market $92,500 Active 33 DOM
-
2026-06-16days on market $92,500 Active 32 DOM
-
2026-06-15days on market $92,500 Active 31 DOM
-
2026-06-14days on market $92,500 Active 29 DOM
-
2026-06-13days on market $92,500 Active 28 DOM
-
2026-06-10days on market $92,500 Active 26 DOM
-
2026-06-09days on market $92,500 Active 25 DOM
-
2026-06-08days on market $92,500 Active 24 DOM
-
2026-06-07days on market $92,500 Active 23 DOM
-
2026-06-05days on market $92,500 Active 20 DOM
-
2026-06-03days on market $92,500 Active 19 DOM
-
2026-06-02days on market $92,500 Active 18 DOM
-
2026-06-01days on market $92,500 Active 17 DOM
-
2026-05-31days on market $92,500 Active 16 DOM
-
2026-05-14$92,500 Active 1031-char remark
-
1990-11-20soldstatus $57,415
-
1986-06-17soldstatus $48,500
ⓘ Source: listings_history table (triggers on properties + properties_extension) + one-shot
backfill from property_details.listing_events for pre-trigger history.
Tax reassessment forecast OH · Partial reset (capped growth)
- Current annual tax
- $1,109 · $92/mo
- Projected year-2 tax
- $1,276 · $106/mo
- Expected delta
- +$167/yr (+$14/mo · 15.0%)
ⓘ Screening estimate from a state-policy table — verify with the county assessor before closing.
Climate risk First Street
- Flood 4/10 Moderate FEMA zone X (unshaded) · 20% chance over 30 yrs
- Wildfire 1/10 Low
- Heat 4/10 Moderate 7 d/yr ≥104°F today · 18 d/yr by 30 yrs out
- Wind 2/10 Low
- Air quality 3/10 Moderate 2 unhealthy d/yr today · 4 by 30 yrs out
Nearby sold comps map
Loading sold comps map…
Walkable amenities ~0.75 mi
Loading nearby amenities…
Taxation est. · year 1
- Rental income
- $12,847
- − Mortgage interest
- −$5,181
- − Property taxes
- −$1,109
- − Insurance
- −$462
- − Repairs & maintenance
- −$1,028
- − Management
- −$1,028
- − Depreciation
- −$2,691
- Taxable income
- $1,347
- Est. tax owed @ 24.0%
- −$323
- After-tax cash flow
- $2,433/yr
For passive investors: Depreciation is non-cash, so a rental often shows a tax loss while cash-flowing — sheltering income. Rental losses are passive: they offset passive income freely, and up to $25,000/yr can offset ordinary (W-2) income if you actively participate and your MAGI is under $100k (phasing out to $0 by $150k); unused losses carry forward. On sale, claimed depreciation is recaptured at up to 25%, and gains may owe capital-gains tax (a 1031 exchange can defer both). Figures are a year-1 estimate at your 24.0% rate — not tax advice; consult a CPA.
Schools (NCES district)
- District
- Dayton City
- NCES district ID
- 3904384
- Math proficiency
- 12% ▼ -12.00%
- Reading proficiency
- 21% ▼ -11.00%
- Median HH income
- $28,688
- Composite
- 12.94/100
- National rank
- #9579
- State rank
- #641 of 656 in OH
Livability — Dayton
- Score
- 65/100
- State rank
- #716
- US rank
- #12895
Category grades
Schools grade is shown separately in the Schools card above.
Census & demographics
- Census place
- Dayton, OH
- County
- Montgomery County · 459,541 people
- City population
- 164,387
- Metro
- Dayton-Kettering, OH
- Population (ZIP)
- 18,955
- Household income
- $43,973
- Rent vs Own
- Severe rent burden
- 1475.0
Population outlook (Montgomery County) Hauer SSP2
- Today (2025)
- 523,241 people
- By 2030
- 514,948 · -1.6%
- By 2040
- 493,378 · -5.7%
- By 2050
- 469,639 · -10.2%
- By 2075
- 418,360 · -20.0%
- By 2100
- 353,315 · -32.5%
Race, ethnicity, and origin ACS 2023
- Neighborhood character
- Predominantly Black (68%)
- Race & ethnicity
- Black 68% White 23% Two or more races 7% Hispanic / Latino 3%
- Common ancestry
- Italian 1% Slovak 1%
- Foreign-born
- 3% · Canada
- Languages at home
- 95% English-only · Spanish 2% French/Haitian/Cajun 1%
Political lean MEDSL · Montgomery
- 2024 margin
- Toss-up / Even · D 49.8% · R 49.3%
- 2008→2024 swing
- -5.8pp toward R · 2008: 6.2pp · 2024: 0.5pp
- All cycles
- 2024: D+0.5 2020: D+2.2 2016: R+1.2 2012: D+3.1 2008: D+6.2
Not yet ingested
- Civics
- —
Market trends
- HPI YoY
- ▼ -125.58%
- Current HPI
- 173.4962
- Rent YoY
- ▲ 4.34%
- Metro
- Dayton-Kettering, OH
- State GDP YoY
- ▲ 1.98%
- F500 in state
- 48
Industry mix (Fortune 500 HQ in OH)
| Industry | F500 HQs | Revenue |
|---|---|---|
| Insurance | 3 | $145B |
|
||
| Industrial Machinery | 3 | $49B |
|
||
| Financial Services | 3 | $24B |
|
||
| Consumer Goods | 2 | $93B |
|
||
| Aerospace / Defense | 2 | $47B |
|
||
| Utilities | 2 | $33B |
|
||
Price history
+90.7% since first listed3 events — show timeline
- 2026-05-14 Listed $92,500 Dayton MLS
- 1990-11-20 Sold (Public Records) $57,415 Public Records
- 1986-06-17 Sold (Public Records) $48,500 Public Records
Property tax history
-1.9%/yrLatest (2025): $1,109 · -0.2% YoY. Source: county tax records.
Cash-flow waterfall
monthlySold comps — $/sqft
last 12 mo · ≤1 miLoading sold comps…