 Duplex
458 N Magee St · Tuckahoe, NY
Flood risk 1/10 · Minimal
- FEMA flood zone
- X (unshaded)
- Chance of flooding over 30 yrs
- 0.0%
- Est. flood insurance / yr
- $473 – $860
Fire risk 2/10 · Minimal
- Est. fire insurance / yr
- $691 – $1,283
Heat risk 4/10 · Minor
- Hot days now (above 90°F)
- 7 days/yr
- Hot days in 30 yrs
- 20 days/yr
Wind risk 8/10 · Major
- Chance of severe wind over 30 yrs
- 80.0%
Air-quality risk 3/10 · Minor
- Unhealthy air days now
- 3 days/yr
- Unhealthy air days in 30 yrs
- 4 days/yr
Risk factors via First Street. Map © Google.
Why this score? — see what drove the B grade
The composite is a weighted blend of 9 inputs, each scored 0–100. Each bar is that input's sub-score; the figure is the points it added to the 100-point composite (weight × sub-score).
- Cash flow +30.0/30.0
- 1% rule +10.0/10.0
- DSCR +10.0/10.0
- ARV discount +7.5/15.0
- Rent growth +5.0/5.0
- Schools +4.8/10.0
- Livability +4.0/5.0
- Condition / age +2.5/5.0
- Appreciation +0.0/10.0
$2,000,000
🖨 Deal sheet (PDF) 📄 Offer letter ✓ Due diligence
Multi-family units
County records classify this as Multi-Family (2-4 Unit). Listing-text estimate: 2 units. confirmed
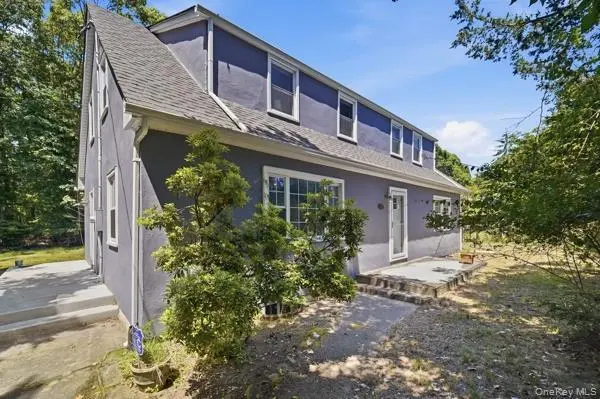
Listing remarks
458 N Magee Street welcomes you to a 6br/, 2bth DUPLEX, 2 updated kitchens, 2 living rooms to host a large family, settled on a corner lot. Full unfinished basement providing so much potential!!! The 1st floor has been completely renovated including quartz countertops and stainless steel appliances. Perfect fit mother/daughter or rental income producing property. * * Taxes incredibly low * * Come and unpack your bags!!! All plumbing has been updated. New water heater, furace, 200amp electric panel. Location is in close driving distance to beaches, route 39, gas stations, bus transit and golf courses.
Key facts
- New furnace
- New water heater
- Updated kitchens
Tags
Property features AI
Finance
- Other: Building area reported as 2,156 total square feet; No additional parcels
Exterior
- Parking: Driveway parking; On-street parking; Unpaved parking areas; No carport
- Utilities: Septic tank; Electricity available; Water available and connected; Sewer connected; Trash collection (public); Additional utility details: see remarks
- Home design: Duplex
- Construction: Stucco construction
- Exterior features: Stucco exterior; Not waterfront; Full unfinished walk-out basement
Interior
- Kitchen: Quartz/Quartzite counters
- Bedrooms: One 4-bedroom unit (4-bedroom count included)
- Bathrooms: Two full bathrooms
- Heating & cooling: Oil heating; No central cooling
- Interior features: First-floor bedroom; First-floor full bath; ENERGY STAR qualified doors; Formal dining room; His and hers closets; Open floorplan; Master bedroom on main level; Quartz/Quartzite counters; Other interior features
- Laundry & utility: Basement utility access
Neighborhood map
What this means for you Summary
Snapshot
- This is a 2 × 3-bed/1.0-bath units multifamily listed at $2.00M.
Deal economics
- At list price, monthly cash flow is $16k ($189k/yr) — positive. Per door: $8k/mo.
- The deal already cash-flows at list — no discount required.
- Meets the 1% rule at list price ($37k rent vs $2.00M).
- Cap rate 15.8% vs local median 2.9% in Tuckahoe — top-decile yield for the area; either an underpriced asset or a hidden risk that comps aren't pricing in. Stress-test before assuming the spread holds.
Location & tenants
- Location reads 79/100 on livability (#125 in NY, #2,013 nationally) — a middle-class / working-renter tenant base. Strengths: crime A+, commute A+, employment A+; Watch: amenities C-, cost of living F.
- Southampton Union Free School District (suburban): math 53% / reading 51% proficiency, ranked #293 of 590 in NY (top 50%) — acceptable for families but not a draw, mixed tenant base, ~2y average lease.
- Zoned schools: Southampton Elementary School (math 42% / reading 57%, grade D, #1,085 of 2,108 statewide, top 56%, 376 students, 51% FRL); Southampton Intermediate School (math 30% / reading 47%, grade F, #437 of 729 statewide, top 60%, 363 students, 44% FRL); Southampton High School (math 98%, 595 students, 48% FRL) — zoned schools average 48% FRL vs 30% district-wide (17 pts higher); higher-poverty schools than district average — tighter screening recommended.
- Market conditions: Rents rising fast (+14.6%/yr); 95 active listings in the ZIP; 3 comparable units currently listed for rent nearby; rentals at typical pace (median 25d on market — plan ~3-4 weeks tenant-placement turnaround); high-income renter base; 1,366 units permitted in Suffolk County in 2024 (216 in 5+ unit buildings).
- At $37,471/mo this rent would consume 288% of the median local household income ($156k/yr) (locally 274% of renters already pay >50% of income on rent) — very limited rent-growth headroom before tenants either downsize or default.
Forward outlook
- Local home prices are declining (-3.0%/yr); year-one equity from $14k of loan paydown is wiped out by about $60k of value loss. Plan a longer hold.
- Suffolk County population projected to shrink 5% by 2050 — rents likely to lag national; underwrite the cash flow, not the appreciation.
- At projected returns (-3.0% appreciation + 8.0% rent growth), your $560k cash investment doubles in ~4 years — after that, you're playing with house money.
Negotiation context
- Only 2 days on market — expect competitive offers; lowballing is unlikely to land.
- Current owner paid $50k; list at $2.00M implies a 3900% gain — meaningful room to come down on a strong offer.
Risks & watch-outs
- Climate carrying-cost: severe wind risk, 80% chance of damaging wind over 30y — expect insurance premiums to compound above CPI over the hold.
Questions for the listing agent
- Can we see the unit-by-unit rent roll, current vacancy, and any below-market leases? What's the average tenancy length?
- What capital expenditures (roof, boiler, parking lot, exteriors) have been made in the last 5 years, and what's planned in the next 2?
- Is there a deadline driving the sale (1031 exchange, divorce, estate, relocation)? That informs how much negotiation room exists.
- Schools are A-rated — typically a magnet for longer-tenancy family renters. What's the average tenant stay here, and is there a school-zone premium baked into asking?
- What's the average days-on-market for RENTAL listings here right now (not sales)? A rising rental-DOM trend means longer vacancies and softer asking-rent achievability than the comps imply.
- What's the recent tenant-quality profile in this submarket — average credit score on applications, eviction rate, late-payment / NSF rate, and stable-employment percentage? A property-management company in the area should have these aggregated.
- How much new apartment / multifamily construction is in the pipeline within 1–3 miles? Heavy new supply (>2% of stock underway) typically softens rents 12–24 months out; light construction supports rent growth.
Investment metrics
- 1% rule
- 1.87% ✓
- Cap rate
- 15.76%
- Cash-on-cash
- 33.82%
- DSCR
- 2.50
- GRM
- 4.4
CMA / ARV
No comps found within radius.
Projected returns pro-forma
-3.0% appreciation · 8.0% rent growth · sell at horizon
- IRR
- 34.7%
- Equity multiple
- 2.57×
- Total profit
- $879,576
- Equity at exit
- $298,207
- IRR
- 44.1%
- Equity multiple
- 6.29×
- Total profit
- $2,963,701
- Equity at exit
- $172,923
Cash invested: $560,000 (down + closing). Projections, not guarantees.
Landlord ↔ Tenant lean methodology
- Overall (STATE)
- 15 Strongly Tenant-Friendly
- State New York
- 15 Strongly Tenant-Friendly · D+10
- County
- — inherits STATE
- City
- — inherits STATE
ZIP-level market 11968
- Home prices YoY
- -28.6%
- Rents YoY
- 14.6%
- Active inventory
- 95
- Price-to-rent
- 8.9×
Monthly cashflow live
- Estimated rent
- $37,471 medium interval (Pro) →
- Mortgage (P&I)
- −$10,488
- Tax est. 1.5%
- −$2,500 /mo · $30,000/yr
- Insurance
- −$833
- HOA
- −$0
- Vacancy / Maint / Mgmt
- −$7,869
- Net cashflow
- $15,781
Break-even live
Sensitivity live
| Price | -10% $17,163 | -5% $16,472 | +0% $15,781 | +5% $15,089 | +10% $14,398 |
|---|---|---|---|---|---|
| Rent | -10% $12,820 | -5% $14,300 | +0% $15,781 | +5% $17,261 | +10% $18,741 |
| Rate | -1.0pp $16,788 | -0.5pp $16,289 | base $15,781 | +0.5pp $15,262 | +1.0pp $14,735 |
2-unit breakdown (identical units grouped — click to expand)
| Units | Beds | Baths | Est. rent |
|---|---|---|---|
| 2× units | 3 | 1 | $37,470 |
| #1 | 3 | 1 | $18,735 |
| #2 | 3 | 1 | $18,735 |
| Total (2 units) | $37,471 | ||
UW: 25.0% down · 7.5% · 30yr · 1.5% tax · 5.0% vac · 8.0% maint · 8.0% mgmt
Financing live
Cash to close
- Down payment
- $500,000
- Closing costs
- $60,000
- Reserves months
- —
- Total cash needed
- —
Loan-product check · same deal, 3 products live
Conventional
25% down · 7.5% · 30yr
- Down + closing
- —
- Monthly P&I
- —
- Monthly cashflow
- —
- DSCR
- —
- Eligible?
- —
Personal DTI + credit; lowest rate.
DSCR
20% down · 8.5% · 30yr
- Down + closing
- —
- Monthly P&I
- —
- Monthly cashflow
- —
- DSCR
- —
- Eligible?
- —
No personal income docs; deal must DSCR.
Hard money
10% down · 12.0% · 12mo
- Down + closing
- —
- Monthly P&I
- —
- Monthly cashflow
- —
- DSCR
- —
- Eligible?
- —
Short-term bridge; refi at stabilization.
Rent comps 3 comps
| Address | Beds | Baths | Sqft | Rent | $/sqft | DOM | Units | Dist |
|---|---|---|---|---|---|---|---|---|
| 29 Missapoque Ave Southampton, NY | 4.0 | 2.0 | 1934 | $8,000 | $4.14 | 44d | 1 | 0.94mi |
| 101 Sebonac Inlet Rd Southampton, NY | 4.0 | 3.5 | 2345 | $88,000 | $37.53 | 25d | 1 | 0.94mi |
| 14 Millstone Dr Unit 1520127P Southampton, NY | 4.0 | 2.0 | 1722 | $18,488 | $10.74 | 22d | 1 | 1.32mi |
Listing history 3 events
-
2026-06-18days on market $2,000,000 Coming Soon 2 DOM
-
2026-06-17remarks 610-char remark
-
2026-06-17$2,000,000 Coming Soon 1 DOM
ⓘ Source: listings_history table (triggers on properties + properties_extension) + one-shot
backfill from property_details.listing_events for pre-trigger history.
Climate risk First Street
- Flood 1/10 Low FEMA zone X (unshaded) · 0% chance over 30 yrs
- Wildfire 2/10 Low
- Heat 4/10 Moderate 7 d/yr ≥90°F today · 20 d/yr by 30 yrs out
- Wind 8/10 Severe 80% chance of damaging wind over 30 yrs
- Air quality 3/10 Moderate 3 unhealthy d/yr today · 4 by 30 yrs out
Nearby sold comps map
Loading sold comps map…
Walkable amenities ~0.75 mi
Loading nearby amenities…
Taxation est. · year 1
- Rental income
- $449,652
- − Mortgage interest
- −$112,031
- − Property taxes
- −$30,000
- − Insurance
- −$10,000
- − Repairs & maintenance
- −$35,972
- − Management
- −$35,972
- − Depreciation
- −$58,182
- Taxable income
- $167,495
- Est. tax owed @ 24.0%
- −$40,199
- After-tax cash flow
- $149,168/yr
For passive investors: Depreciation is non-cash, so a rental often shows a tax loss while cash-flowing — sheltering income. Rental losses are passive: they offset passive income freely, and up to $25,000/yr can offset ordinary (W-2) income if you actively participate and your MAGI is under $100k (phasing out to $0 by $150k); unused losses carry forward. On sale, claimed depreciation is recaptured at up to 25%, and gains may owe capital-gains tax (a 1031 exchange can defer both). Figures are a year-1 estimate at your 24.0% rate — not tax advice; consult a CPA.
Schools (NCES district)
- District
- Southampton Union Free School District
- NCES district ID
- 3627540
- Math proficiency
- 53% ▬ 0.00%
- Reading proficiency
- 51% ▲ 4.00%
- Median HH income
- $85,977
- Composite
- 47.9/100
- National rank
- #2213
- State rank
- #293 of 590 in NY
Livability — Tuckahoe
- Score
- 79/100
- State rank
- #125
- US rank
- #2013
Category grades
Schools grade is shown separately in the Schools card above.
Census & demographics
- Census place
- Tuckahoe, NY
- County
- Suffolk County · 679,920 people
- City population
- 9,688
- Metro
- New York-Newark-Jersey City, NY-NJ-PA
- Population (ZIP)
- 15,312
- Household income
- $156,219
- Rent vs Own
- Severe rent burden
- 274.0
Population outlook (Suffolk County) Hauer SSP2
- Today (2025)
- 1,505,262 people
- By 2030
- 1,498,318 · -0.5%
- By 2040
- 1,471,101 · -2.3%
- By 2050
- 1,424,848 · -5.3%
- By 2075
- 1,337,157 · -11.2%
- By 2100
- 1,217,720 · -19.1%
Race, ethnicity, and origin ACS 2023
- Neighborhood character
- Predominantly White (71%)
- Race & ethnicity
- White 71% Hispanic / Latino 13% Two or more races 10% Black 9% Asian 3% Native American 2%
- Hispanic origin (detail)
- Mexican 3% Puerto Rican 2%
- Common ancestry
- Romanian 5% Scotch-Irish 2% Danish 2%
- Foreign-born
- 15% · Canada, Jamaica, Vietnam
- Languages at home
- 81% English-only · Spanish 11% Other Indo-European 3% German/W. Germanic 2%
Political lean MEDSL · Suffolk
- 2024 margin
- Lean R (+10.0) · D 45.0% · R 55.0%
- 2008→2024 swing
- -16.0pp toward R · 2008: 6.0pp · 2024: -10.0pp
- All cycles
- 2024: R+10.0 2020: R+0.0 2016: R+8.2 2012: D+2.9 2008: D+6.0
Not yet ingested
- Civics
- —
Market trends
- HPI YoY
- ▼ -184.86%
- Current HPI
- 461.1144
- Rent YoY
- ▲ 14.62%
- Metro
- New York-Newark-Jersey City, NY-NJ-PA
- State GDP YoY
- ▲ 2.60%
- F500 in state
- 92
Industry mix (Fortune 500 HQ in NY)
| Industry | F500 HQs | Revenue |
|---|---|---|
| Financial Services | 10 | $950B |
|
||
| Consumer Goods | 9 | $162B |
|
||
| Insurance | 4 | $225B |
|
||
| Telecommunications | 2 | $144B |
|
||
| Pharmaceuticals | 2 | $112B |
|
||
| Media / Entertainment | 2 | $69B |
|
||
Price history
1 event — show timeline
- 1990-10-04 Sold (Public Records) $50,000 Public Records
Property tax history
-1.4%/yrLatest (2022): $1,728 · +0.0% YoY. Source: county tax records.
Cash-flow waterfall
monthlySold comps — $/sqft
last 12 mo · ≤1 miLoading sold comps…