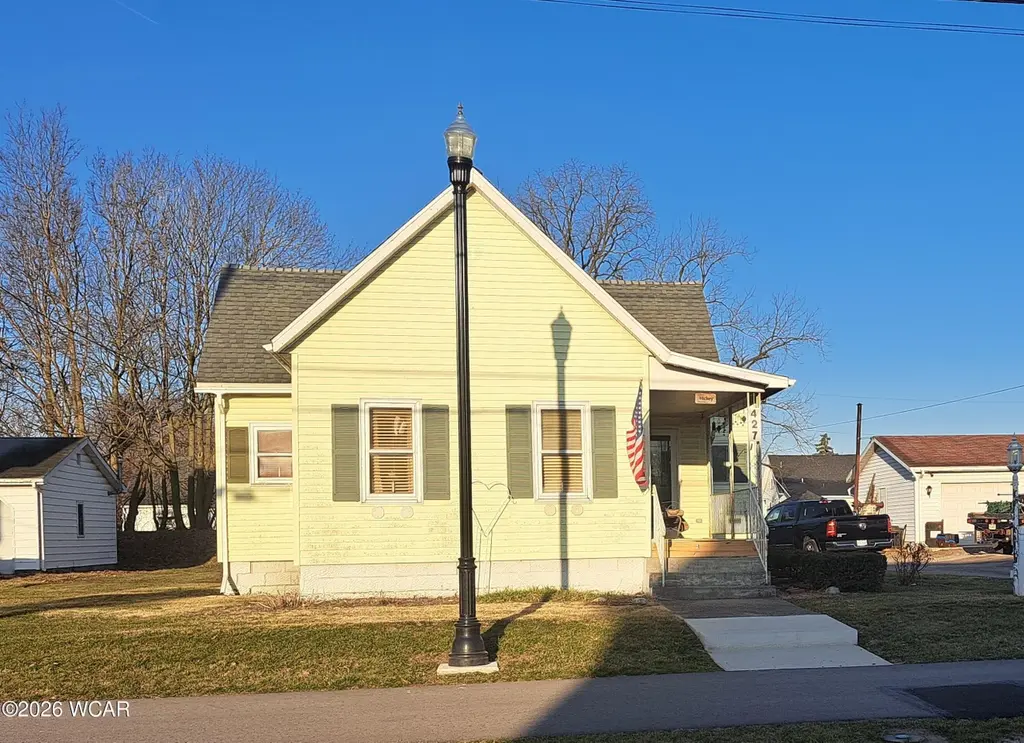
427 S Main St · Delphos, OH
Flood risk 6/10 · Moderate
- FEMA flood zone
- AE
- Chance of flooding over 30 yrs
- 0.74%
- Est. flood insurance / yr
- $2,026 – $9,024
Fire risk 1/10 · Minimal
- Est. fire insurance / yr
- $713 – $1,323
Heat risk 3/10 · Minor
- Hot days now (above 101°F)
- 7 days/yr
- Hot days in 30 yrs
- 17 days/yr
Wind risk 2/10 · Minimal
- Chance of severe wind over 30 yrs
- —
Air-quality risk 2/10 · Minimal
- Unhealthy air days now
- 1 days/yr
- Unhealthy air days in 30 yrs
- 2 days/yr
Risk factors via First Street. Map © Google.
Why this score? — see what drove the C+ grade
The composite is a weighted blend of 9 inputs, each scored 0–100. Each bar is that input's sub-score; the figure is the points it added to the 100-point composite (weight × sub-score).
- Cash flow +20.7/30.0
- ARV discount +15.0/15.0
- DSCR +6.6/10.0
- Schools +6.4/10.0
- 1% rule +4.9/10.0
- Livability +3.6/5.0
- Rent growth +2.5/5.0
- Condition / age +2.5/5.0
- Appreciation +0.0/10.0
$105,000
🖨 Deal sheet (PDF) 📄 Offer letter ✓ Due diligence
Listing remarks
Welcome to 427 S Main Street Delphos Ohio. This home is cozy that could use a little love. Been occupied by same family since 1972. It offers 3 beds, 1 bath, large living room, main level laundry, gas forced air heat & central air conditioning, 2 car detached garage.
Key facts
- 7,062 sq ft lot
- 2 garage spots
- Built 1920
Property features AI
Finance
- Other: Lot dimensions approximately 66 x 107
- Financial info: Annual property tax listed (amount not included per instructions)
- HOA & community: No HOA information provided
Exterior
- Parking: Detached 2-car garage
- Security: No security features provided
- Utilities: Public water; Public sewer; Electricity connected; Natural gas connected; Water connected
- Home design: Single-family residence; One level; Residential zoning; Property listed in fixer condition
- Construction: Vinyl siding; Block foundation; Built with block basement
- Exterior features: Front porch; Garage(s) on property
Interior
- Kitchen: Range; Refrigerator
- Bedrooms: Total of 6 rooms (bedroom counts not specified)
- Flooring: Carpet; Laminate
- Bathrooms: 1 full bathroom
- Heating & cooling: Central air conditioning; Forced air heating; Natural gas heating
- Interior features: Drapes on windows; Block partial basement
- Laundry & utility: No specific laundry details provided
Neighborhood map
What this means for you Summary
Snapshot
- This is a 3-bed/1.0-bath single-family listed at $105k.
Deal economics
- At list price, monthly cash flow is $-317 ($-4k/yr) — negative.
- To cash-flow at today's rent, offer at most $49k (53.4% below list).
- To meet the 1% rule (rent ≥ 1% of price), the offer needs to be $104k (0.5% below list).
- Recommended offer: $49k (53.4% below list) — sets the bar for cash-flow.
- Cap rate 7.9% vs local median 3.9% in Delphos — top-decile yield for the area; either an underpriced asset or a hidden risk that comps aren't pricing in. Stress-test before assuming the spread holds.
Location & tenants
- Location reads 72/100 on livability (#378 in OH) — a middle-class / working-renter tenant base. Strengths: schools A+, crime A+, cost of living A+; Watch: employment D, amenities F, commute F.
- Delphos City (town): math 77% / reading 75% proficiency, ranked #91 of 656 in OH (top 14%) — strong family-tenant draw, lease renewals of 3-5y typical.
- Market conditions: 16 active listings in the ZIP; 88 units permitted in Allen County in 2024 (0 in 5+ unit buildings).
Forward outlook
- Local home prices are declining (-3.0%/yr); year-one equity from $726 of loan paydown is wiped out by about $3k of value loss. Plan a longer hold.
- Allen County population projected at -14% by 2050 — secular population decline; favor cash flow + early exit over multi-decade hold.
Negotiation context
- Only 3 days on market — expect competitive offers; lowballing is unlikely to land.
Risks & watch-outs
- Watch-outs: flood insurance adds $460/mo; built in 1920 — expect roof / HVAC / electrical / plumbing capex.
- Climate carrying-cost: in FEMA flood zone AE (mandatory federal flood insurance) — expect insurance premiums to compound above CPI over the hold.
Questions for the listing agent
- What do current leases actually rent for vs. the listed asking? Can we see a recent rent roll and the last 12 months of T-12 income?
- Built in 1920 — when were the roof, HVAC, electrical panel, plumbing, and water heater last replaced?
- What's the actual annual flood-insurance premium (NFIP or private), and is the property in a SFHA with mandatory coverage?
- Is there a deadline driving the sale (1031 exchange, divorce, estate, relocation)? That informs how much negotiation room exists.
- Schools are A-rated — typically a magnet for longer-tenancy family renters. What's the average tenant stay here, and is there a school-zone premium baked into asking?
- What's the average days-on-market for RENTAL listings here right now (not sales)? A rising rental-DOM trend means longer vacancies and softer asking-rent achievability than the comps imply.
- What's the recent tenant-quality profile in this submarket — average credit score on applications, eviction rate, late-payment / NSF rate, and stable-employment percentage? A property-management company in the area should have these aggregated.
- How much new for-sale + rental construction is in the pipeline within 1–3 miles? Heavy new supply typically softens prices + rents 12–24 months out; constrained supply supports both.
Investment metrics
- 1% rule
- 0.99% ✗
- Cap rate
- 7.93%
- Cash-on-cash
- 5.84%
- DSCR
- 1.26
- GRM
- 8.4
CMA / ARV
- ARV (on-the-fly)
- $139,880
- Comps found
- 12
Show comp detail 12 sales within ~0.75 mi
| Address | Dist | Beds/Ba | Sqft | Sold | Price | $/sf | Match |
|---|---|---|---|---|---|---|---|
| 508 S Washington St | 0.16mi | 3/1.0 | 1,116 (+4%) | 7mo | $33,000 | $30 | 81 |
| 310 S Pierce St | 0.25mi | 2/1.0 (-1) | 1,067 (-1%) | 7mo | $96,000 | $90 | 76 |
| 629 N Main St | 0.67mi | 3/1.0 | 1,060 (-2%) | 2mo | $169,650 | $160 | 64 |
| 620 Jackson St | 0.40mi | 2/1.0 (-1) | 1,048 (-3%) | 11mo | $110,000 | $105 | 62 |
| 504 S Franklin St | 0.20mi | 3/1.0 | 1,228 (+14%) | 10mo | $210,000 | $171 | 58 |
| 534 N Bredeick St | 0.67mi | 3/1.0 | 1,104 (+3%) | 9mo | $149,900 | $136 | 57 |
| 903 E 3rd St | 0.71mi | 3/1.5 | 1,107 (+3%) | 6mo | $139,000 | $126 | 55 |
| 415 W Fifth St | 0.60mi | 3/2.0 | 1,140 (+6%) | 8mo | $154,900 | $136 | 51 |
| 832 Erie St | 0.49mi | 3/1.5 | 1,200 (+12%) | 8mo | $156,500 | $130 | 50 |
| 241 King St | 0.58mi | 3/2.0 | 1,196 (+11%) | 3mo | $189,000 | $158 | 48 |
| 604 W Sixth St | 0.73mi | 2/1.0 (-1) | 1,131 (+5%) | 6mo | $76,000 | $67 | 48 |
| 224 Monroe St | 0.61mi | 2/1.0 (-1) | 960 (-11%) | 9mo | $124,500 | $130 | 41 |
Match score weights: distance 35% · size 25% · config 20% · recency 20%. Top-matched comps best support the ARV.
Projected returns pro-forma
-3.0% appreciation · 3.0% rent growth · sell at horizon
- IRR
- -39.9%
- Equity multiple
- -0.26×
- Total profit
- $-36,954
- Equity at exit
- $15,656
- IRR
- -60.1%
- Equity multiple
- -0.94×
- Total profit
- $-57,099
- Equity at exit
- $9,078
Cash invested: $29,400 (down + closing). Projections, not guarantees.
Landlord ↔ Tenant lean methodology
- Overall (STATE)
- 73 Landlord-Friendly
- State Ohio
- 73 Landlord-Friendly · R+6
- County
- — inherits STATE
- City
- — inherits STATE
ZIP-level market 45833
- Home prices YoY
- -15.4%
- Active inventory
- 16
- Price-to-rent
- 8.4×
Monthly cashflow live
- Estimated rent
- $1,044 medium interval (Pro) →
- Mortgage (P&I)
- −$551
- Tax from tax record
- −$88 /mo · $1,051/yr
- Insurance
- −$44
- Flood insurance flood zone
- −$460 /mo · $5,525/yr
- HOA
- −$0
- Vacancy / Maint / Mgmt
- −$219
- Net cashflow
- $-317
Break-even live
Sensitivity live
| Price | -10% $-258 | -5% $-288 | +0% $-317 | +5% $-347 | +10% $-377 |
|---|---|---|---|---|---|
| Rent | -10% $-400 | -5% $-359 | +0% $-317 | +5% $-276 | +10% $-235 |
| Rate | -1.0pp $-264 | -0.5pp $-291 | base $-317 | +0.5pp $-345 | +1.0pp $-372 |
UW: 25.0% down · 7.5% · 30yr · 1.5% tax · 5.0% vac · 8.0% maint · 8.0% mgmt
Financing live
Cash to close
- Down payment
- $26,250
- Closing costs
- $3,150
- Reserves months
- —
- Total cash needed
- —
Loan-product check · same deal, 3 products live
Conventional
25% down · 7.5% · 30yr
- Down + closing
- —
- Monthly P&I
- —
- Monthly cashflow
- —
- DSCR
- —
- Eligible?
- —
Personal DTI + credit; lowest rate.
DSCR
20% down · 8.5% · 30yr
- Down + closing
- —
- Monthly P&I
- —
- Monthly cashflow
- —
- DSCR
- —
- Eligible?
- —
No personal income docs; deal must DSCR.
Hard money
10% down · 12.0% · 12mo
- Down + closing
- —
- Monthly P&I
- —
- Monthly cashflow
- —
- DSCR
- —
- Eligible?
- —
Short-term bridge; refi at stabilization.
Listing history 4 events
-
2026-06-21days on market $105,000 Active 3 DOM
-
2026-06-21days on market $105,000 Active 2 DOM
-
2026-06-18remarks 270-char remark
-
2026-06-18$105,000 Active 1 DOM
ⓘ Source: listings_history table (triggers on properties + properties_extension) + one-shot
backfill from property_details.listing_events for pre-trigger history.
Tax reassessment forecast OH · Partial reset (capped growth)
- Current annual tax
- $1,051 · $88/mo
- Projected year-2 tax
- $1,345 · $112/mo
- Expected delta
- +$293/yr (+$24/mo · 27.9%)
ⓘ Screening estimate from a state-policy table — verify with the county assessor before closing.
Climate risk First Street
- Flood 6/10 Major FEMA zone AE · 74% chance over 30 yrs
- Wildfire 1/10 Low
- Heat 3/10 Moderate 7 d/yr ≥101°F today · 17 d/yr by 30 yrs out
- Wind 2/10 Low
- Air quality 2/10 Low 1 unhealthy d/yr today · 2 by 30 yrs out
Nearby sold comps map
Loading sold comps map…
Walkable amenities ~0.75 mi
Loading nearby amenities…
Taxation est. · year 1
- Rental income
- $12,533
- − Mortgage interest
- −$5,882
- − Property taxes
- −$1,051
- − Insurance
- −$6,050
- − Repairs & maintenance
- −$1,003
- − Management
- −$1,003
- − Depreciation
- −$3,055
- Taxable loss
- −$5,510
- Est. tax savings @ 24.0%
- +$1,322
- After-tax cash flow
- $-2,486/yr
For passive investors: Depreciation is non-cash, so a rental often shows a tax loss while cash-flowing — sheltering income. Rental losses are passive: they offset passive income freely, and up to $25,000/yr can offset ordinary (W-2) income if you actively participate and your MAGI is under $100k (phasing out to $0 by $150k); unused losses carry forward. On sale, claimed depreciation is recaptured at up to 25%, and gains may owe capital-gains tax (a 1031 exchange can defer both). Figures are a year-1 estimate at your 24.0% rate — not tax advice; consult a CPA.
Schools (NCES district)
- District
- Delphos City
- NCES district ID
- 3904388
- Math proficiency
- 77% ▼ -8.00%
- Reading proficiency
- 75% ▼ -8.00%
- Median HH income
- $49,400
- Composite
- 64.3/100
- National rank
- #557
- State rank
- #91 of 656 in OH
Livability — Delphos
- Score
- 72/100
- State rank
- #378
- US rank
- #6142
Category grades
Schools grade is shown separately in the Schools card above.
Census & demographics
- Census place
- Delphos, OH
- County
- Van Wert · 34,605 people
- City population
- 10,822
- Population (ZIP)
- 10,822
- Household income
- $66,919
- Rent vs Own
- Severe rent burden
- 2.2
Population outlook (Allen County) Hauer SSP2
- Today (2025)
- 100,321 people
- By 2030
- 97,693 · -2.6%
- By 2040
- 91,802 · -8.5%
- By 2050
- 86,152 · -14.1%
- By 2075
- 73,659 · -26.6%
- By 2100
- 58,716 · -41.5%
Race, ethnicity, and origin ACS 2023
- Neighborhood character
- Predominantly White (94%)
- Race & ethnicity
- White 94% Two or more races 3% Hispanic / Latino 2% Black 2%
- Common ancestry
- Serbian 2% Lithuanian 2% Iranian 2%
- Foreign-born
- 1% · Canada
- Languages at home
- 98% English-only · German/W. Germanic 1%
Political lean MEDSL · Allen
- 2024 margin
- Solid R (+44.1) · D 27.5% · R 71.6%
- 2008→2024 swing
- -23.4pp toward R · 2008: -20.7pp · 2024: -44.1pp
- All cycles
- 2024: R+44.1 2020: R+39.5 2016: R+38.2 2012: R+25.7 2008: R+20.7
Not yet ingested
- Civics
- —
Market trends
- HPI YoY
- ▼ -39.82%
- Current HPI
- 218.1437
- Rent YoY
- —
- Metro
- —
- State GDP YoY
- ▲ 1.98%
- F500 in state
- 48
Industry mix (Fortune 500 HQ in OH)
| Industry | F500 HQs | Revenue |
|---|---|---|
| Insurance | 3 | $145B |
|
||
| Industrial Machinery | 3 | $49B |
|
||
| Financial Services | 3 | $24B |
|
||
| Consumer Goods | 2 | $93B |
|
||
| Aerospace / Defense | 2 | $47B |
|
||
| Utilities | 2 | $33B |
|
||
Price history
1 event — show timeline
- 2026-06-17 Listed $105,000 WCARE
Property tax history
+4.6%/yrLatest (2025): $1,051 · +0.2% YoY. Source: county tax records.
Cash-flow waterfall
monthlySold comps — $/sqft
last 12 mo · ≤1 miLoading sold comps…