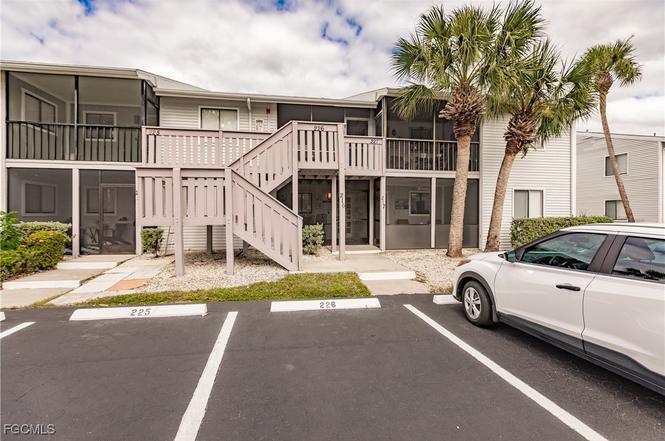
1055 Palm Ave #216 · North Fort Myers, FL
Flood risk 7/10 · Major
- FEMA flood zone
- AE
- Chance of flooding over 30 yrs
- 0.76%
- Est. flood insurance / yr
- $1,737 – $8,500
Fire risk 2/10 · Minimal
- Est. fire insurance / yr
- $947 – $1,759
Heat risk 10/10 · Severe
- Hot days now (above 106°F)
- 7 days/yr
- Hot days in 30 yrs
- 29 days/yr
Wind risk 10/10 · Severe
- Chance of severe wind over 30 yrs
- 99.0%
Air-quality risk 2/10 · Minimal
- Unhealthy air days now
- 1 days/yr
- Unhealthy air days in 30 yrs
- 1 days/yr
Risk factors via First Street. Map © Google.
Why this score? — see what drove the B- grade
The composite is a weighted blend of 9 inputs, each scored 0–100. Each bar is that input's sub-score; the figure is the points it added to the 100-point composite (weight × sub-score).
- Cash flow +27.6/30.0
- 1% rule +10.0/10.0
- DSCR +9.7/10.0
- ARV discount +7.5/15.0
- Schools +4.1/10.0
- Livability +3.7/5.0
- Condition / age +2.5/5.0
- Rent growth +2.0/5.0
- Appreciation +0.0/10.0
$104,500
🖨 Deal sheet 📄 Offer letter ✓ Due diligence
Listing remarks
AFFORDABLE, AND MOVE-IN READY in a PRIME LOCATION! Discover this spacious 1st-floor, 2-bedroom, 2-full-bath condo located just minutes from downtown shopping, restaurants, grocery stores, and Marina town on the water! This is the perfect affordable second home for snowbirds or anyone seeking comfort and convenience. Features include: NEW stainless steel appliances, NEW hot water heater and bath fixtures, Granite countertops and dual sinks in the master bath, Freshly painted interior with an open floor plan, Tiled floors throughout the main areas and NEW carpeting in the bedrooms. Relax on your newly screened front porch or enjoy the tranquility of your back lanai. Additional perks include a
Key facts
- Dual sinks
- New hot water heater
- Granite countertops
Tags
Property features AI
Finance
- Financial info: Rental/pet policy: pets allowed conditionally; contact for details; Maximum of 3 pets, maximum pet weight 35 lbs
- HOA & community: Has homeowners association; Monthly association fee of $530; Association covers pest control, road maintenance, street lights, and trash; Association amenities include pool and management; Community of 36 units; Non-gated community
Exterior
- Parking: Parking details not provided
- Security: Smoke detector(s)
- Utilities: Cable available; Public sewer; Public water
- Home design: Two-story building; Entry level is 1; Faces south; North exposure noted
- Construction: Wood siding; Wood frame construction; Shingle roof; Resale condition
- Exterior features: Lanai; Porch; Screened porch; Community pool; Smoke detector(s); No additional exterior features listed
Interior
- Kitchen: Electric cooktop; Freezer; Refrigerator
- Bedrooms: Screened porch (listed as a room type)
- Flooring: Carpet; Tile
- Bathrooms: 2 full bathrooms
- Heating & cooling: Central heating (electric); Central air conditioning (electric)
- Interior features: Living/dining room; Family/dining room; Shower only with separate shower; Window coverings / treatments; Single hung windows
- Laundry & utility: Washer hookup; Dryer hookup
Neighborhood map
What this means for you Summary
Snapshot
- This is a 2-bed/2.0-bath condo listed at $104k.
Deal economics
- At list price, monthly cash flow is $-114 ($-1k/yr) — negative.
- To cash-flow at today's rent, offer at most $84k (19.3% below list).
- Meets the 1% rule at list price ($2k rent vs $104k).
- Recommended offer: $84k (19.3% below list) — sets the bar for cash-flow.
- Cap rate 9.9% vs local median 3.6% in North Fort Myers — top-decile yield for the area; either an underpriced asset or a hidden risk that comps aren't pricing in. Stress-test before assuming the spread holds.
Location & tenants
- Location reads 74/100 on livability (#269 in FL, #4,409 nationally) — a middle-class / working-renter tenant base. Strengths: cost of living A+, housing A+, health & safety A+; Watch: employment C-, amenities F, commute F.
- Lee (suburban): math 47% / reading 50% proficiency, ranked #42 of 73 in FL (top 58%) — families likely to look elsewhere, expect single-tenant / working-renter base with shorter leases.
- Market conditions: Rents soft (-1.9%/yr); 472 active listings in the ZIP; 36 comparable units currently listed for rent nearby; rentals at typical pace (median 24d on market — plan ~3-4 weeks tenant-placement turnaround); 15,411 units permitted in Lee County in 2024 (4,686 in 5+ unit buildings).
- This rent runs 40% of the median local income ($57k/yr) — at the standard rent-burdened threshold; future hikes will face affordability resistance.
Forward outlook
- Local home prices are declining (-3.0%/yr); year-one equity from $722 of loan paydown is wiped out by about $3k of value loss. Plan a longer hold.
- Lee County population projected at +44% by 2050 — long-run rental-demand tailwind backs the buy-and-hold thesis.
Negotiation context
- It's been on market 189 days — a 12% lower offer ($92k) is reasonable based on typical stale-listing flexibility.
- 2 sale attempts since 2y ago with the ask held roughly flat each time — persistent listings suggest the price (not the market) is what's stuck; bring a comps-based counter.
Risks & watch-outs
- Watch-outs: flood insurance adds $427/mo; HOA is 28% of rent.
- Climate carrying-cost: in FEMA flood zone AE (mandatory federal flood insurance); severe wind risk, 99% chance of damaging wind over 30y; extreme-heat days projected 7→29/yr by 2055 (HVAC capex compounding) — expect insurance premiums to compound above CPI over the hold.
Questions for the listing agent
- What do current leases actually rent for vs. the listed asking? Can we see a recent rent roll and the last 12 months of T-12 income?
- It's been on market 189 days. Have you received any prior offers? Is the seller open to a 19% concession, seller financing, or rate buy-down credit?
- What's the actual annual flood-insurance premium (NFIP or private), and is the property in a SFHA with mandatory coverage?
- What does the HOA fee cover, when was the last increase, and are there any pending special assessments or reserve-fund shortfalls?
- Any open or pending special assessments — roof, HVAC, plumbing, elevator, façade? What's the per-unit balance and payoff schedule, and is the seller paying it off at close or rolling it to the buyer?
- Why hasn't it sold? Are there any deal-killer items the seller is aware of (foundation, flood, title, zoning, code violations)?
- Is there a deadline driving the sale (1031 exchange, divorce, estate, relocation)? That informs how much negotiation room exists.
- What's the average days-on-market for RENTAL listings here right now (not sales)? A rising rental-DOM trend means longer vacancies and softer asking-rent achievability than the comps imply.
- What's the recent tenant-quality profile in this submarket — average credit score on applications, eviction rate, late-payment / NSF rate, and stable-employment percentage? A property-management company in the area should have these aggregated.
- How much new apartment / multifamily construction is in the pipeline within 1–3 miles? Heavy new supply (>2% of stock underway) typically softens rents 12–24 months out; light construction supports rent growth.
Investment metrics
- 1% rule
- 1.84% ✓
- Cap rate
- 9.88%
- Cash-on-cash
- 12.81%
- DSCR
- 1.57
- GRM
- 4.5
CMA / ARV
No comps found within radius.
Projected returns pro-forma
-3.0% appreciation · 0.0% rent growth · sell at horizon
- IRR
- -32.4%
- Equity multiple
- 0.00×
- Total profit
- $-29,247
- Equity at exit
- $15,581
- IRR
- —
- Equity multiple
- -0.85×
- Total profit
- $-54,202
- Equity at exit
- $9,035
Cash invested: $29,260 (down + closing). Projections, not guarantees.
Landlord ↔ Tenant lean methodology
- Overall (STATE)
- 87 Strongly Landlord-Friendly
- State Florida
- 87 Strongly Landlord-Friendly · R+3
- County
- — inherits STATE
- City
- — inherits STATE
ZIP-level market 33903
- Rents YoY
- -1.9%
- Active inventory
- 472
- Price-to-rent
- 4.5×
Monthly cashflow live
- Estimated rent
- $1,921 high interval (Pro) →
- Mortgage (P&I)
- −$548
- Tax from tax record
- −$84 /mo · $1,008/yr
- Insurance
- −$44
- Flood insurance flood zone
- −$427 /mo · $5,118/yr
- HOA
- −$530
- Vacancy / Maint / Mgmt
- −$404
- Net cashflow
- $-114
Break-even live
UW: 25.0% down · 7.5% · 30yr · 1.5% tax · 5.0% vac · 8.0% maint · 8.0% mgmt
Financing live
Cash to close
- Down payment
- $26,125
- Closing costs
- $3,135
- Reserves months
- —
- Total cash needed
- —
Loan-product check · same deal, 3 products live
Conventional
25% down · 7.5% · 30yr
- Down + closing
- —
- Monthly P&I
- —
- Monthly cashflow
- —
- DSCR
- —
- Eligible?
- —
Personal DTI + credit; lowest rate.
DSCR
20% down · 8.5% · 30yr
- Down + closing
- —
- Monthly P&I
- —
- Monthly cashflow
- —
- DSCR
- —
- Eligible?
- —
No personal income docs; deal must DSCR.
Hard money
10% down · 12.0% · 12mo
- Down + closing
- —
- Monthly P&I
- —
- Monthly cashflow
- —
- DSCR
- —
- Eligible?
- —
Short-term bridge; refi at stabilization.
Rent comps 36 comps
| Address | Beds | Baths | Sqft | Rent | $/sqft | DOM | Units | Dist |
|---|---|---|---|---|---|---|---|---|
| 8049 Stillwater Ct North Fort Myers, FL | 1.0–2.0 | 1.0–2.0 | 720 | $1,600 | $2.22 | 23d | 1 | 0.11mi |
| 3462 Hancock Bridge Pkwy #242 North Fort Myers, FL | 2.0 | 2.0 | 1152 | $1,750 | $1.52 | 23d | 1 | 0.13mi |
| 1201 Betmar Blvd North Fort Myers, FL | 3.0 | 2.0 | 1380 | $2,200 | $1.59 | 3d | 1 | 0.30mi |
| 3490 N Key Dr #514 North Fort Myers, FL | 2.0 | 2.0 | 1103 | $1,495 | $1.36 | 23d | 1 | 0.36mi |
| 3490 N Key Dr #203 North Fort Myers, FL | 1.0 | 1.5 | 840 | $1,300 | $1.55 | 23d | 1 | 0.36mi |
| 3490 N Key Dr #211 North Fort Myers, FL | 2.0 | 2.0 | 1412 | $1,550 | $1.10 | 23d | 1 | 0.36mi |
| 3490 N Key Dr #511 North Fort Myers, FL | 2.0 | 2.0 | 1412 | $1,650 | $1.17 | 23d | 1 | 0.36mi |
| 3490 N Key Dr #410 North Fort Myers, FL | 2.0 | 2.0 | 1412 | $3,900 | $2.76 | 23d | 1 | 0.36mi |
| 3460 N Key Dr #210 North Fort Myers, FL | 2.0 | 2.0 | 1412 | $1,795 | $1.27 | 14d | 1 | 0.37mi |
| 3460 N Key Dr #311 North Fort Myers, FL | 2.0 | 2.0 | 1412 | $3,200 | $2.27 | 23d | 1 | 0.37mi |
| 3460 N Key Dr #203 North Fort Myers, FL | 1.0 | 1.5 | 840 | $3,250 | $3.87 | 23d | 1 | 0.38mi |
| 3460 N Key Dr Fort Myers, FL | 2.0 | 2.0 | 1440 | $1,800 | $1.25 | 15d | 1 | 0.38mi |
| 3460 N Key Dr Fort Myers, FL | 2.0 | 2.0 | 1412 | $1,800 | $1.27 | 23d | 1 | 0.38mi |
| 3392 N Key Dr #7 North Fort Myers, FL | 2.0 | 2.0 | 1200 | $1,895 | $1.58 | 23d | 1 | 0.39mi |
| 3345 N Key Dr #47 North Fort Myers, FL | 2.0 | 2.5 | 1112 | $2,150 | $1.93 | 23d | 1 | 0.42mi |
| 3350 N Key Dr Unit B911 North Fort Myers, FL | 3.0 | 2.0 | 1283 | $3,800 | $2.96 | 23d | 1 | 0.45mi |
| 3350 N Key Dr #713 North Fort Myers, FL | 3.0 | 2.0 | 1207 | $2,250 | $1.86 | 3d | 1 | 0.45mi |
| 3342 N Key Dr Unit L3 North Fort Myers, FL | 2.0 | 1.0 | 791 | $1,490 | $1.88 | 23d | 1 | 0.48mi |
| 3324 N Key Dr #7 North Fort Myers, FL | 2.0 | 1.0 | 791 | $1,495 | $1.89 | 23d | 1 | 0.51mi |
| 3328 N Key Dr #5 North Fort Myers, FL | 2.0 | 1.0 | 791 | $1,400 | $1.77 | 23d | 1 | 0.54mi |
| 3328 N Key Dr North Fort Myers, FL | 2.0 | 1.0 | 800 | $1,400 | $1.75 | 3d | 1 | 0.54mi |
| 3300 N Key Dr Unit 4W North Fort Myers, FL | 2.0 | 2.0 | 1103 | $3,000 | $2.72 | 23d | 1 | 0.56mi |
| 3392 N Key Dr Unit B7 North Fort Myers, FL | 2.0 | 2.0 | 1200 | $1,895 | $1.58 | 10d | 1 | 0.59mi |
| 3392 N Key Dr North Fort Myers, FL | 2.0 | 2.0 | 1270 | $1,850 | $1.46 | 21d | 1 | 0.59mi |
| 92 Oak St North Fort Myers, FL | 2.0 | 2.0 | 1008 | $2,000 | $1.98 | 3d | 1 | 0.69mi |
| 1260 Joerin Ave North Fort Myers, FL | 1.0 | 1.0 | 936 | $1,105 | $1.18 | 23d | 1 | 0.70mi |
| 1195 Green Ave North Fort Myers, FL | 3.0 | 2.0 | 1250 | $1,850 | $1.48 | 23d | 1 | 0.72mi |
| 1288 Waite Dr North Fort Myers, FL | 2.0 | 2.0 | 972 | $2,200 | $2.26 | 23d | 1 | 0.76mi |
| 1310 Thompson St North Fort Myers, FL | 3.0 | 3.0 | 1387 | $2,800 | $2.02 | 23d | 1 | 0.77mi |
| 750 Pondella Rd North Fort Myers, FL | 2.0–3.0 | 1.0–2.0 | 1200 | $1,099 | $0.92 | 1d | 6 | 1.04mi |
| 1526 Wood Rd North Fort Myers, FL | 1.0 | 1.0 | 912 | $1,500 | $1.64 | 3d | 1 | 1.06mi |
| 21 Crescent Lake Dr Unit 21 North Fort Myers, FL | 2.0 | 1.0 | 900 | $1,550 | $1.72 | 23d | 1 | 1.12mi |
| 112 Crescent Lake Dr North Fort Myers, FL | 2.0 | 1.0 | 980 | $1,700 | $1.73 | 23d | 1 | 1.31mi |
| 69 E Mariana Ave Unit B North Fort Myers, FL | 3.0 | 1.0 | 1000 | $1,795 | $1.79 | 3d | 1 | 1.38mi |
| 1398 Evalena Ln North Fort Myers, FL | 3.0 | 2.0 | 1479 | $1,849 | $1.25 | 1d | 1 | 1.42mi |
| 2627 Riverfield Rd Cape Coral, FL | 3.0 | 2.5 | 1324 | $1,424 | $1.08 | 23d | 1 | 1.42mi |
HOA detail condo
- Monthly dues
- $530 · $6,360/yr
- Likely covers
- water
- Assessments
- None detected in remarks — confirm with the listing agent.
Listing history 22 events
-
2026-06-17days on market $104,500 Active 189 DOM
-
2026-06-16days on market $104,500 Active 188 DOM
-
2026-06-15days on market $104,500 Active 187 DOM
-
2026-06-13days on market $104,500 Active 185 DOM
-
2026-06-10days on market $104,500 Active 182 DOM
-
2026-06-09days on market $104,500 Active 181 DOM
-
2026-06-07days on market $104,500 Active 179 DOM
-
2026-06-02days on market $104,500 Active 174 DOM
-
2026-06-01days on market $104,500 Active 173 DOM
-
2026-06-01days on market $104,500 Active 172 DOM
-
2026-04-08price $104,500
-
2026-03-25price $75,000
-
2025-12-10$104,990 Active
-
2025-11-24historical
-
2025-03-17price $115,000
-
2024-11-19$129,000 Active
-
2020-10-21soldstatus $95,000
-
2019-12-04soldstatus $59,900
-
2003-04-18soldstatus $68,000
-
2000-11-03soldstatus $39,900
-
1998-08-13soldstatus $36,000
-
1995-10-12soldstatus $36,500
ⓘ Source: listings_history table (triggers on properties + properties_extension) + one-shot
backfill from property_details.listing_events for pre-trigger history.
Tax reassessment forecast FL · Resets to sale price
- Current annual tax
- $1,008 · $84/mo
- Projected year-2 tax
- $1,008 · $84/mo
- Expected delta
- $0/yr ($0/mo · 0.0%)
ⓘ Screening estimate from a state-policy table — verify with the county assessor before closing.
Climate risk First Street
- Flood 7/10 Severe FEMA zone AE · 76% chance over 30 yrs
- Wildfire 2/10 Low
- Heat 10/10 Extreme 7 d/yr ≥106°F today · 29 d/yr by 30 yrs out
- Wind 10/10 Extreme 99% chance of damaging wind over 30 yrs
- Air quality 2/10 Low 1 unhealthy d/yr today · 1 by 30 yrs out
Nearby sold comps map
Loading sold comps map…
Walkable amenities ~0.75 mi
Loading nearby amenities…
Taxation est. · year 1
- Rental income
- $23,057
- − Mortgage interest
- −$5,854
- − Property taxes
- −$1,008
- − Insurance
- −$5,641
- − Repairs & maintenance
- −$1,845
- − Management
- −$1,845
- − HOA
- −$6,360
- − Depreciation
- −$3,040
- Taxable loss
- −$2,535
- Est. tax savings @ 24.0%
- +$608
- After-tax cash flow
- $-762/yr
For passive investors: Depreciation is non-cash, so a rental often shows a tax loss while cash-flowing — sheltering income. Rental losses are passive: they offset passive income freely, and up to $25,000/yr can offset ordinary (W-2) income if you actively participate and your MAGI is under $100k (phasing out to $0 by $150k); unused losses carry forward. On sale, claimed depreciation is recaptured at up to 25%, and gains may owe capital-gains tax (a 1031 exchange can defer both). Figures are a year-1 estimate at your 24.0% rate — not tax advice; consult a CPA.
Schools (NCES district)
- District
- Lee
- NCES district ID
- 1201080
- Math proficiency
- 47% ▼ -11.00%
- Reading proficiency
- 50% ▼ -4.00%
- Median HH income
- $49,518
- Composite
- 41.49/100
- National rank
- #3458
- State rank
- #42 of 73 in FL
Livability — North Fort Myers
- Score
- 74/100
- State rank
- #269
- US rank
- #4409
Category grades
Schools grade is shown separately in the Schools card above.
Census & demographics
- Census place
- North Fort Myers, FL
- County
- Lee County · 788,662 people
- City population
- 57,035
- Metro
- Cape Coral-Fort Myers, FL
- Population (ZIP)
- 23,655
- Household income
- $56,993
- Rent vs Own
- Severe rent burden
- 468.0
Population outlook (Lee County) Hauer SSP2
- Today (2025)
- 871,946 people
- By 2030
- 955,468 · +9.6%
- By 2040
- 1,113,587 · +27.7%
- By 2050
- 1,256,891 · +44.1%
- By 2075
- 1,560,270 · +78.9%
- By 2100
- 1,726,848 · +98.0%
Race, ethnicity, and origin ACS 2023
- Neighborhood character
- Predominantly White (81%)
- Race & ethnicity
- White 81% Hispanic / Latino 14% Two or more races 8% Black 2%
- Hispanic origin (detail)
- Mexican 3% Puerto Rican 3% Cuban 3%
- Common ancestry
- Lithuanian 4% Romanian 4% Italian 3%
- Foreign-born
- 11% · Canada
- Languages at home
- 88% English-only · Spanish 9% Other Indo-European 1%
Political lean MEDSL · Lee
- 2024 margin
- Strong R (+28.4) · D 35.5% · R 63.9%
- 2008→2024 swing
- -18.0pp toward R · 2008: -10.4pp · 2024: -28.4pp
- All cycles
- 2024: R+28.4 2020: R+19.2 2016: R+20.4 2012: R+16.6 2008: R+10.4
Not yet ingested
- Civics
- —
Market trends
- HPI YoY
- ▼ -172.26%
- Current HPI
- 256.773
- Rent YoY
- ▼ -1.94%
- Metro
- Cape Coral-Fort Myers, FL
- State GDP YoY
- ▲ 3.28%
- F500 in state
- 36
Industry mix (Fortune 500 HQ in FL)
| Industry | F500 HQs | Revenue |
|---|---|---|
| Industrial Technology | 2 | $29B |
|
||
| Insurance | 2 | $17B |
|
||
| Retail | 1 | $60B |
|
||
| Technology Distribution | 1 | $58B |
|
||
| Homebuilding | 1 | $35B |
|
||
| Technology Manufacturing | 1 | $35B |
|
||
Price history
+186.3% since first listed12 events — show timeline
- 2026-04-08 Price Changed $104,500 FORTMLS
- 2026-03-25 Price Changed $75,000 FORTMLS
- 2025-12-10 Listed $104,990 FORTMLS
- 2025-11-24 Listing Removed — FORTMLS
- 2025-03-17 Price Changed $115,000 FORTMLS
- 2024-11-19 Listed $129,000 FORTMLS
- 2020-10-21 Sold (Public Records) $95,000 Public Records
- 2019-12-04 Sold (Public Records) $59,900 Public Records
- 2003-04-18 Sold (Public Records) $68,000 Public Records
- 2000-11-03 Sold (Public Records) $39,900 Public Records
- 1998-08-13 Sold (Public Records) $36,000 Public Records
- 1995-10-12 Sold (Public Records) $36,500 Public Records
Property tax history
+4.9%/yrLatest (2025): $1,008 · +4.0% YoY. Source: county tax records.
Cash-flow waterfall
monthlySold comps — $/sqft
last 12 mo · ≤1 miLoading sold comps…