101 Pleasant Harbor Marina Unit C-21 · Brinnon, WA
Flood risk 1/10 · Minimal
- FEMA flood zone
- X (unshaded)
- Chance of flooding over 30 yrs
- 0.0%
- Est. flood insurance / yr
- $507 – $1,088
Fire risk 2/10 · Minimal
- Est. fire insurance / yr
- $604 – $1,122
Heat risk 3/10 · Minor
- Hot days now (above 88°F)
- 7 days/yr
- Hot days in 30 yrs
- 14 days/yr
Wind risk 1/10 · Minimal
- Chance of severe wind over 30 yrs
- —
Air-quality risk 6/10 · Moderate
- Unhealthy air days now
- 8 days/yr
- Unhealthy air days in 30 yrs
- 8 days/yr
Risk factors via First Street. Map © Google.
Why this score? — see what drove the B+ grade
The composite is a weighted blend of 9 inputs, each scored 0–100. Each bar is that input's sub-score; the figure is the points it added to the 100-point composite (weight × sub-score).
- Cash flow +30.0/30.0
- 1% rule +10.0/10.0
- DSCR +10.0/10.0
- ARV discount +7.5/15.0
- Appreciation +6.2/10.0
- Schools +4.0/10.0
- Livability +3.0/5.0
- Rent growth +2.5/5.0
- Condition / age +2.5/5.0
$35,000
🖨 Deal sheet 📄 Offer letter ✓ Due diligence
Listing remarks
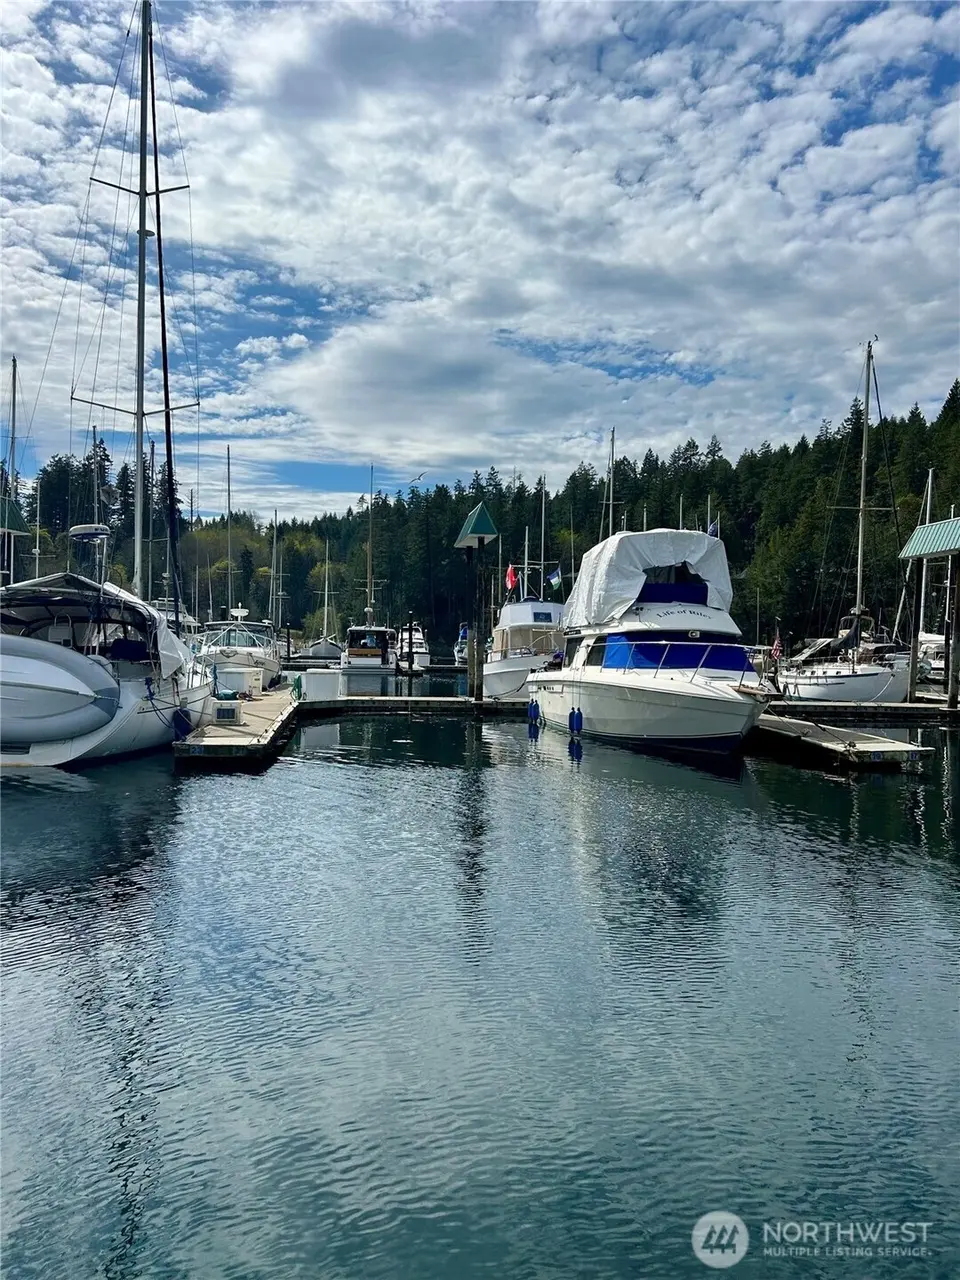
Prepare to enjoy life on the water at Pleasant Harbor Marina in Brinnon. One of the most scenic spots on the Hood Canal, the marina provides direct access to boating, sailing, fishing, and more. Nearby is the heart of the Olympic Mountains eastside, with Dosewallips State Park, Hama Hama Oysters, and Lake Cushman all within a short drive. This slip is 40 feet in length and accommodates vessels up to 28 feet. The lease runs through 2038 for this spot. The marina includes access to the pool, laundry and parking. Live aboard is possible for owners of this slip with Marina management's approval. Come take a look at idyllic Pleasant Harbor in Brinnon!
Key facts
- Access to parking
- Access to the pool
- Access to laundry
Tags
Neighborhood map
What this means for you Summary
Snapshot
- This is a 1-bed/1.0-bath moorage listed at $35k.
Deal economics
- At list price, monthly cash flow is $390 ($5k/yr) — positive.
- The deal already cash-flows at list — no discount required.
- Meets the 1% rule at list price ($799 rent vs $35k).
- Recommended offer: $33k (6.0% below list) — sets the bar for market timing.
- Cap rate 19.7% vs local median 0.9% in Brinnon — top-decile yield for the area; either an underpriced asset or a hidden risk that comps aren't pricing in. Stress-test before assuming the spread holds.
Location & tenants
- Location reads 59/100 on livability (#488 in WA) — a working-class tenant base; expect higher turnover. Strengths: employment B; Watch: crime C-, cost of living C-, health & safety C-.
- Brinnon School District (rural): math 30% / reading 60% proficiency, ranked #192 of 291 in WA (top 66%) — families likely to look elsewhere, expect single-tenant / working-renter base with shorter leases; 66% free/reduced lunch — lower-income household profile, screen leases tightly.
- Market conditions: 82 active listings in the ZIP; 147 units permitted in Jefferson County in 2024 (0 in 5+ unit buildings).
Forward outlook
- In year one you build about $1k of equity ($242 loan paydown + $822 appreciation (2.4% local appreciation)).
- Jefferson County population projected to shrink 5% by 2050 — rents likely to lag national; underwrite the cash flow, not the appreciation.
- At projected returns (2.4% appreciation + 3.0% rent growth), your $10k cash investment doubles in ~2 years — after that, you're playing with house money.
Negotiation context
- It's been on market 62 days — a 6% lower offer ($33k) is reasonable based on typical stale-listing flexibility.
Questions for the listing agent
- It's been on market 62 days. Have you received any prior offers? Is the seller open to a 6% concession, seller financing, or rate buy-down credit?
- Why hasn't it sold? Are there any deal-killer items the seller is aware of (foundation, flood, title, zoning, code violations)?
- Is there a deadline driving the sale (1031 exchange, divorce, estate, relocation)? That informs how much negotiation room exists.
- Schools are D-rated, which usually means shorter tenancies and higher turnover. Who's the typical renter profile here, and what's been the actual vacancy rate?
- What's the average days-on-market for RENTAL listings here right now (not sales)? A rising rental-DOM trend means longer vacancies and softer asking-rent achievability than the comps imply.
- What's the recent tenant-quality profile in this submarket — average credit score on applications, eviction rate, late-payment / NSF rate, and stable-employment percentage? A property-management company in the area should have these aggregated.
- How much new for-sale + rental construction is in the pipeline within 1–3 miles? Heavy new supply typically softens prices + rents 12–24 months out; constrained supply supports both.
Investment metrics
- 1% rule
- 2.28% ✓
- Cap rate
- 19.65%
- Cash-on-cash
- 47.71%
- DSCR
- 3.12
- GRM
- 3.6
CMA / ARV
No comps found within radius.
Projected returns pro-forma
2.35% appreciation · 3.0% rent growth · sell at horizon
- IRR
- 52.1%
- Equity multiple
- 3.84×
- Total profit
- $27,852
- Equity at exit
- $14,469
- IRR
- 52.4%
- Equity multiple
- 7.73×
- Total profit
- $65,918
- Equity at exit
- $21,358
Cash invested: $9,800 (down + closing). Projections, not guarantees.
Landlord ↔ Tenant lean methodology
- Overall (STATE)
- 28 Tenant-Leaning
- State Washington
- 28 Tenant-Leaning · D+8
- County
- — inherits STATE
- City
- — inherits STATE
ZIP-level market 98320
- Home prices YoY
- 1.1%
- Active inventory
- 82
- Price-to-rent
- 3.6×
Monthly cashflow live
- Estimated rent
- $799 medium interval (Pro) →
- Mortgage (P&I)
- −$184
- Tax est. 1.5%
- −$44 /mo · $525/yr
- Insurance
- −$15
- HOA
- −$0
- Vacancy / Maint / Mgmt
- −$168
- Net cashflow
- $390
Break-even live
UW: 25.0% down · 7.5% · 30yr · 1.5% tax · 5.0% vac · 8.0% maint · 8.0% mgmt
Financing live
Cash to close
- Down payment
- $8,750
- Closing costs
- $1,050
- Reserves months
- —
- Total cash needed
- —
Loan-product check · same deal, 3 products live
Conventional
25% down · 7.5% · 30yr
- Down + closing
- —
- Monthly P&I
- —
- Monthly cashflow
- —
- DSCR
- —
- Eligible?
- —
Personal DTI + credit; lowest rate.
DSCR
20% down · 8.5% · 30yr
- Down + closing
- —
- Monthly P&I
- —
- Monthly cashflow
- —
- DSCR
- —
- Eligible?
- —
No personal income docs; deal must DSCR.
Hard money
10% down · 12.0% · 12mo
- Down + closing
- —
- Monthly P&I
- —
- Monthly cashflow
- —
- DSCR
- —
- Eligible?
- —
Short-term bridge; refi at stabilization.
Listing history 16 events
-
2026-06-18days on market $35,000 Active 62 DOM
-
2026-06-17days on market $35,000 Active 61 DOM
-
2026-06-16days on market $35,000 Active 60 DOM
-
2026-06-15days on market $35,000 Active 59 DOM
-
2026-06-15days on market $35,000 Active 58 DOM
-
2026-06-13days on market $35,000 Active 57 DOM
-
2026-06-12days on market $35,000 Active 56 DOM
-
2026-06-09days on market $35,000 Active 53 DOM
-
2026-06-08days on market $35,000 Active 52 DOM
-
2026-06-08days on market $35,000 Active 51 DOM
-
2026-06-05days on market $35,000 Active 49 DOM
-
2026-06-03pricedays on market $35,000 Active 47 DOM
-
2026-06-02days on market $40,000 Active 46 DOM
-
2026-06-01days on market $40,000 Active 45 DOM
-
2026-05-31days on market $40,000 Active 44 DOM
-
2026-04-17$40,000 Active
ⓘ Source: listings_history table (triggers on properties + properties_extension) + one-shot
backfill from property_details.listing_events for pre-trigger history.
Climate risk First Street
- Flood 1/10 Low FEMA zone X (unshaded) · 0% chance over 30 yrs
- Wildfire 2/10 Low
- Heat 3/10 Moderate 7 d/yr ≥88°F today · 14 d/yr by 30 yrs out
- Wind 1/10 Low
- Air quality 6/10 Major 8 unhealthy d/yr today · 8 by 30 yrs out
Nearby sold comps map
Loading sold comps map…
Walkable amenities ~0.75 mi
Loading nearby amenities…
Taxation est. · year 1
- Rental income
- $9,593
- − Mortgage interest
- −$1,961
- − Property taxes
- −$525
- − Insurance
- −$175
- − Repairs & maintenance
- −$767
- − Management
- −$767
- − Depreciation
- −$1,018
- Taxable income
- $4,379
- Est. tax owed @ 24.0%
- −$1,051
- After-tax cash flow
- $3,625/yr
For passive investors: Depreciation is non-cash, so a rental often shows a tax loss while cash-flowing — sheltering income. Rental losses are passive: they offset passive income freely, and up to $25,000/yr can offset ordinary (W-2) income if you actively participate and your MAGI is under $100k (phasing out to $0 by $150k); unused losses carry forward. On sale, claimed depreciation is recaptured at up to 25%, and gains may owe capital-gains tax (a 1031 exchange can defer both). Figures are a year-1 estimate at your 24.0% rate — not tax advice; consult a CPA.
Schools (NCES district)
- District
- Brinnon School District
- NCES district ID
- 5300750
- Math proficiency
- 30% ▼ -10.00%
- Reading proficiency
- 60% ▬ 0.00%
- Median HH income
- $39,455
- Composite
- 39.79/100
- National rank
- #7979
- State rank
- #192 of 291 in WA
Livability — Brinnon
- Score
- 59/100
- State rank
- #488
- US rank
- #20372
Category grades
Schools grade is shown separately in the Schools card above.
Census & demographics
- Census place
- Brinnon, WA
- Population (ZIP)
- 1,313
Population outlook (Jefferson County) Hauer SSP2
- Today (2025)
- 31,415 people
- By 2030
- 31,568 · +0.5%
- By 2040
- 30,911 · -1.6%
- By 2050
- 29,927 · -4.7%
- By 2075
- 28,489 · -9.3%
- By 2100
- 26,483 · -15.7%
Race, ethnicity, and origin ACS 2023
- Neighborhood character
- Predominantly White (84%)
- Race & ethnicity
- White 84% Two or more races 12% Native American 3% Hispanic / Latino 2%
- Common ancestry
- Italian 7% Iranian 7% Portuguese 7%
- Foreign-born
- 3%
- Languages at home
- 97% English-only · Other Indo-European 1% Other Asian/Pacific 1% French/Haitian/Cajun 1%
Political lean MEDSL · Jefferson
- 2024 margin
- Solid D (+45.3) · D 71.0% · R 25.7% · Other 3.2%
- 2008→2024 swing
- +10.7pp toward D · 2008: 34.6pp · 2024: 45.3pp
- All cycles
- 2024: D+45.3 2020: D+41.4 2016: D+32.7 2012: D+31.4 2008: D+34.6
Not yet ingested
- Civics
- —
Market trends
- HPI YoY
- ▲ 2.35%
- Current HPI
- 211.0153
- Rent YoY
- —
- Metro
- —
- State GDP YoY
- ▲ 4.65%
- F500 in state
- 22
Industry mix (Fortune 500 HQ in WA)
| Industry | F500 HQs | Revenue |
|---|---|---|
| Retail | 2 | $269B |
|
||
| Technology / Retail | 1 | $638B |
|
||
| Technology | 1 | $245B |
|
||
| Telecommunications | 1 | $38B |
|
||
| Food / Beverage | 1 | $36B |
|
||
| Automotive / Trucks | 1 | $34B |
|
||
Price history
1 event — show timeline
- 2026-04-17 Listed $40,000 NWMLS as Distributed by MLS Grid
Cash-flow waterfall
monthlySold comps — $/sqft
last 12 mo · ≤1 miLoading sold comps…