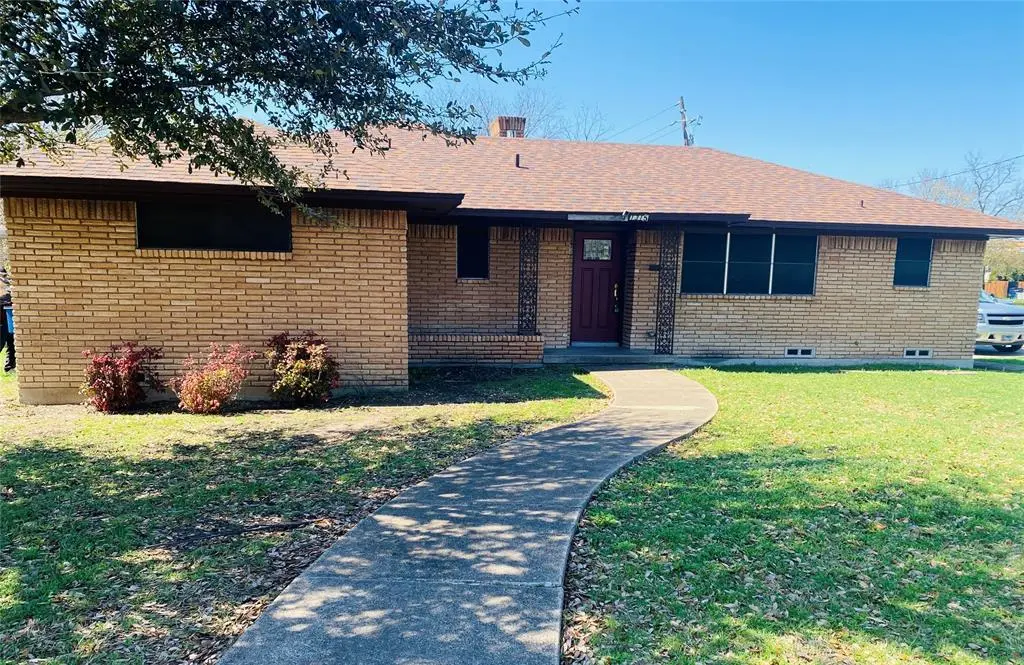
1315 Willow Creek Dr · Lancaster, TX
Flood risk 1/10 · Minimal
- FEMA flood zone
- X (unshaded)
- Chance of flooding over 30 yrs
- 0.0%
- Est. flood insurance / yr
- $507 – $1,088
Fire risk 3/10 · Minor
- Est. fire insurance / yr
- $1,222 – $2,270
Heat risk 7/10 · Major
- Hot days now (above 110°F)
- 7 days/yr
- Hot days in 30 yrs
- 24 days/yr
Wind risk 6/10 · Moderate
- Chance of severe wind over 30 yrs
- 27.0%
Air-quality risk 2/10 · Minimal
- Unhealthy air days now
- 2 days/yr
- Unhealthy air days in 30 yrs
- 2 days/yr
Risk factors via First Street. Map © Google.
Why this score? — see what drove the D grade
The composite is a weighted blend of 9 inputs, each scored 0–100. Each bar is that input's sub-score; the figure is the points it added to the 100-point composite (weight × sub-score).
- Cash flow +11.1/30.0
- Appreciation +6.8/10.0
- ARV discount +6.3/15.0
- 1% rule +4.0/10.0
- DSCR +3.2/10.0
- Rent growth +3.2/5.0
- Livability +3.1/5.0
- Condition / age +2.5/5.0
- Schools +2.1/10.0
$247,000
🖨 Deal sheet (PDF) 📄 Offer letter ✓ Due diligence
Listing remarks
Welcome to a home where space, style, and thoughtful updates come together on an oversized corner lot in the heart of Lancaster. Meticulously maintained and exceptionally clean, this inviting ranch-style residence offers the perfect blend of comfort and functionality with upgrades that today's buyers will appreciate. Step inside to discover fresh finishes throughout, including updated textured ceilings and walls, crown molding, recessed lighting, modern electrical outlets, and stylish flooring that seamlessly combines wood, tile, and waterproof luxury vinyl. The spacious family room serves as the heart of the home with a cozy wood-burning fireplace and built-in shelving, creating the perfec
Key facts
- Oversized corner lot
- Built in shelving
- Flex space
Tags
Property features AI
Finance
- Other: Property is not in a municipal utility district
- HOA & community: No HOA / association
Exterior
- Parking: Attached 2-car garage; Covered parking for 2 vehicles; 1 carport space; Additional parking available
- Utilities: Electricity available; City water; City sewer
- Home design: Single-family residence; One story; Residential property
- Construction: Brick construction; Composition roof; Pillar/post/pier foundation; Year built 1970
- Exterior features: Curbs and sidewalk; City water; City sewer; Individual gas meter; Individual water meter
Interior
- Kitchen: Dishwasher; Electric cooktop; Electric oven; Gas water heater
- Bedrooms: 3 bedrooms (primary bedroom on level 1, 16 x 11); Additional bedroom on level 1, 10 x 10
- Flooring: Ceramic tile; Hardwood; Laminate
- Bathrooms: 2 full bathrooms
- Heating & cooling: Central heating; Fireplace heating; Central air conditioning; Ceiling fans
- Interior features: Open floorplan; Decorative lighting; Two living areas; One dining area; Total of 5 rooms; One fireplace (brick)
- Laundry & utility: Laundry located in garage
Neighborhood map
What this means for you Summary
Snapshot
- This is a 3-bed/2.0-bath single-family listed at $247k.
Deal economics
- At list price, monthly cash flow is $-100 ($-1k/yr) — negative.
- To cash-flow at today's rent, offer at most $229k (7.1% below list).
- To meet the 1% rule (rent ≥ 1% of price), the offer needs to be $224k (9.5% below list).
- Recommended offer: $224k (9.5% below list) — sets the bar for 1% rule.
- Cap rate 5.8% vs local median 4.8% in Lancaster — meaningfully above typical; check what's discounted (condition, days-on-market, listing class) to confirm the premium yield is real.
Location & tenants
- Location reads 62/100 on livability (#926 in TX) — a middle-class / working-renter tenant base. Strengths: cost of living A+, housing A+; Watch: employment C-, crime F, amenities F.
- Lancaster ISD (suburban): math 19% / reading 29% proficiency, ranked #714 of 826 in TX (top 86%) — low school quality limits family demand, transient renter base, plan for 1-2y turnover; 78% free/reduced lunch — lower-income household profile, screen leases tightly.
- Zoned schools: Pleasant Run El (math 22% / reading 22%, grade F, #3,333 of 4,322 statewide, top 80%, 622 students, 99% FRL); Lancaster Middle (math 20% / reading 32%, grade F, #1,222 of 1,662 statewide, top 74%, 1,007 students, 84% FRL); Lancaster H S (math 14% / reading 34%, grade F, #1,333 of 1,632 statewide, top 82%, 2,250 students, 84% FRL).
- Market conditions: Rents rising (+3.0%/yr); 105 active listings in the ZIP; 40 comparable units currently listed for rent nearby; rentals at typical pace (median 15d on market — plan ~3-4 weeks tenant-placement turnaround); 12,577 units permitted in Dallas County in 2024 (6,829 in 5+ unit buildings).
- This rent runs 39% of the median local income ($68k/yr) — at the standard rent-burdened threshold; future hikes will face affordability resistance.
Forward outlook
- In year one you build about $11k of equity ($2k loan paydown + $9k appreciation (3.6% local appreciation)).
- Dallas County population projected at +35% by 2050 — long-run rental-demand tailwind backs the buy-and-hold thesis.
- By year 4, paydown + projected appreciation supports a ~$36k cash-out refi (75% LTV) — recoverable capital for the next deal without selling this one.
Negotiation context
- Only 10 days on market — expect competitive offers; lowballing is unlikely to land.
- 2 sale attempts with the ask held roughly flat each time — persistent listings suggest the price (not the market) is what's stuck; bring a comps-based counter.
Risks & watch-outs
- Climate carrying-cost: major wind risk, 27% chance of damaging wind over 30y; extreme-heat days projected 7→24/yr by 2055 (HVAC capex compounding) — expect insurance premiums to compound above CPI over the hold.
Questions for the listing agent
- What do current leases actually rent for vs. the listed asking? Can we see a recent rent roll and the last 12 months of T-12 income?
- Built in 1970 — when were the roof, HVAC, electrical panel, plumbing, and water heater last replaced?
- Is there a deadline driving the sale (1031 exchange, divorce, estate, relocation)? That informs how much negotiation room exists.
- Schools are D-rated, which usually means shorter tenancies and higher turnover. Who's the typical renter profile here, and what's been the actual vacancy rate?
- Crime grade is F in this area — have there been break-ins, vandalism, or insurance claims at this property in the last 3 years? What carrier currently insures it and at what premium?
- The area grade is low — what's the realistic commute time and amenity access for the typical tenant pool here? Any planned neighborhood developments (good or bad) we should know about?
- What's the average days-on-market for RENTAL listings here right now (not sales)? A rising rental-DOM trend means longer vacancies and softer asking-rent achievability than the comps imply.
- What's the recent tenant-quality profile in this submarket — average credit score on applications, eviction rate, late-payment / NSF rate, and stable-employment percentage? A property-management company in the area should have these aggregated.
- How much new for-sale + rental construction is in the pipeline within 1–3 miles? Heavy new supply typically softens prices + rents 12–24 months out; constrained supply supports both.
Investment metrics
- 1% rule
- 0.90% ✗
- Cap rate
- 5.81%
- Cash-on-cash
- -1.73%
- DSCR
- 0.92
- GRM
- 9.2
CMA / ARV
- ARV (median comp)
- $240,675
- List price
- $247,000
- Delta
- 2.63%
- Verdict
- FAIR
- Comps
- 20 within 1.0 mi
Show comp detail 12 sales within ~0.75 mi
| Address | Dist | Beds/Ba | Sqft | Sold | Price | $/sf | Match |
|---|---|---|---|---|---|---|---|
| 876 Dogwood Trl | 0.25mi | 3/2.0 | 1,578 (-2%) | 2mo | $264,900 | $168 | 83 |
| 1129 Harvest Hill Ln | 0.37mi | 3/2.0 | 1,598 (-1%) | 1mo | $275,000 | $172 | 80 |
| 1106 Rosewood Ln | 0.36mi | 3/2.0 | 1,537 (-5%) | 5mo | $239,900 | $156 | 71 |
| 871 Magnolia Ln | 0.20mi | 3/2.0 | 1,447 (-11%) | 5mo | $235,000 | $162 | 69 |
| 702 Rea Ave | 0.52mi | 3/2.0 | 1,533 (-5%) | 5mo | $175,000 | $114 | 62 |
| 1313 Oakbluff Dr | 0.69mi | 3/2.0 | 1,530 (-5%) | 4mo | $249,900 | $163 | 55 |
| 1542 Sunny Meadow Rd | 0.65mi | 3/2.0 | 1,453 (-10%) | 4mo | $244,900 | $169 | 49 |
| 533 Arbor Ln | 0.68mi | 3/2.0 | 1,808 (+12%) | 1mo | $219,950 | $122 | 48 |
| 814 Oakbluff Dr | 0.57mi | 3/2.0 | 1,839 (+14%) | 4mo | $208,250 | $113 | 48 |
| 1310 Rosewood Ln | 0.61mi | 3/2.0 | 1,402 (-13%) | 4mo | $279,900 | $200 | 46 |
| 609 W 8th St | 0.70mi | 3/2.0 | 1,388 (-14%) | 2mo | $175,000 | $126 | 42 |
| 2315 Rogers Ave | 0.71mi | 4/2.0 (+1) | 1,823 (+13%) | 2mo | $305,000 | $167 | 39 |
Match score weights: distance 35% · size 25% · config 20% · recency 20%. Top-matched comps best support the ARV.
Projected returns pro-forma
3.57% appreciation · 2.96% rent growth · sell at horizon
- IRR
- 7.6%
- Equity multiple
- 1.45×
- Total profit
- $31,050
- Equity at exit
- $119,141
- IRR
- 10.0%
- Equity multiple
- 2.60×
- Total profit
- $110,333
- Equity at exit
- $190,156
Cash invested: $69,160 (down + closing). Projections, not guarantees.
Landlord ↔ Tenant lean methodology
- Overall (STATE)
- 87 Strongly Landlord-Friendly
- State Texas
- 87 Strongly Landlord-Friendly · R+5
- County
- — inherits STATE
- City
- — inherits STATE
ZIP-level market 75146
- Home prices YoY
- 1.1%
- Rents YoY
- 3.0%
- Active inventory
- 105
- Price-to-rent
- 9.2×
Monthly cashflow live
- Estimated rent
- $2,235 high interval (Pro) →
- Mortgage (P&I)
- −$1,295
- Tax from tax record
- −$467 /mo · $5,606/yr
- Insurance
- −$103
- HOA
- −$0
- Vacancy / Maint / Mgmt
- −$469
- Net cashflow
- $-100
Break-even live
Sensitivity live
| Price | -10% $40 | -5% $-30 | +0% $-100 | +5% $-169 | +10% $-239 |
|---|---|---|---|---|---|
| Rent | -10% $-276 | -5% $-188 | +0% $-100 | +5% $-11 | +10% $77 |
| Rate | -1.0pp $25 | -0.5pp $-37 | base $-100 | +0.5pp $-164 | +1.0pp $-229 |
UW: 25.0% down · 7.5% · 30yr · 1.5% tax · 5.0% vac · 8.0% maint · 8.0% mgmt
Financing live
Cash to close
- Down payment
- $61,750
- Closing costs
- $7,410
- Reserves months
- —
- Total cash needed
- —
Loan-product check · same deal, 3 products live
Conventional
25% down · 7.5% · 30yr
- Down + closing
- —
- Monthly P&I
- —
- Monthly cashflow
- —
- DSCR
- —
- Eligible?
- —
Personal DTI + credit; lowest rate.
DSCR
20% down · 8.5% · 30yr
- Down + closing
- —
- Monthly P&I
- —
- Monthly cashflow
- —
- DSCR
- —
- Eligible?
- —
No personal income docs; deal must DSCR.
Hard money
10% down · 12.0% · 12mo
- Down + closing
- —
- Monthly P&I
- —
- Monthly cashflow
- —
- DSCR
- —
- Eligible?
- —
Short-term bridge; refi at stabilization.
Rent comps 40 comps
| Address | Beds | Baths | Sqft | Rent | $/sqft | DOM | Units | Dist |
|---|---|---|---|---|---|---|---|---|
| 1109 Harvest Hill Ln Lancaster, TX | 3.0 | 2.5 | 2006 | $2,350 | $1.17 | 9d | 1 | 0.31mi |
| 1326 Johns Ave Lancaster, TX | 4.0 | 2.0 | 1236 | $2,100 | $1.70 | 45d | 1 | 0.41mi |
| 1217 Meadow Creek Dr Lancaster, TX | 3.0 | 2.0 | 2088 | $1,971 | $0.94 | 14d | 1 | 0.44mi |
| 1217 Meadow Creek Dr Lancaster, TX | 3.0 | 2.0 | 2088 | $1,905 | $0.91 | 9d | 1 | 0.44mi |
| 1125 Greenbriar Ln Lancaster, TX | 3.0 | 2.0 | 1744 | $1,825 | $1.05 | 9d | 1 | 0.44mi |
| 1533 Prescott Dr Lancaster, TX | 3.0 | 2.0 | 1500 | $1,975 | $1.32 | 6d | 1 | 0.52mi |
| 1532 Linda Ln Lancaster, TX | 3.0 | 2.0 | 1380 | $2,000 | $1.45 | 26d | 1 | 0.57mi |
| 721 Lindenwood Dr Lancaster, TX | 3.0 | 2.0 | 1606 | $1,895 | $1.18 | 9d | 1 | 0.57mi |
| 721 Lindenwood Dr Lancaster, TX | 3.0 | 2.0 | 1606 | $1,895 | $1.18 | 17d | 1 | 0.57mi |
| 1225 Oakbluff Dr Lancaster, TX | 3.0 | 2.0 | 1335 | $1,895 | $1.42 | 5d | 1 | 0.62mi |
| 1218 Jewell Ln Lancaster, TX | 4.0 | 2.0 | 1854 | $2,071 | $1.12 | 9d | 1 | 0.62mi |
| 610 Canvas Ct Lancaster, TX | 4.0 | 2.0 | 1859 | $2,276 | $1.22 | 9d | 1 | 0.68mi |
| 610 Canvas Ct Lancaster, TX | 4.0 | 2.0 | 1859 | $2,210 | $1.19 | 3d | 1 | 0.68mi |
| 830 Bordner Dr Lancaster, TX | 3.0 | 2.0 | 1821 | $2,300 | $1.26 | 14d | 1 | 0.71mi |
| 422 Ash Ln Lancaster, TX | 3.0 | 2.0 | 1651 | $1,995 | $1.21 | 26d | 1 | 0.71mi |
| 509 Arbor Ln Lancaster, TX | 3.0 | 2.0 | 1494 | $1,875 | $1.26 | 45d | 1 | 0.73mi |
| 1305 Cypress Ln Lancaster, TX | 4.0 | 2.0 | 1877 | $2,200 | $1.17 | 0d | 1 | 0.79mi |
| 1373 Oakbluff Dr Lancaster, TX | 3.0 | 2.0 | 1289 | $1,850 | $1.44 | 4d | 1 | 0.83mi |
| 1811 Kings Cross Dr Lancaster, TX | 4.0 | 2.0 | 1812 | $2,200 | $1.21 | 26d | 1 | 0.86mi |
| 633 Rutgers Dr Lancaster, TX | 4.0 | 2.0 | 2065 | $1,995 | $0.97 | 12d | 1 | 0.87mi |
| 633 Rutgers Dr Lancaster, TX | 4.0 | 2.0 | 2065 | $1,995 | $0.97 | 6d | 1 | 0.87mi |
| 2617 Arcady Cir Lancaster, TX | 3.0 | 2.0 | 1361 | $1,950 | $1.43 | 45d | 1 | 0.87mi |
| 2617 Arcady Cir Lancaster, TX | 3.0 | 2.0 | 1361 | $1,895 | $1.39 | 0d | 1 | 0.87mi |
| 1308 Devine Dr Lancaster, TX | 4.0 | 2.0 | 1568 | $2,350 | $1.50 | 45d | 1 | 0.89mi |
| 1450 Waldrop Dr Lancaster, TX | 4.0 | 2.0 | 1946 | $2,105 | $1.08 | 22d | 1 | 0.92mi |
| 1450 Waldrop Dr Lancaster, TX | 4.0 | 2.0 | 1946 | $2,291 | $1.18 | 45d | 1 | 0.92mi |
| 2654 Hartford Ln Lancaster, TX | 4.0 | 2.0 | 1657 | $2,015 | $1.22 | 45d | 1 | 0.95mi |
| 1555 Willowbrook St Lancaster, TX | 3.0 | 2.0 | 1544 | $1,759 | $1.14 | 24d | 1 | 0.96mi |
| 1252 Payne Dr Lancaster, TX | 4.0 | 2.0 | 1577 | $2,239 | $1.42 | 4d | 1 | 0.99mi |
| 1314 Roan Dr Lancaster, TX | 4.0 | 2.5 | 1913 | $2,375 | $1.24 | 45d | 1 | 1.00mi |
| 1424 Chapman Dr Lancaster, TX | 3.0 | 2.0 | 1820 | $2,099 | $1.15 | 26d | 1 | 1.01mi |
| 900 Diann Cir Lancaster, TX | 3.0 | 2.0 | 2247 | $2,500 | $1.11 | 0d | 1 | 1.05mi |
| 834 Apple Valley Dr Lancaster, TX | 3.0 | 2.0 | 1425 | $2,275 | $1.60 | 45d | 1 | 1.08mi |
| 2746 Town North Dr Lancaster, TX | 4.0 | 2.0 | 1377 | $2,000 | $1.45 | 9d | 1 | 1.09mi |
| 120 E Park Place Dr Lancaster, TX | 4.0 | 1.0 | 1536 | $1,900 | $1.24 | 26d | 1 | 1.13mi |
| 1942 Ryder Dr Lancaster, TX | 4.0 | 2.0 | 1824 | $2,200 | $1.21 | 0d | 1 | 1.14mi |
| 230 E Colonial Dr Lancaster, TX | 3.0 | 1.0 | 1056 | $1,695 | $1.61 | 0d | 1 | 1.15mi |
| 1934 Mosley Dr Lancaster, TX | 4.0 | 2.0 | 1754 | $2,099 | $1.20 | 26d | 1 | 1.18mi |
| 823 N Dallas Ave Lancaster, TX | 2.0 | 1.0 | 1156 | $1,425 | $1.23 | 12d | 1 | 1.23mi |
| 1910 Jasmine Dr Lancaster, TX | 3.0 | 2.5 | 2183 | $2,480 | $1.14 | 26d | 1 | 1.24mi |
Listing history 14 events
-
2026-06-21days on market $247,000 Active 10 DOM
-
2026-06-18days on market $247,000 Active 7 DOM
-
2026-06-17days on market $247,000 Active 6 DOM
-
2026-06-16days on market $247,000 Active 5 DOM
-
2026-06-15days on market $247,000 Active 4 DOM
-
2026-06-13days on market $247,000 Active 2 DOM
-
2026-06-04days on market $247,000 Active 88 DOM
-
2026-06-03days on market $247,000 Active 87 DOM
-
2026-06-02days on market $247,000 Active 86 DOM
-
2026-06-01days on market $247,000 Active 85 DOM
-
2026-05-31days on market $247,000 Active 84 DOM
-
2026-03-07$247,000 Active 1125-char remark
-
1991-05-16soldstatus
-
1986-03-31soldstatus
ⓘ Source: listings_history table (triggers on properties + properties_extension) + one-shot
backfill from property_details.listing_events for pre-trigger history.
Tax reassessment forecast TX · Resets to sale price
- Current annual tax
- $5,606 · $467/mo
- Projected year-2 tax
- $5,606 · $467/mo
- Expected delta
- $0/yr ($0/mo · 0.0%)
ⓘ Screening estimate from a state-policy table — verify with the county assessor before closing.
Climate risk First Street
- Flood 1/10 Low FEMA zone X (unshaded) · 0% chance over 30 yrs
- Wildfire 3/10 Moderate
- Heat 7/10 Severe 7 d/yr ≥110°F today · 24 d/yr by 30 yrs out
- Wind 6/10 Major 27% chance of damaging wind over 30 yrs
- Air quality 2/10 Low 2 unhealthy d/yr today · 2 by 30 yrs out
Nearby sold comps map
Loading sold comps map…
Walkable amenities ~0.75 mi
Loading nearby amenities…
Taxation est. · year 1
- Rental income
- $26,823
- − Mortgage interest
- −$13,836
- − Property taxes
- −$5,606
- − Insurance
- −$1,235
- − Repairs & maintenance
- −$2,146
- − Management
- −$2,146
- − Depreciation
- −$7,185
- Taxable loss
- −$5,331
- Est. tax savings @ 24.0%
- +$1,280
- After-tax cash flow
- $85/yr
For passive investors: Depreciation is non-cash, so a rental often shows a tax loss while cash-flowing — sheltering income. Rental losses are passive: they offset passive income freely, and up to $25,000/yr can offset ordinary (W-2) income if you actively participate and your MAGI is under $100k (phasing out to $0 by $150k); unused losses carry forward. On sale, claimed depreciation is recaptured at up to 25%, and gains may owe capital-gains tax (a 1031 exchange can defer both). Figures are a year-1 estimate at your 24.0% rate — not tax advice; consult a CPA.
Schools (NCES district)
- District
- Lancaster ISD
- NCES district ID
- 4826670
- Math proficiency
- 19% ▼ -29.00%
- Reading proficiency
- 29% ▼ -11.00%
- Median HH income
- $52,275
- Composite
- 21.41/100
- National rank
- #8349
- State rank
- #714 of 826 in TX
Livability — Lancaster
- Score
- 62/100
- State rank
- #926
- US rank
- #16461
Category grades
Schools grade is shown separately in the Schools card above.
Census & demographics
- Census place
- Lancaster, TX
- County
- Dallas County · 2,612,404 people
- City population
- 44,142
- Metro
- Dallas-Fort Worth-Arlington, TX
- Population (ZIP)
- 25,097
- Household income
- $68,071
- Rent vs Own
- Severe rent burden
- 1462.0
Population outlook (Dallas County) Hauer SSP2
- Today (2025)
- 2,979,839 people
- By 2030
- 3,191,823 · +7.1%
- By 2040
- 3,619,611 · +21.5%
- By 2050
- 4,026,915 · +35.1%
- By 2075
- 4,957,073 · +66.4%
- By 2100
- 5,508,725 · +84.9%
Race, ethnicity, and origin ACS 2023
- Neighborhood character
- Diverse neighborhood (Simpson 0.57)
- Race & ethnicity
- Black 60% Hispanic / Latino 26% Two or more races 12% White 11%
- Hispanic origin (detail)
- Mexican 20% Puerto Rican 2%
- Common ancestry
- Italian 2%
- Foreign-born
- 7% · Canada
- Languages at home
- 80% English-only · Spanish 20%
Political lean MEDSL · Dallas
- 2024 margin
- Strong D (+22.2) · D 60.2% · R 38.0% · Other 1.8%
- 2008→2024 swing
- +6.9pp toward D · 2008: 15.3pp · 2024: 22.2pp
- All cycles
- 2024: D+22.2 2020: D+31.6 2016: D+26.2 2012: D+15.4 2008: D+15.3
Not yet ingested
- Civics
- —
Market trends
- HPI YoY
- ▲ 3.57%
- Current HPI
- 316.7295
- Rent YoY
- ▲ 2.96%
- Metro
- Dallas-Fort Worth-Arlington, TX
- State GDP YoY
- ▲ 3.95%
- F500 in state
- 110
Industry mix (Fortune 500 HQ in TX)
| Industry | F500 HQs | Revenue |
|---|---|---|
| Energy | 16 | $1,198B |
|
||
| Technology | 5 | $198B |
|
||
| Engineering / Construction | 4 | $72B |
|
||
| Energy Services | 3 | $60B |
|
||
| Utilities | 3 | $41B |
|
||
| Healthcare | 2 | $330B |
|
||
Price history
+0.0% since first listed5 events — show timeline
- 2026-06-09 Listed $247,000 NTREIS
- 2026-06-06 Listing Removed — NTREIS
- 2026-03-07 Listed $247,000 NTREIS
- 1991-05-16 Sold (Public Records) — Public Records
- 1986-03-31 Sold (Public Records) — Public Records
Property tax history
+4.9%/yrLatest (2025): $5,606 · -0.2% YoY. Source: county tax records.
Cash-flow waterfall
monthlySold comps — $/sqft
last 12 mo · ≤1 miLoading sold comps…