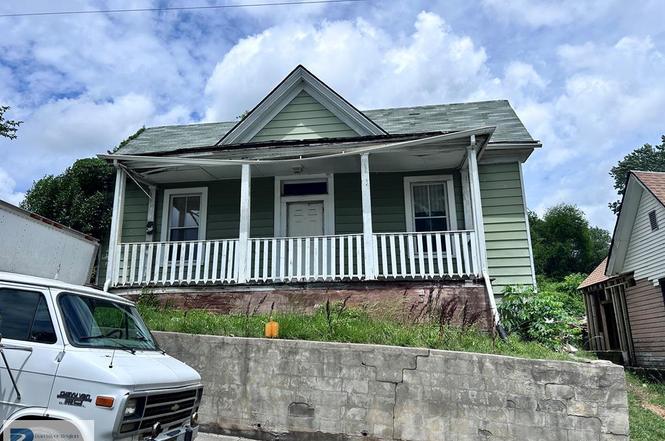
238 W Thomas St · Danville, VA
Flood risk 1/10 · Minimal
- FEMA flood zone
- X (unshaded)
- Chance of flooding over 30 yrs
- 0.0%
- Est. flood insurance / yr
- $507 – $1,088
Fire risk 1/10 · Minimal
- Est. fire insurance / yr
- $666 – $1,236
Heat risk 6/10 · Moderate
- Hot days now (above 105°F)
- 7 days/yr
- Hot days in 30 yrs
- 18 days/yr
Wind risk 4/10 · Minor
- Chance of severe wind over 30 yrs
- 8.0%
Air-quality risk 2/10 · Minimal
- Unhealthy air days now
- 0 days/yr
- Unhealthy air days in 30 yrs
- 1 days/yr
Risk factors via First Street. Map © Google.
Why this score? — see what drove the D grade
The composite is a weighted blend of 9 inputs, each scored 0–100. Each bar is that input's sub-score; the figure is the points it added to the 100-point composite (weight × sub-score).
- Cash flow +15.0/30.0
- ARV discount +7.5/15.0
- 1% rule +5.0/10.0
- DSCR +5.0/10.0
- Livability +3.9/5.0
- Schools +3.0/10.0
- Rent growth +2.5/5.0
- Condition / age +2.5/5.0
- Appreciation +0.0/10.0
$19,900
🖨 Deal sheet (PDF) 📄 Offer letter ✓ Due diligence
Listing remarks
Attention investors and DIY enthusiasts! Multiple exit strategies: finish this remodel then either flip, rent or move in! Home being sold as is. Cash preferred but will consider financed all offers. Seller is assisted by an Attorney in Fact. Do not knock on door or approach house without prior communication.
Key facts
- 4,356 sq ft lot
- Built 1900
- Listed 7 days
Property features AI
Exterior
- Parking: No garage
- Utilities: Public water; Public sewer
- Home design: Residential property; Urban residential zoning
- Construction: Above-grade finished area: 1,230
- Exterior features: Front porch; Composition roof
Interior
- Kitchen: Oven
- Bedrooms: 2 bedrooms on the main level
- Bathrooms: 1 full bathroom on the main level
- Heating & cooling: Natural gas heating
- Interior features: Oven; Fireplace in the living room (2 total fireplaces)
Neighborhood map
What this means for you Summary
Snapshot
- This is a 2-bed/1.0-bath single-family listed at $20k.
Deal economics
- At list price, monthly cash flow is $833 ($10k/yr) — positive.
- The deal already cash-flows at list — no discount required.
- Meets the 1% rule at list price ($1k rent vs $20k).
- Cap rate 56.5% vs local median 5.2% in Danville — top-decile yield for the area; either an underpriced asset or a hidden risk that comps aren't pricing in. Stress-test before assuming the spread holds.
Location & tenants
- Location reads 77/100 on livability (#91 in VA, #2,952 nationally) — a middle-class / working-renter tenant base. Strengths: cost of living A+, housing A+, health & safety A+; Watch: amenities D+, crime D-, commute F.
- Danville City Public School District (town): math 30% / reading 44% proficiency, ranked #128 of 131 in VA (top 98%) — families likely to look elsewhere, expect single-tenant / working-renter base with shorter leases; 71% free/reduced lunch — lower-income household profile, screen leases tightly.
- Zoned schools: Woodberry Hills Elementary (math 5% / reading 34%, grade F, #1,082 of 1,108 statewide, top 98%, 394 students, 98% FRL); O. Trent Bonner Middle (math 33% / reading 53%, grade D-, #288 of 342 statewide, top 85%, 678 students, 91% FRL); George Washington High (math 44% / reading 54%, grade D, #300 of 319 statewide, top 94%, 1,309 students, 88% FRL) — zoned schools average 92% FRL vs 71% district-wide (21 pts higher); higher-poverty schools than district average — tighter screening recommended.
- Market conditions: 211 active listings in the ZIP; 15 comparable units currently listed for rent nearby; rentals lingering (median 47d on market — plan ~5-8 weeks vacancy on turnover, expect pricing pressure); 87% of comp listings sitting > 30 days — soft ceiling on asking rent; 54 units permitted in Danville city in 2024 (40 in 5+ unit buildings).
- This rent runs 30% of the median local income ($48k/yr) — at the standard rent-burdened threshold; future hikes will face affordability resistance.
Forward outlook
- Local home prices are declining (-3.0%/yr); year-one equity from $138 of loan paydown is wiped out by about $597 of value loss. Plan a longer hold.
- Danville County population projected to shrink 7% by 2050 — rents likely to lag national; underwrite the cash flow, not the appreciation.
- At projected returns (-3.0% appreciation + 3.0% rent growth), your $6k cash investment doubles in ~1 year — after that, you're playing with house money.
Negotiation context
- Only 7 days on market — expect competitive offers; lowballing is unlikely to land.
- Current owner paid $10k; list at $20k implies a 99% gain — meaningful room to come down on a strong offer.
Risks & watch-outs
- Watch-outs: built in 1900 — expect roof / HVAC / electrical / plumbing capex.
- Climate carrying-cost: extreme-heat days projected 7→18/yr by 2055 (HVAC capex compounding) — expect insurance premiums to compound above CPI over the hold.
Questions for the listing agent
- Built in 1900 — when were the roof, HVAC, electrical panel, plumbing, and water heater last replaced?
- Is there a deadline driving the sale (1031 exchange, divorce, estate, relocation)? That informs how much negotiation room exists.
- Schools are B-rated — typically a magnet for longer-tenancy family renters. What's the average tenant stay here, and is there a school-zone premium baked into asking?
- Crime grade is D in this area — have there been break-ins, vandalism, or insurance claims at this property in the last 3 years? What carrier currently insures it and at what premium?
- The area grade is low — what's the realistic commute time and amenity access for the typical tenant pool here? Any planned neighborhood developments (good or bad) we should know about?
- What's the average days-on-market for RENTAL listings here right now (not sales)? A rising rental-DOM trend means longer vacancies and softer asking-rent achievability than the comps imply.
- What's the recent tenant-quality profile in this submarket — average credit score on applications, eviction rate, late-payment / NSF rate, and stable-employment percentage? A property-management company in the area should have these aggregated.
- How much new for-sale + rental construction is in the pipeline within 1–3 miles? Heavy new supply typically softens prices + rents 12–24 months out; constrained supply supports both.
Investment metrics
- 1% rule
- 6.06% ✓
- Cap rate
- 56.50%
- Cash-on-cash
- 179.30%
- DSCR
- 8.98
- GRM
- 1.4
CMA / ARV
- ARV (on-the-fly)
- $89,790
- Comps found
- 12
Show comp detail 12 sales within ~0.75 mi
| Address | Dist | Beds/Ba | Sqft | Sold | Price | $/sf | Match |
|---|---|---|---|---|---|---|---|
| 131 Moffett St | 0.40mi | 3/1.0 (+1) | 1,200 (-2%) | 6mo | $115,000 | $96 | 68 |
| 214 Baugh St | 0.08mi | 3/1.0 (+1) | 1,367 (+11%) | 9mo | $27,500 | $20 | 65 |
| 415/417 First St | 0.22mi | 2/2.0 | 1,375 (+12%) | 4mo | $100,000 | $73 | 62 |
| 520 N Main St | 0.32mi | 2/1.0 | 1,378 (+12%) | 6mo | $30,000 | $22 | 60 |
| 715 Wyllie Ave | 0.29mi | 3/1.0 (+1) | 1,118 (-9%) | 8mo | $52,000 | $47 | 60 |
| 305 Campbell St | 0.45mi | 3/1.0 (+1) | 1,136 (-8%) | 8mo | $148,900 | $131 | 54 |
| 315 E Thomas St | 0.42mi | 2/1.0 | 1,064 (-14%) | 11mo | $30,000 | $28 | 49 |
| 1436 Claiborne St | 0.53mi | 3/1.0 (+1) | 1,114 (-9%) | 8mo | $84,500 | $76 | 48 |
| 1467 Myrtle Ave | 0.59mi | 3/1.0 (+1) | 1,098 (-11%) | 3mo | $59,900 | $55 | 47 |
| 312 White Rock Rd | 0.57mi | 3/2.0 (+1) | 1,344 (+9%) | 3mo | $115,000 | $86 | 46 |
| 217 Arnett Blvd | 0.73mi | 3/2.0 (+1) | 1,272 (+3%) | 8mo | $180,000 | $142 | 45 |
| 1501 Claiborne St | 0.67mi | 3/1.0 (+1) | 1,100 (-11%) | 2mo | $52,000 | $47 | 44 |
Match score weights: distance 35% · size 25% · config 20% · recency 20%. Top-matched comps best support the ARV.
Projected returns pro-forma
-3.0% appreciation · 3.0% rent growth · sell at horizon
- IRR
- —
- Equity multiple
- 9.94×
- Total profit
- $49,807
- Equity at exit
- $2,967
- IRR
- —
- Equity multiple
- 21.04×
- Total profit
- $111,679
- Equity at exit
- $1,721
Cash invested: $5,572 (down + closing). Projections, not guarantees.
Landlord ↔ Tenant lean methodology
- Overall (STATE)
- 55 Moderately Landlord-Leaning
- State Virginia
- 55 Moderately Landlord-Leaning · D+2
- County
- — inherits STATE
- City
- — inherits STATE
ZIP-level market 24540
- Home prices YoY
- -20.0%
- Active inventory
- 211
- Price-to-rent
- 1.4×
Monthly cashflow live
- Estimated rent
- $1,206 high interval (Pro) →
- Mortgage (P&I)
- −$104
- Tax from tax record
- −$8 /mo · $91/yr
- Insurance
- −$8
- HOA
- −$0
- Lot rent
- −$0
- Vacancy / Maint / Mgmt
- −$253
- Net cashflow
- $833
Break-even live
Sensitivity live
| Price | -10% $844 | -5% $838 | +0% $833 | +5% $827 | +10% $821 |
|---|---|---|---|---|---|
| Rent | -10% $737 | -5% $785 | +0% $833 | +5% $880 | +10% $928 |
| Rate | -1.0pp $843 | -0.5pp $838 | base $833 | +0.5pp $827 | +1.0pp $822 |
UW: 25.0% down · 7.5% · 30yr · 1.5% tax · 5.0% vac · 8.0% maint · 8.0% mgmt
Financing live
Cash to close
- Down payment
- $4,975
- Closing costs
- $597
- Reserves months
- —
- Total cash needed
- —
Loan-product check · same deal, 3 products live
Conventional
25% down · 7.5% · 30yr
- Down + closing
- —
- Monthly P&I
- —
- Monthly cashflow
- —
- DSCR
- —
- Eligible?
- —
Personal DTI + credit; lowest rate.
DSCR
20% down · 8.5% · 30yr
- Down + closing
- —
- Monthly P&I
- —
- Monthly cashflow
- —
- DSCR
- —
- Eligible?
- —
No personal income docs; deal must DSCR.
Hard money
10% down · 12.0% · 12mo
- Down + closing
- —
- Monthly P&I
- —
- Monthly cashflow
- —
- DSCR
- —
- Eligible?
- —
Short-term bridge; refi at stabilization.
Rent comps 15 comps
| Address | Beds | Baths | Sqft | Rent | $/sqft | DOM | Units | Dist |
|---|---|---|---|---|---|---|---|---|
| 1353 N Main St Apt 6 Danville, VA | 2.0 | 1.0 | 850 | $650 | $0.76 | 46d | 1 | 0.49mi |
| 442 Main St Unit 207 Danville, VA | 2.0 | 2.0 | 850 | $1,500 | $1.76 | 46d | 1 | 0.76mi |
| 501 Craghead St Danville, VA | 1.0 | 1.0 | 750 | $1,300 | $1.73 | 46d | 1 | 0.82mi |
| 315 Lynn St Apt 404 Danville, VA | 2.0 | 2.0 | 1046 | $1,500 | $1.43 | 46d | 1 | 0.82mi |
| 601 Bridge St Unit 116 Danville, VA | 2.0 | 1.0 | 1294 | $1,575 | $1.22 | 46d | 1 | 0.83mi |
| 601 Bridge St Unit 15 Danville, VA | 2.0 | 1.0 | 1294 | $1,400 | $1.08 | 46d | 1 | 0.83mi |
| 601 Bridge St Unit 117 Danville, VA | 2.0 | 2.0 | 1294 | $1,650 | $1.28 | 23d | 1 | 0.83mi |
| 601 Bridge St Unit 212 Danville, VA | 1.0 | 1.0 | 1046 | $1,300 | $1.24 | 23d | 1 | 0.83mi |
| 128 Lowell St Danville, VA | 3.0 | 1.0 | 918 | $1,050 | $1.14 | 46d | 1 | 0.92mi |
| 712 Edwin Ct Danville, VA | 2.0 | 1.0 | 969 | $700 | $0.72 | 46d | 1 | 0.98mi |
| 614 Lynn St Apt 312 Danville, VA | 2.0 | 1.5 | 1200 | $929 | $0.77 | 46d | 1 | 0.99mi |
| 614 Lynn St Apt 303 Danville, VA | 2.0 | 2.0 | 1200 | $929 | $0.77 | 46d | 1 | 0.99mi |
| 117 Ida St Danville, VA | 3.0 | 1.0 | 925 | $1,163 | $1.26 | 46d | 1 | 1.15mi |
| 717 Temple Ave Danville, VA | 3.0 | 1.5 | 1327 | $1,179 | $0.89 | 46d | 1 | 1.29mi |
| 423 Chestnut St Unit 1 Danville, VA | 2.0 | 1.0 | 1200 | $1,400 | $1.17 | 46d | 1 | 1.30mi |
Listing history 7 events
-
2026-06-22days on market $19,900 Active 7 DOM
-
2026-06-21days on market $19,900 Active 6 DOM
-
2026-06-19days on market $19,900 Active 4 DOM
-
2026-06-18days on market $19,900 Active 3 DOM
-
2026-06-17days on market $19,900 Active 2 DOM
-
2026-06-15remarks 309-char remark
-
2026-06-15$19,900 Active 1 DOM
ⓘ Source: listings_history table (triggers on properties + properties_extension) + one-shot
backfill from property_details.listing_events for pre-trigger history.
Tax reassessment forecast VA · Resets to sale price
- Current annual tax
- $91 · $8/mo
- Projected year-2 tax
- $163 · $14/mo
- Expected delta
- +$72/yr (+$6/mo · 78.7%)
ⓘ Screening estimate from a state-policy table — verify with the county assessor before closing.
Climate risk First Street
- Flood 1/10 Low FEMA zone X (unshaded) · 0% chance over 30 yrs
- Wildfire 1/10 Low
- Heat 6/10 Major 7 d/yr ≥105°F today · 18 d/yr by 30 yrs out
- Wind 4/10 Moderate 8% chance of damaging wind over 30 yrs
- Air quality 2/10 Low 0 unhealthy d/yr today · 1 by 30 yrs out
Nearby sold comps map
Loading sold comps map…
Walkable amenities ~0.75 mi
Loading nearby amenities…
Taxation est. · year 1
- Rental income
- $14,473
- − Mortgage interest
- −$1,115
- − Property taxes
- −$91
- − Insurance
- −$100
- − Repairs & maintenance
- −$1,158
- − Management
- −$1,158
- − Depreciation
- −$579
- Taxable income
- $10,273
- Est. tax owed @ 24.0%
- −$2,465
- After-tax cash flow
- $7,525/yr
For passive investors: Depreciation is non-cash, so a rental often shows a tax loss while cash-flowing — sheltering income. Rental losses are passive: they offset passive income freely, and up to $25,000/yr can offset ordinary (W-2) income if you actively participate and your MAGI is under $100k (phasing out to $0 by $150k); unused losses carry forward. On sale, claimed depreciation is recaptured at up to 25%, and gains may owe capital-gains tax (a 1031 exchange can defer both). Figures are a year-1 estimate at your 24.0% rate — not tax advice; consult a CPA.
Schools (NCES district)
- District
- Danville City Public School District
- NCES district ID
- 5101110
- Math proficiency
- 30% ▼ -22.00%
- Reading proficiency
- 44% ▼ -8.00%
- Median HH income
- $31,952
- Composite
- 30.23/100
- National rank
- #6298
- State rank
- #128 of 131 in VA
Livability — Danville
- Score
- 77/100
- State rank
- #91
- US rank
- #2952
Category grades
Schools grade is shown separately in the Schools card above.
Census & demographics
- Census place
- Danville, VA
- County
- Danville City · 59,055 people
- City population
- 59,055
- Metro
- Danville, VA
- Population (ZIP)
- 31,013
- Household income
- $47,924
- Rent vs Own
- Severe rent burden
- 1170.0
Population outlook (Danville County) Hauer SSP2
- Today (2025)
- 40,989 people
- By 2030
- 40,432 · -1.4%
- By 2040
- 39,255 · -4.2%
- By 2050
- 38,035 · -7.2%
- By 2075
- 35,612 · -13.1%
- By 2100
- 30,365 · -25.9%
Race, ethnicity, and origin ACS 2023
- Neighborhood character
- Diverse neighborhood (Simpson 0.57)
- Race & ethnicity
- White 50% Black 42% Two or more races 5% Hispanic / Latino 4%
- Common ancestry
- Slovak 1% Lithuanian 1% Serbian 1%
- Foreign-born
- 2% · Canada
- Languages at home
- 97% English-only · Spanish 2%
Political lean MEDSL · Danville
- 2024 margin
- Strong D (+21.1) · D 60.1% · R 39.0%
- 2008→2024 swing
- +1.9pp toward D · 2008: 19.1pp · 2024: 21.1pp
- All cycles
- 2024: D+21.1 2020: D+22.1 2016: D+19.9 2012: D+22.1 2008: D+19.1
Not yet ingested
- Civics
- —
Market trends
- HPI YoY
- ▼ -58.79%
- Current HPI
- 235.1746
- Rent YoY
- —
- Metro
- Danville, VA
- State GDP YoY
- ▲ 2.40%
- F500 in state
- 50
Industry mix (Fortune 500 HQ in VA)
| Industry | F500 HQs | Revenue |
|---|---|---|
| Aerospace / Defense | 4 | $236B |
|
||
| Technology / Defense | 3 | $32B |
|
||
| Financial Services | 2 | $176B |
|
||
| Utilities | 2 | $27B |
|
||
| Insurance | 2 | $25B |
|
||
| Technology | 2 | $15B |
|
||
Price history
+99.0% since first listed2 events — show timeline
- 2026-06-15 Listed $19,900 DRRAR
- 2023-05-19 Sold (Public Records) $10,000 Public Records
Property tax history
-1.2%/yrLatest (2025): $91 · +0.0% YoY. Source: county tax records.
Cash-flow waterfall
monthlySold comps — $/sqft
last 12 mo · ≤1 miLoading sold comps…