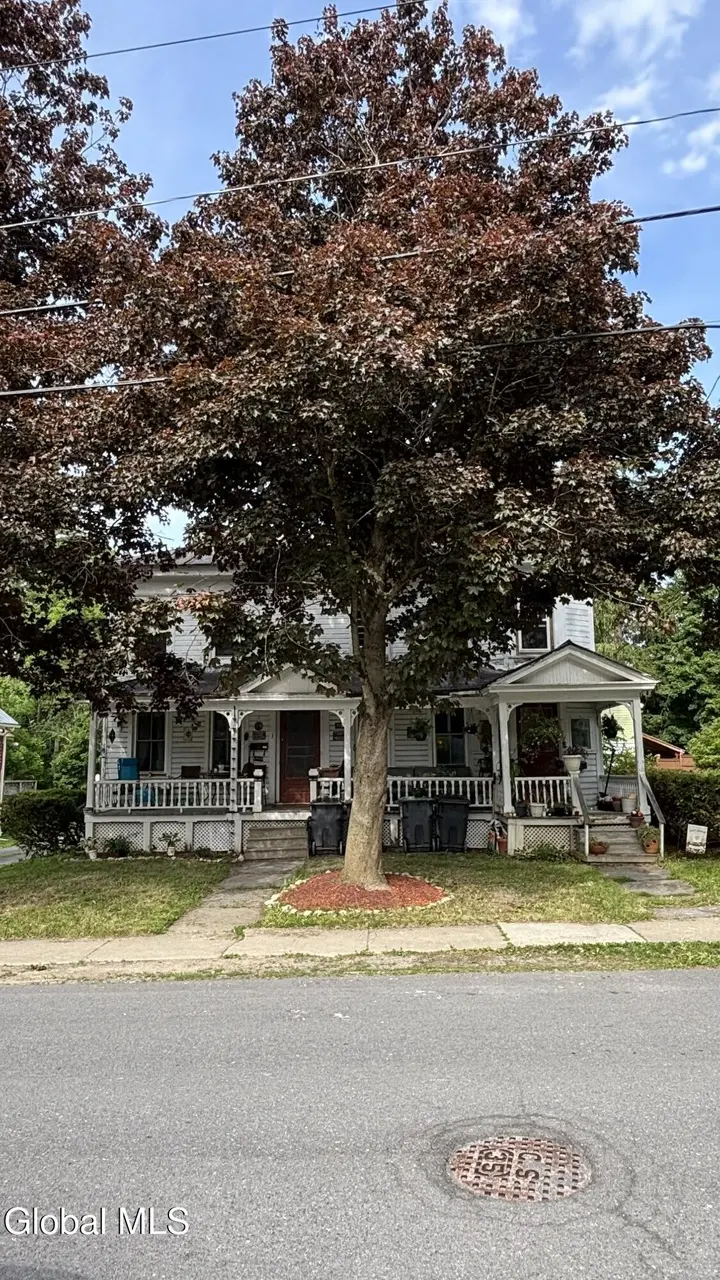
 Duplex
122 Washington Ave · Cobleskill, NY
Flood risk 1/10 · Minimal
- FEMA flood zone
- X (unshaded)
- Chance of flooding over 30 yrs
- 0.0%
- Est. flood insurance / yr
- $473 – $860
Fire risk 1/10 · Minimal
- Est. fire insurance / yr
- $691 – $1,283
Heat risk 2/10 · Minimal
- Hot days now (above 90°F)
- 8 days/yr
- Hot days in 30 yrs
- 18 days/yr
Wind risk 2/10 · Minimal
- Chance of severe wind over 30 yrs
- 2.0%
Air-quality risk 1/10 · Minimal
- Unhealthy air days now
- 0 days/yr
- Unhealthy air days in 30 yrs
- 0 days/yr
Risk factors via First Street. Map © Google.
Why this score? — see what drove the B- grade
The composite is a weighted blend of 9 inputs, each scored 0–100. Each bar is that input's sub-score; the figure is the points it added to the 100-point composite (weight × sub-score).
- Cash flow +20.1/30.0
- ARV discount +11.6/15.0
- Appreciation +9.9/10.0
- DSCR +6.4/10.0
- 1% rule +6.0/10.0
- Schools +4.5/10.0
- Livability +3.1/5.0
- Rent growth +2.5/5.0
- Condition / age +2.5/5.0
$219,000
🖨 Deal sheet 📄 Offer letter ✓ Due diligence
Multi-family units
County records classify this as Multi-Family (2-4 Unit). Listing-text estimate: 2 units. confirmed
Listing remarks
Well-maintained and recently renovated two-family property located on a quiet residential street in the Village of Cobleskill. This income-producing property features two spacious units: one offering 3 bedrooms and 1 full bath, and the second offering 2 bedrooms and 1.5 baths. Both units have been extensively updated with new appliances, updated electrical systems, and modern finishes throughout. Washer and dryer hookups are available in each unit for added tenant convenience. The property also features separate utilities, with tenants responsible for their own utility expenses, helping to maximize owner profitability. Additional highlights include a newer rear roof, off-street parking, and
Key facts
- Two family property
- New appliances
- Modern finishes
Tags
Property features AI
Exterior
- Parking: 4 parking spaces
- Security: Carbon monoxide detector(s); Fire alarm
- Utilities: Public water; Public sewer
- Home design: Duplex; 2,400 living area; Stone foundation; Metal roof
- Construction: Wood siding construction
- Exterior features: Rear porch; Front porch; Cleared lot
Interior
- Bedrooms: Unit 1: 2 bedrooms (second level); Unit 2: 3 bedrooms (second level)
- Flooring: Vinyl flooring; Wood flooring; Ceramic tile flooring
- Bathrooms: Two full bathrooms (both on second level); One half-bath in Unit 1
- Heating & cooling: Forced air heating; Natural gas heating
- Interior features: Solid surface counters; High-speed internet; Crown molding
Neighborhood map
What this means for you Summary
Snapshot
- This is a 1×3.0bd/1.5ba + 1×2.0bd/1.5ba units multifamily listed at $219k.
Deal economics
- At list price, monthly cash flow is $271 ($3k/yr) — positive. Per door: $136/mo.
- The deal already cash-flows at list — no discount required.
- Meets the 1% rule at list price ($2k rent vs $219k).
- Cap rate 7.8% vs local median 2.3% in Cobleskill — top-decile yield for the area; either an underpriced asset or a hidden risk that comps aren't pricing in. Stress-test before assuming the spread holds.
Location & tenants
- Location reads 62/100 on livability (#876 in NY) — a middle-class / working-renter tenant base. Strengths: cost of living A, housing A, health & safety A; Watch: schools D, amenities F, commute F.
- Cobleskill-Richmondville Central School District (town): math 53% / reading 52% proficiency, ranked #336 of 590 in NY (top 57%) — acceptable for families but not a draw, mixed tenant base, ~2y average lease.
- Market conditions: 31 active listings in the ZIP; 35 units permitted in Schoharie County in 2024 (0 in 5+ unit buildings).
Forward outlook
- In year one you build about $23k of equity ($2k loan paydown + $22k appreciation (9.9% local appreciation)).
- Schoharie County population projected at -30% by 2050 — secular population decline; favor cash flow + early exit over multi-decade hold.
- At projected returns (9.9% appreciation + 3.0% rent growth), your $61k cash investment doubles in ~3 years — after that, you're playing with house money.
- By year 2, paydown + projected appreciation supports a ~$37k cash-out refi (75% LTV) — recoverable capital for the next deal without selling this one.
Negotiation context
- Only 10 days on market — expect competitive offers; lowballing is unlikely to land.
- Current owner paid $51k; list at $219k implies a 326% gain — meaningful room to come down on a strong offer.
Risks & watch-outs
- Watch-outs: built in 1900 — expect roof / HVAC / electrical / plumbing capex.
Questions for the listing agent
- Can we see the unit-by-unit rent roll, current vacancy, and any below-market leases? What's the average tenancy length?
- What capital expenditures (roof, boiler, parking lot, exteriors) have been made in the last 5 years, and what's planned in the next 2?
- Built in 1900 — when were the roof, HVAC, electrical panel, plumbing, and water heater last replaced?
- Is there a deadline driving the sale (1031 exchange, divorce, estate, relocation)? That informs how much negotiation room exists.
- Schools are D-rated, which usually means shorter tenancies and higher turnover. Who's the typical renter profile here, and what's been the actual vacancy rate?
- What's the average days-on-market for RENTAL listings here right now (not sales)? A rising rental-DOM trend means longer vacancies and softer asking-rent achievability than the comps imply.
- What's the recent tenant-quality profile in this submarket — average credit score on applications, eviction rate, late-payment / NSF rate, and stable-employment percentage? A property-management company in the area should have these aggregated.
- How much new apartment / multifamily construction is in the pipeline within 1–3 miles? Heavy new supply (>2% of stock underway) typically softens rents 12–24 months out; light construction supports rent growth.
Investment metrics
- 1% rule
- 1.10% ✓
- Cap rate
- 7.78%
- Cash-on-cash
- 5.31%
- DSCR
- 1.24
- GRM
- 7.6
CMA / ARV
- ARV (on-the-fly)
- $241,200
- Comps found
- 4
Show comp detail 4 sales within ~0.75 mi
| Address | Dist | Beds/Ba | Sqft | Sold | Price | $/sf | Match |
|---|---|---|---|---|---|---|---|
| 242 N Grand St | 0.23mi | 6/2.0 | 2,204 (-9%) | 5mo | $254,900 | $116 | 70 |
| 111 Park Pl | 0.25mi | 6/2.0 | 2,184 (-10%) | 4mo | $105,000 | $48 | 69 |
| 113 Rose St | 0.23mi | 5/2.0 (-1) | 2,374 (-2%) | 23mo | $238,000 | $100 | 62 |
| 153 Elm St | 0.12mi | 5/3.0 (-1) | 2,148 (-11%) | 24mo | $65,000 | $30 | 47 |
Match score weights: distance 35% · size 25% · config 20% · recency 20%. Top-matched comps best support the ARV.
Projected returns pro-forma
9.86% appreciation · 3.0% rent growth · sell at horizon
- IRR
- 27.9%
- Equity multiple
- 3.19×
- Total profit
- $134,512
- Equity at exit
- $194,993
- IRR
- 24.3%
- Equity multiple
- 7.23×
- Total profit
- $382,171
- Equity at exit
- $418,087
Cash invested: $61,320 (down + closing). Projections, not guarantees.
Landlord ↔ Tenant lean methodology
- Overall (STATE)
- 15 Strongly Tenant-Friendly
- State New York
- 15 Strongly Tenant-Friendly · D+10
- County
- — inherits STATE
- City
- — inherits STATE
ZIP-level market 12043
- Home prices YoY
- 3.3%
- Active inventory
- 31
- Price-to-rent
- 14.8×
Monthly cashflow live
- Estimated rent
- $2,417 medium interval (Pro) →
- Mortgage (P&I)
- −$1,148
- Tax from tax record
- −$398 /mo · $4,780/yr
- Insurance
- −$91
- HOA
- −$0
- Vacancy / Maint / Mgmt
- −$508
- Net cashflow
- $271
Break-even live
2-unit breakdown (identical units grouped — click to expand)
| Units | Beds | Baths | Est. rent |
|---|---|---|---|
| 1× unit | 3.0 | 1.5 | $1,230 |
| 1× unit | 2.0 | 1.5 | $1,187 |
| Total (2 units) | $2,417 | ||
UW: 25.0% down · 7.5% · 30yr · 1.5% tax · 5.0% vac · 8.0% maint · 8.0% mgmt
Financing live
Cash to close
- Down payment
- $54,750
- Closing costs
- $6,570
- Reserves months
- —
- Total cash needed
- —
Loan-product check · same deal, 3 products live
Conventional
25% down · 7.5% · 30yr
- Down + closing
- —
- Monthly P&I
- —
- Monthly cashflow
- —
- DSCR
- —
- Eligible?
- —
Personal DTI + credit; lowest rate.
DSCR
20% down · 8.5% · 30yr
- Down + closing
- —
- Monthly P&I
- —
- Monthly cashflow
- —
- DSCR
- —
- Eligible?
- —
No personal income docs; deal must DSCR.
Hard money
10% down · 12.0% · 12mo
- Down + closing
- —
- Monthly P&I
- —
- Monthly cashflow
- —
- DSCR
- —
- Eligible?
- —
Short-term bridge; refi at stabilization.
Listing history 8 events
-
2026-06-18days on market $219,000 Active 10 DOM
-
2026-06-17days on market $219,000 Active 9 DOM
-
2026-06-16days on market $219,000 Active 8 DOM
-
2026-06-15days on market $219,000 Active 7 DOM
-
2026-06-13days on market $219,000 Active 5 DOM
-
2026-06-12days on market $219,000 Active 4 DOM
-
2026-06-09remarks 699-char remark
-
2026-06-09$219,000 Active 1 DOM
ⓘ Source: listings_history table (triggers on properties + properties_extension) + one-shot
backfill from property_details.listing_events for pre-trigger history.
Tax reassessment forecast NY · Partial reset (capped growth)
- Current annual tax
- $4,780 · $398/mo
- Projected year-2 tax
- $4,780 · $398/mo
- Expected delta
- $0/yr ($0/mo · 0.0%)
ⓘ Screening estimate from a state-policy table — verify with the county assessor before closing.
Climate risk First Street
- Flood 1/10 Low FEMA zone X (unshaded) · 0% chance over 30 yrs
- Wildfire 1/10 Low
- Heat 2/10 Low 8 d/yr ≥90°F today · 18 d/yr by 30 yrs out
- Wind 2/10 Low 2% chance of damaging wind over 30 yrs
- Air quality 1/10 Low 0 unhealthy d/yr today · 0 by 30 yrs out
Nearby sold comps map
Loading sold comps map…
Walkable amenities ~0.75 mi
Loading nearby amenities…
Taxation est. · year 1
- Rental income
- $29,004
- − Mortgage interest
- −$12,267
- − Property taxes
- −$4,780
- − Insurance
- −$1,095
- − Repairs & maintenance
- −$2,320
- − Management
- −$2,320
- − Depreciation
- −$6,371
- Taxable loss
- −$150
- Est. tax savings @ 24.0%
- +$36
- After-tax cash flow
- $3,293/yr
For passive investors: Depreciation is non-cash, so a rental often shows a tax loss while cash-flowing — sheltering income. Rental losses are passive: they offset passive income freely, and up to $25,000/yr can offset ordinary (W-2) income if you actively participate and your MAGI is under $100k (phasing out to $0 by $150k); unused losses carry forward. On sale, claimed depreciation is recaptured at up to 25%, and gains may owe capital-gains tax (a 1031 exchange can defer both). Figures are a year-1 estimate at your 24.0% rate — not tax advice; consult a CPA.
Schools (NCES district)
- District
- Cobleskill-Richmondville Central School District
- NCES district ID
- 3600010
- Math proficiency
- 53% ▲ 2.00%
- Reading proficiency
- 52% ▲ 10.00%
- Median HH income
- $49,555
- Composite
- 44.83/100
- National rank
- #2734
- State rank
- #336 of 590 in NY
Livability — Cobleskill
- Score
- 62/100
- State rank
- #876
- US rank
- #16581
Category grades
Schools grade is shown separately in the Schools card above.
Census & demographics
- Census place
- Cobleskill, NY
- Population (ZIP)
- 7,883
Population outlook (Schoharie County) Hauer SSP2
- Today (2025)
- 29,080 people
- By 2030
- 27,417 · -5.7%
- By 2040
- 23,835 · -18.0%
- By 2050
- 20,482 · -29.6%
- By 2075
- 14,323 · -50.7%
- By 2100
- 9,636 · -66.9%
Race, ethnicity, and origin ACS 2023
- Neighborhood character
- Predominantly White (85%)
- Race & ethnicity
- White 85% Two or more races 5% Hispanic / Latino 5% Black 2% Asian 2%
- Common ancestry
- Lithuanian 4% Romanian 4% Iranian 3%
- Foreign-born
- 3% · Canada, China
- Languages at home
- 93% English-only · German/W. Germanic 3% Spanish 2% Korean 1%
Political lean MEDSL · Schoharie
- 2024 margin
- Solid R (+30.5) · D 34.7% · R 65.3%
- 2008→2024 swing
- -16.2pp toward R · 2008: -14.3pp · 2024: -30.5pp
- All cycles
- 2024: R+30.5 2020: R+29.0 2016: R+34.7 2012: R+16.6 2008: R+14.3
Not yet ingested
- Civics
- —
Market trends
- HPI YoY
- ▲ 9.86%
- Current HPI
- 310.2889
- Rent YoY
- —
- Metro
- —
- State GDP YoY
- ▲ 2.60%
- F500 in state
- 92
Industry mix (Fortune 500 HQ in NY)
| Industry | F500 HQs | Revenue |
|---|---|---|
| Financial Services | 10 | $950B |
|
||
| Consumer Goods | 9 | $162B |
|
||
| Insurance | 4 | $225B |
|
||
| Telecommunications | 2 | $144B |
|
||
| Pharmaceuticals | 2 | $112B |
|
||
| Media / Entertainment | 2 | $69B |
|
||
Price history
+386.7% since first listed3 events — show timeline
- 2026-06-08 Listed $219,000 Global MLS
- 2015-09-25 Sold (Public Records) $51,462 Public Records
- 2004-10-25 Sold (Public Records) $45,000 Public Records
Property tax history
+1.5%/yrLatest (2025): $4,780 · +5.1% YoY. Source: county tax records.
Cash-flow waterfall
monthlySold comps — $/sqft
last 12 mo · ≤1 miLoading sold comps…