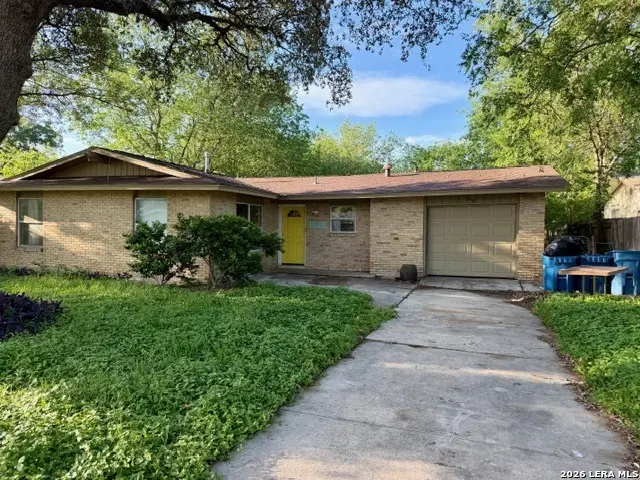
5110 Happiness St · Kirby, TX
Flood risk 1/10 · Minimal
- FEMA flood zone
- X (unshaded)
- Chance of flooding over 30 yrs
- 0.0%
- Est. flood insurance / yr
- $507 – $1,088
Fire risk 2/10 · Minimal
- Est. fire insurance / yr
- $1,222 – $2,270
Heat risk 8/10 · Major
- Hot days now (above 108°F)
- 7 days/yr
- Hot days in 30 yrs
- 22 days/yr
Wind risk 8/10 · Major
- Chance of severe wind over 30 yrs
- 80.0%
Air-quality risk 2/10 · Minimal
- Unhealthy air days now
- 0 days/yr
- Unhealthy air days in 30 yrs
- 1 days/yr
Risk factors via First Street. Map © Google.
Why this score? — see what drove the B+ grade
The composite is a weighted blend of 9 inputs, each scored 0–100. Each bar is that input's sub-score; the figure is the points it added to the 100-point composite (weight × sub-score).
- Cash flow +30.0/30.0
- 1% rule +10.0/10.0
- DSCR +10.0/10.0
- ARV discount +7.5/15.0
- Appreciation +6.4/10.0
- Rent growth +4.4/5.0
- Livability +3.2/5.0
- Condition / age +2.5/5.0
- Schools +2.4/10.0
$97,000
🖨 Deal sheet 📄 Offer letter ✓ Due diligence
Listing remarks
Great Opportunity with Major Updates Already Done! With key improvements already in place, it's a fantastic opportunity for a buyer or investor looking to add value. Updates completed in 2014 include a roof, double-pane energy-efficient windows, new doors, updated lighting with ceiling fans and interior paint. The kitchen features granite countertops, travertine backsplash, updated appliances, and a convenient eating bar that opens to the living area. Enjoy a light, open floor plan with tile flooring in the living, dining, kitchen, and bathrooms, plus a separate dining room for added flexibility. Located in a quiet neighborhood with great neighbors and an active community, this home offers
Key facts
- Updated appliances
- Separate dining room
- Tile flooring
Tags
Property features AI
Finance
- Financial info: Potential short sale (subject to 3rd party approval)
- HOA & community: Subdivision: Kirby Manor
Exterior
- Parking: 1-car garage
- Utilities: Gas supplied by CPS; Electricity supplied by CPS; Water supplied by Kirby; Sewer supplied by Kirby; Garbage service by Kirby; Water system and sewer system
- Home design: Pre-owned single-family property; Approximate age: 61 years
- Construction: Asbestos shingle and brick exterior; Composition roof; Slab foundation
- Exterior features: Covered patio; Patio slab; Chain link fence; Mature trees
Interior
- Kitchen: Kitchen (12 x 8); Stove/Range
- Bedrooms: Master bedroom on lower level with full bath (13 x 10); Bedroom 2 (11 x 10); Bedroom 3 (10 x 10); Bedroom 4 (15 x 11)
- Flooring: Ceramic tile; Linoleum; Unstained concrete
- Bathrooms: Two full bathrooms; Master bath with shower only (5 x 5)
- Heating & cooling: Central heating (natural gas); Central air conditioning
- Interior features: Living and dining room combined; One living area; Utility room inside; Ground level / no steps; All bedrooms downstairs; Laundry on main level; Washer connection; Dryer connection; Stove/Range included
- Laundry & utility: Washer connection; Dryer connection; Laundry on main level; Utility room inside
Neighborhood map
What this means for you Summary
Snapshot
- This is a 3-bed/2.0-bath single-family listed at $97k.
Deal economics
- At list price, monthly cash flow is $590 ($7k/yr) — positive.
- The deal already cash-flows at list — no discount required.
- Meets the 1% rule at list price ($2k rent vs $97k).
- Recommended offer: $96k (1.5% below list) — sets the bar for market timing.
- Cap rate 13.6% vs local median 5.5% in Kirby — top-decile yield for the area; either an underpriced asset or a hidden risk that comps aren't pricing in. Stress-test before assuming the spread holds.
Location & tenants
- Location reads 64/100 on livability (#761 in TX) — a middle-class / working-renter tenant base. Strengths: cost of living A+, housing A+, health & safety B; Watch: crime F, amenities F, commute F.
- Judson ISD (suburban): math 21% / reading 33% proficiency, ranked #660 of 826 in TX (top 80%) — low school quality limits family demand, transient renter base, plan for 1-2y turnover.
- Zoned schools: Hopkins El (math 20% / reading 21%, grade F, #3,515 of 4,322 statewide, top 82%, 788 students, 84% FRL); Karen Wagner H S (math 12% / reading 29%, grade F, #1,389 of 1,632 statewide, top 86%, 2,366 students, 80% FRL) — zoned schools average 82% FRL vs 57% district-wide (25 pts higher); higher-poverty schools than district average — tighter screening recommended.
- Market conditions: Rents rising fast (+7.7%/yr); 66 active listings in the ZIP; 40 comparable units currently listed for rent nearby; rentals at typical pace (median 24d on market — plan ~3-4 weeks tenant-placement turnaround); 8,308 units permitted in Bexar County in 2024 (2,506 in 5+ unit buildings).
- This rent runs 37% of the median local income ($52k/yr) — at the standard rent-burdened threshold; future hikes will face affordability resistance.
Forward outlook
- In year one you build about $3k of equity ($671 loan paydown + $3k appreciation (2.7% local appreciation)).
- Bexar County population projected at +50% by 2050 — long-run rental-demand tailwind backs the buy-and-hold thesis.
- At projected returns (2.7% appreciation + 7.7% rent growth), your $27k cash investment doubles in ~3 years — after that, you're playing with house money.
- By year 10, paydown + projected appreciation supports a ~$32k cash-out refi (75% LTV) — recoverable capital for the next deal without selling this one.
Negotiation context
- It's been on market 19 days — a 2% lower offer ($96k) is reasonable based on typical stale-listing flexibility.
- 2 sale attempts since 23y ago with the ask held roughly flat each time — persistent listings suggest the price (not the market) is what's stuck; bring a comps-based counter.
Risks & watch-outs
- Climate carrying-cost: severe wind risk, 80% chance of damaging wind over 30y; extreme-heat days projected 7→22/yr by 2055 (HVAC capex compounding) — expect insurance premiums to compound above CPI over the hold.
Questions for the listing agent
- Built in 1965 — when were the roof, HVAC, electrical panel, plumbing, and water heater last replaced?
- Is there a deadline driving the sale (1031 exchange, divorce, estate, relocation)? That informs how much negotiation room exists.
- Schools are F-rated, which usually means shorter tenancies and higher turnover. Who's the typical renter profile here, and what's been the actual vacancy rate?
- Crime grade is F in this area — have there been break-ins, vandalism, or insurance claims at this property in the last 3 years? What carrier currently insures it and at what premium?
- What's the average days-on-market for RENTAL listings here right now (not sales)? A rising rental-DOM trend means longer vacancies and softer asking-rent achievability than the comps imply.
- What's the recent tenant-quality profile in this submarket — average credit score on applications, eviction rate, late-payment / NSF rate, and stable-employment percentage? A property-management company in the area should have these aggregated.
- How much new for-sale + rental construction is in the pipeline within 1–3 miles? Heavy new supply typically softens prices + rents 12–24 months out; constrained supply supports both.
Investment metrics
- 1% rule
- 1.64% ✓
- Cap rate
- 13.59%
- Cash-on-cash
- 26.06%
- DSCR
- 2.16
- GRM
- 5.1
CMA / ARV
- ARV (on-the-fly)
- $194,180
- Comps found
- 12
Show comp detail 12 sales within ~0.75 mi
| Address | Dist | Beds/Ba | Sqft | Sold | Price | $/sf | Match |
|---|---|---|---|---|---|---|---|
| 5346 Binz Engleman | 0.32mi | 3/2.0 | 1,418 (+2%) | 0mo | $175,000 | $123 | 81 |
| 5010 David Scott | 0.27mi | 3/2.0 | 1,356 (-2%) | 9mo | $189,900 | $140 | 76 |
| 3703 Hauck | 0.32mi | 3/2.0 | 1,412 (+2%) | 8mo | $215,000 | $152 | 75 |
| 5402 Happiness | 0.36mi | 3/2.0 | 1,399 (+1%) | 8mo | $200,000 | $143 | 75 |
| 5027 Cinderella | 0.23mi | 3/2.0 | 1,214 (-12%) | 5mo | $215,000 | $177 | 64 |
| 5229 Swann | 0.38mi | 3/1.0 | 1,479 (+7%) | 7mo | $194,555 | $132 | 62 |
| 4804 Aspen Wood | 0.52mi | 3/1.0 | 1,320 (-5%) | 3mo | $179,900 | $136 | 61 |
| 5251 Gordon Cooper | 0.37mi | 3/2.0 | 1,540 (+11%) | 10mo | $239,000 | $155 | 56 |
| 815 Hickory Hill Dr | 0.71mi | 3/2.0 | 1,316 (-5%) | 4mo | $125,000 | $95 | 55 |
| 4814 Dick Gordon | 0.41mi | 3/2.0 | 1,573 (+13%) | 5mo | $149,900 | $95 | 55 |
| 5358 Peppermint | 0.71mi | 3/2.0 | 1,293 (-7%) | 2mo | $185,000 | $143 | 54 |
| 5429 Boatman | 0.63mi | 3/2.0 | 1,491 (+8%) | 6mo | $199,999 | $134 | 53 |
Match score weights: distance 35% · size 25% · config 20% · recency 20%. Top-matched comps best support the ARV.
Projected returns pro-forma
2.73% appreciation · 7.72% rent growth · sell at horizon
- IRR
- 35.4%
- Equity multiple
- 3.06×
- Total profit
- $55,825
- Equity at exit
- $42,144
- IRR
- 38.3%
- Equity multiple
- 6.98×
- Total profit
- $162,441
- Equity at exit
- $63,827
Cash invested: $27,160 (down + closing). Projections, not guarantees.
Landlord ↔ Tenant lean methodology
- Overall (STATE)
- 87 Strongly Landlord-Friendly
- State Texas
- 87 Strongly Landlord-Friendly · R+5
- County
- — inherits STATE
- City
- — inherits STATE
ZIP-level market 78219
- Home prices YoY
- 0.8%
- Rents YoY
- 7.7%
- Active inventory
- 66
- Price-to-rent
- 5.1×
Monthly cashflow live
- Estimated rent
- $1,595 high interval (Pro) →
- Mortgage (P&I)
- −$509
- Tax est. 1.5%
- −$121 /mo · $1,455/yr
- Insurance
- −$40
- HOA
- −$0
- Vacancy / Maint / Mgmt
- −$335
- Net cashflow
- $590
Break-even live
UW: 25.0% down · 7.5% · 30yr · 1.5% tax · 5.0% vac · 8.0% maint · 8.0% mgmt
Financing live
Cash to close
- Down payment
- $24,250
- Closing costs
- $2,910
- Reserves months
- —
- Total cash needed
- —
Loan-product check · same deal, 3 products live
Conventional
25% down · 7.5% · 30yr
- Down + closing
- —
- Monthly P&I
- —
- Monthly cashflow
- —
- DSCR
- —
- Eligible?
- —
Personal DTI + credit; lowest rate.
DSCR
20% down · 8.5% · 30yr
- Down + closing
- —
- Monthly P&I
- —
- Monthly cashflow
- —
- DSCR
- —
- Eligible?
- —
No personal income docs; deal must DSCR.
Hard money
10% down · 12.0% · 12mo
- Down + closing
- —
- Monthly P&I
- —
- Monthly cashflow
- —
- DSCR
- —
- Eligible?
- —
Short-term bridge; refi at stabilization.
Rent comps 40 comps
| Address | Beds | Baths | Sqft | Rent | $/sqft | DOM | Units | Dist |
|---|---|---|---|---|---|---|---|---|
| 5039 Ed White St Unit 78219 San Antonio, TX | 3.0 | 2.0 | 1145 | $1,600 | $1.40 | 4d | 1 | 0.16mi |
| 5015 David Scott Dr San Antonio, TX | 3.0 | 2.0 | 1356 | $1,750 | $1.29 | 24d | 1 | 0.29mi |
| 3407 Alan Shepard Dr San Antonio, TX | 3.0 | 2.0 | 1174 | $1,700 | $1.45 | 24d | 1 | 0.30mi |
| 2707 Alan Shepard Dr San Antonio, TX | 3.0 | 2.0 | 1285 | $1,900 | $1.48 | 44d | 1 | 0.36mi |
| 5003 Starfire St San Antonio, TX | 3.0 | 2.0 | 1277 | $1,650 | $1.29 | 4d | 1 | 0.40mi |
| 3707 Autumn Ln San Antonio, TX | 3.0 | 2.0 | 1340 | $1,500 | $1.12 | 44d | 1 | 0.41mi |
| 5019 Starfire St San Antonio, TX | 3.0 | 2.0 | 1532 | $2,100 | $1.37 | 44d | 1 | 0.42mi |
| 5405 Borchers Dr San Antonio, TX | 3.0 | 1.0 | 1024 | $1,295 | $1.26 | 3d | 1 | 0.50mi |
| 5212 Vinecrest Cir San Antonio, TX | 3.0 | 2.5 | 1421 | $2,100 | $1.48 | 44d | 1 | 0.54mi |
| 2540 Corian Glen Dr San Antonio, TX | 3.0 | 2.0 | 1178 | $1,300 | $1.10 | 22d | 1 | 0.57mi |
| 4819 Lunar San Antonio, TX | 3.0 | 2.0 | 1148 | $1,289 | $1.12 | 4d | 1 | 0.65mi |
| 2644 Ackerman Rd San Antonio, TX | 1.0–3.0 | 1.0–2.0 | 853 | $1,230 | $1.44 | 44d | 1 | 0.75mi |
| 4203 Misty Springs Dr San Antonio, TX | 3.0 | 2.5 | 1525 | $1,495 | $0.98 | 24d | 1 | 0.97mi |
| 4334 Hickory Hill Dr San Antonio, TX | 3.0 | 1.5 | 1129 | $1,550 | $1.37 | 11d | 1 | 0.99mi |
| 5719 Country Sun Dr San Antonio, TX | 3.0 | 2.0 | 1485 | $1,400 | $0.94 | 24d | 1 | 1.08mi |
| 5727 Jones Fall Dr San Antonio, TX | 3.0 | 2.0 | 1544 | $1,495 | $0.97 | 24d | 1 | 1.14mi |
| 4545 Hoeneke St San Antonio, TX | 2.0 | 2.0 | 995 | $999 | $1.00 | 4d | 2 | 1.14mi |
| 3669 Candlehead Ln San Antonio, TX | 3.0 | 2.5 | 1294 | $1,700 | $1.31 | 44d | 1 | 1.15mi |
| 4066 Sunrise Pass San Antonio, TX | 3.0 | 2.0 | 977 | $1,550 | $1.59 | 4d | 1 | 1.16mi |
| 4082 Sunrise Pass San Antonio, TX | 3.0 | 1.0 | 1125 | $1,355 | $1.20 | 4d | 1 | 1.17mi |
| 4439 Misty Springs Dr San Antonio, TX | 3.0 | 2.5 | 1591 | $1,495 | $0.94 | 12d | 1 | 1.18mi |
| 3643 Cameron Spgs San Antonio, TX | 3.0 | 1.5 | 1501 | $1,180 | $0.79 | 3d | 1 | 1.21mi |
| 4102 Dakota Sun San Antonio, TX | 3.0 | 1.0 | 1202 | $1,350 | $1.12 | 44d | 1 | 1.22mi |
| 4074 Gallery Sun Dr San Antonio, TX | 2.0 | 1.0 | 969 | $1,295 | $1.34 | 44d | 1 | 1.22mi |
| 4619 Dietrich Rd San Antonio, TX | 1.0–3.0 | 1.0–1.5 | 775 | $999 | $1.29 | 44d | 1 | 1.26mi |
| 4123 Frontier Sun San Antonio, TX | 3.0 | 2.0 | 1086 | $1,350 | $1.24 | 44d | 1 | 1.27mi |
| 4078 Enchanted Sun San Antonio, TX | 3.0 | 1.0 | 1056 | $1,250 | $1.18 | 24d | 1 | 1.28mi |
| 5840 Glacier Sun Dr San Antonio, TX | 3.0 | 2.0 | 1344 | $1,749 | $1.30 | 2d | 1 | 1.28mi |
| 4002 Fire Sun San Antonio, TX | 3.0 | 2.0 | 1004 | $1,800 | $1.79 | 24d | 1 | 1.30mi |
| 4162 Frontier Sun San Antonio, TX | 3.0 | 2.5 | 1246 | $1,400 | $1.12 | 44d | 1 | 1.32mi |
| 2414 Indian Frst San Antonio, TX | 3.0 | 2.0 | 1604 | $1,495 | $0.93 | 20d | 1 | 1.37mi |
| 2414 Indian Frst San Antonio, TX | 3.0 | 2.0 | 1604 | $1,495 | $0.93 | 24d | 1 | 1.37mi |
| 5846 Sun Farm San Antonio, TX | 3.0 | 2.0 | 1168 | $1,425 | $1.22 | 24d | 1 | 1.38mi |
| 6206 Eddie Way Unit 2 San Antonio, TX | 3.0 | 2.5 | 1225 | $1,350 | $1.10 | 24d | 1 | 1.39mi |
| 6206 Eddie Way Unit 2 San Antonio, TX | 3.0 | 2.5 | 1225 | $1,350 | $1.10 | 3d | 1 | 1.39mi |
| 6210 Eddie Way Unit 1 San Antonio, TX | 3.0 | 2.5 | 1225 | $1,350 | $1.10 | 3d | 1 | 1.40mi |
| 6210 Eddie Way Unit 1 San Antonio, TX | 3.0 | 2.5 | 1225 | $1,350 | $1.10 | 44d | 1 | 1.40mi |
| 6214 Eddie Way Unit 2 San Antonio, TX | 3.0 | 2.5 | 1225 | $1,600 | $1.31 | 22d | 1 | 1.41mi |
| 6214 Eddie Way San Antonio, TX | 3.0 | 2.5 | 1225 | $1,600 | $1.31 | 20d | 1 | 1.41mi |
| 2631 Sunset Bnd San Antonio, TX | 3.0 | 2.0 | 1355 | $1,650 | $1.22 | 24d | 1 | 1.41mi |
Listing history 16 events
-
2026-06-08status $97,000 Pending 19 DOM
-
2026-06-07days on market $97,000 Active Option 19 DOM
-
2026-06-04days on market $97,000 Active Option 16 DOM
-
2026-06-03days on market $97,000 Active Option 15 DOM
-
2026-06-02days on market $97,000 Active Option 14 DOM
-
2026-06-01days on market $97,000 Active Option 13 DOM
-
2026-05-31days on market $97,000 Active Option 12 DOM
-
2026-05-19$97,000 New
-
2014-12-22soldstatus
-
2012-01-11soldstatus
-
2009-12-15soldstatus
-
2009-05-29soldstatus
-
2004-02-06soldstatus
-
2003-12-17historical
-
2003-09-25$89,000
-
1995-08-01soldstatus
ⓘ Source: listings_history table (triggers on properties + properties_extension) + one-shot
backfill from property_details.listing_events for pre-trigger history.
Climate risk First Street
- Flood 1/10 Low FEMA zone X (unshaded) · 0% chance over 30 yrs
- Wildfire 2/10 Low
- Heat 8/10 Severe 7 d/yr ≥108°F today · 22 d/yr by 30 yrs out
- Wind 8/10 Severe 80% chance of damaging wind over 30 yrs
- Air quality 2/10 Low 0 unhealthy d/yr today · 1 by 30 yrs out
Nearby sold comps map
Loading sold comps map…
Walkable amenities ~0.75 mi
Loading nearby amenities…
Taxation est. · year 1
- Rental income
- $19,141
- − Mortgage interest
- −$5,434
- − Property taxes
- −$1,455
- − Insurance
- −$485
- − Repairs & maintenance
- −$1,531
- − Management
- −$1,531
- − Depreciation
- −$2,822
- Taxable income
- $5,883
- Est. tax owed @ 24.0%
- −$1,412
- After-tax cash flow
- $5,665/yr
For passive investors: Depreciation is non-cash, so a rental often shows a tax loss while cash-flowing — sheltering income. Rental losses are passive: they offset passive income freely, and up to $25,000/yr can offset ordinary (W-2) income if you actively participate and your MAGI is under $100k (phasing out to $0 by $150k); unused losses carry forward. On sale, claimed depreciation is recaptured at up to 25%, and gains may owe capital-gains tax (a 1031 exchange can defer both). Figures are a year-1 estimate at your 24.0% rate — not tax advice; consult a CPA.
Schools (NCES district)
- District
- Judson ISD
- NCES district ID
- 4824990
- Math proficiency
- 21% ▼ -21.00%
- Reading proficiency
- 33% ▼ -7.00%
- Median HH income
- $57,542
- Composite
- 24.39/100
- National rank
- #7689
- State rank
- #660 of 826 in TX
Livability — Kirby
- Score
- 64/100
- State rank
- #761
- US rank
- #13943
Category grades
Schools grade is shown separately in the Schools card above.
Census & demographics
- Census place
- Kirby, TX
- County
- Bexar County · 1,990,555 people
- Metro
- San Antonio-New Braunfels, TX
- Population (ZIP)
- 17,924
- Household income
- $52,094
- Rent vs Own
- Severe rent burden
- 852.0
Population outlook (Bexar County) Hauer SSP2
- Today (2025)
- 2,336,851 people
- By 2030
- 2,560,728 · +9.6%
- By 2040
- 3,020,569 · +29.3%
- By 2050
- 3,493,522 · +49.5%
- By 2075
- 4,668,459 · +99.8%
- By 2100
- 5,533,242 · +136.8%
Race, ethnicity, and origin ACS 2023
- Neighborhood character
- Diverse neighborhood (Simpson 0.63)
- Race & ethnicity
- Hispanic / Latino 53% Two or more races 27% Black 26% White 16% Asian 1%
- Hispanic origin (detail)
- Mexican 45%
- Common ancestry
- Lithuanian 1% Romanian 1% Slovak 1%
- Foreign-born
- 13% · Canada
- Languages at home
- 67% English-only · Spanish 31% Vietnamese 1%
Political lean MEDSL · Bexar
- 2024 margin
- Lean D (+9.8) · D 54.3% · R 44.6% · Other 1.1%
- 2008→2024 swing
- +4.2pp toward D · 2008: 5.6pp · 2024: 9.8pp
- All cycles
- 2024: D+9.8 2020: D+18.2 2016: D+13.5 2012: D+4.6 2008: D+5.6
Not yet ingested
- Civics
- —
Market trends
- HPI YoY
- ▲ 2.73%
- Current HPI
- 328.5107
- Rent YoY
- ▲ 7.72%
- Metro
- San Antonio-New Braunfels, TX
- State GDP YoY
- ▲ 3.95%
- F500 in state
- 110
Industry mix (Fortune 500 HQ in TX)
| Industry | F500 HQs | Revenue |
|---|---|---|
| Energy | 16 | $1,198B |
|
||
| Technology | 5 | $198B |
|
||
| Engineering / Construction | 4 | $72B |
|
||
| Energy Services | 3 | $60B |
|
||
| Utilities | 3 | $41B |
|
||
| Healthcare | 2 | $330B |
|
||
Price history
+9.0% since first listed9 events — show timeline
- 2026-05-19 Listed $97,000 LERA
- 2014-12-22 Sold (Public Records) — Public Records
- 2012-01-11 Sold (Public Records) — Public Records
- 2009-12-15 Sold (Public Records) — Public Records
- 2009-05-29 Sold (Public Records) — Public Records
- 2004-02-06 Sold (Public Records) — Public Records
- 2003-12-17 Listing Removed — LERA
- 2003-09-25 Listed $89,000 LERA
- 1995-08-01 Sold (Public Records) — Public Records
Property tax history
+11.7%/yrLatest (2025): $5,376 · +10.4% YoY. Source: county tax records.
Cash-flow waterfall
monthlySold comps — $/sqft
last 12 mo · ≤1 miLoading sold comps…