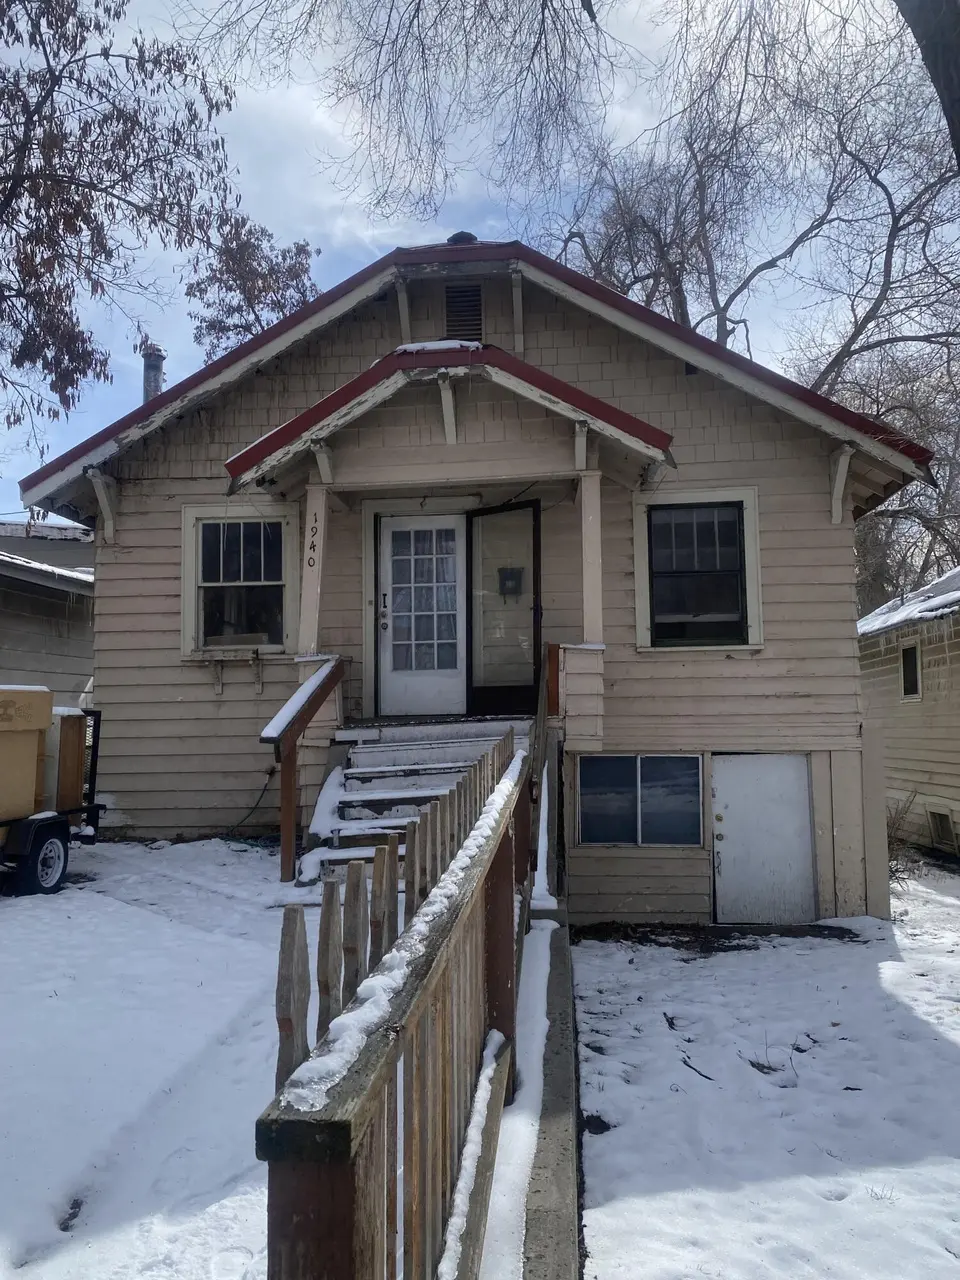
1940 Fremont St · Klamath Falls, OR
Flood risk 1/10 · Minimal
- FEMA flood zone
- X
- Chance of flooding over 30 yrs
- 0.0%
- Est. flood insurance / yr
- $507 – $1,088
Fire risk 6/10 · Moderate
- Est. fire insurance / yr
- $498 – $926
Heat risk 3/10 · Minor
- Hot days now (above 91°F)
- 7 days/yr
- Hot days in 30 yrs
- 17 days/yr
Wind risk 1/10 · Minimal
- Chance of severe wind over 30 yrs
- —
Air-quality risk 10/10 · Severe
- Unhealthy air days now
- 29 days/yr
- Unhealthy air days in 30 yrs
- 31 days/yr
Risk factors via First Street. Map © Google.
Why this score? — see what drove the C grade
The composite is a weighted blend of 9 inputs, each scored 0–100. Each bar is that input's sub-score; the figure is the points it added to the 100-point composite (weight × sub-score).
- Cash flow +24.1/30.0
- DSCR +7.8/10.0
- ARV discount +7.5/15.0
- 1% rule +5.8/10.0
- Livability +3.9/5.0
- Rent growth +3.3/5.0
- Schools +2.7/10.0
- Condition / age +2.5/5.0
- Appreciation +0.0/10.0
$100,000
🖨 Deal sheet 📄 Offer letter ✓ Due diligence
Listing remarks MLS
ATTENTION INVESTORS: OPPORTUNITY KNOCKS IN THE BEAUTIFUL PACIFIC TERRACE NEIGHBORHOOD! This property is directly across from Roosevelt elementary and has the advantages of SERIOUS INCOME POTENTIAL! Zoned SF which allows a Duplex. This lot is 0.10 and the lot next door @ 1938 Fremont is also for sale, you could have 2 contiguous lots and 2 duplexes! The duplex is a simulated photo in MLS
Key facts
- Income potential
- Build multi units
- Contiguous lots
Tags
Neighborhood map
What this means for you Summary
Snapshot
- This is a 2-bed/1.0-bath single-family listed at $100k.
Deal economics
- At list price, monthly cash flow is $198 ($2k/yr) — positive.
- The deal already cash-flows at list — no discount required.
- Meets the 1% rule at list price ($1k rent vs $100k).
- Recommended offer: $91k (9.0% below list) — sets the bar for market timing.
- Cap rate 8.7% vs local median 3.4% in Klamath Falls — top-decile yield for the area; either an underpriced asset or a hidden risk that comps aren't pricing in. Stress-test before assuming the spread holds.
Location & tenants
- Location reads 78/100 on livability (#67 in OR, #2,703 nationally) — a middle-class / working-renter tenant base. Strengths: commute A+, cost of living A+, housing A+; Watch: schools D-, crime F, employment F.
- Klamath Falls City Schools (town): math 26% / reading 40% proficiency, ranked #36 of 58 in OR (top 62%) — families likely to look elsewhere, expect single-tenant / working-renter base with shorter leases; 62% free/reduced lunch — lower-income household profile, screen leases tightly.
- Market conditions: Rents rising (+3.1%/yr); 493 active listings in the ZIP; 12 comparable units currently listed for rent nearby; rentals lingering (median 44d on market — plan ~5-8 weeks vacancy on turnover, expect pricing pressure); 100% of comp listings sitting > 30 days — soft ceiling on asking rent; 232 units permitted in Klamath County in 2024 (72 in 5+ unit buildings).
Forward outlook
- Local home prices are declining (-3.0%/yr); year-one equity from $691 of loan paydown is wiped out by about $3k of value loss. Plan a longer hold.
- Klamath County population projected at -12% by 2050 — secular population decline; favor cash flow + early exit over multi-decade hold.
Negotiation context
- It's been on market 101 days — a 9% lower offer ($91k) is reasonable based on typical stale-listing flexibility.
- Current owner paid $84k; 19% above their basis — modest negotiation headroom, anchor on the comps not their cost.
Risks & watch-outs
- Watch-outs: built in 1922 — expect roof / HVAC / electrical / plumbing capex.
- Climate carrying-cost: major wildfire risk — expect insurance premiums to compound above CPI over the hold.
Questions for the listing agent
- It's been on market 101 days. Have you received any prior offers? Is the seller open to a 9% concession, seller financing, or rate buy-down credit?
- Built in 1922 — when were the roof, HVAC, electrical panel, plumbing, and water heater last replaced?
- Why hasn't it sold? Are there any deal-killer items the seller is aware of (foundation, flood, title, zoning, code violations)?
- Is there a deadline driving the sale (1031 exchange, divorce, estate, relocation)? That informs how much negotiation room exists.
- Schools are D-rated, which usually means shorter tenancies and higher turnover. Who's the typical renter profile here, and what's been the actual vacancy rate?
- Crime grade is F in this area — have there been break-ins, vandalism, or insurance claims at this property in the last 3 years? What carrier currently insures it and at what premium?
- What's the average days-on-market for RENTAL listings here right now (not sales)? A rising rental-DOM trend means longer vacancies and softer asking-rent achievability than the comps imply.
- What's the recent tenant-quality profile in this submarket — average credit score on applications, eviction rate, late-payment / NSF rate, and stable-employment percentage? A property-management company in the area should have these aggregated.
- How much new for-sale + rental construction is in the pipeline within 1–3 miles? Heavy new supply typically softens prices + rents 12–24 months out; constrained supply supports both.
Investment metrics
- 1% rule
- 1.08% ✓
- Cap rate
- 8.66%
- Cash-on-cash
- 8.47%
- DSCR
- 1.38
- GRM
- 7.7
CMA / ARV
- ARV (median comp)
- $209,818
- List price
- $100,000
- Delta
- -52.34%
- Verdict
- UNDERPRICED
- Comps
- 20 within 1.0 mi
Show comp detail 10 sales within ~0.75 mi
| Address | Dist | Beds/Ba | Sqft | Sold | Price | $/sf | Match |
|---|---|---|---|---|---|---|---|
| 1829 Lancaster Ave | 0.40mi | 2/1.0 | 842 (-2%) | 6mo | $195,000 | $232 | 72 |
| 2015 Herbert St | 0.65mi | 2/1.0 | 868 (+0%) | 8mo | $128,000 | $147 | 62 |
| 1815 Earle St | 0.29mi | 2/1.5 | 939 (+9%) | 12mo | $247,000 | $263 | 60 |
| 1801 Last St | 0.62mi | 2/1.0 | 792 (-8%) | 9mo | $189,000 | $239 | 50 |
| 208 Mortimer St | 0.59mi | 2/1.0 | 776 (-10%) | 9mo | $180,000 | $232 | 48 |
| 1802 Johnson Ave | 0.33mi | 2/1.0 | 768 (-11%) | 21mo | $120,000 | $156 | 48 |
| 1825 Lancaster Ave | 0.40mi | 2/1.0 | 772 (-11%) | 22mo | $194,000 | $251 | 45 |
| 1600 Johnson Ave | 0.37mi | 2/1.0 | 744 (-14%) | 18mo | $210,000 | $282 | 45 |
| 420 N 10th St | 0.71mi | 2/1.0 | 748 (-13%) | 8mo | $192,000 | $257 | 38 |
| 129 Hillside Ave | 0.73mi | 2/1.0 | 744 (-14%) | 9mo | $185,000 | $249 | 36 |
Match score weights: distance 35% · size 25% · config 20% · recency 20%. Top-matched comps best support the ARV.
Projected returns pro-forma
-3.0% appreciation · 3.12% rent growth · sell at horizon
- IRR
- -3.3%
- Equity multiple
- 0.88×
- Total profit
- $-3,497
- Equity at exit
- $14,910
- IRR
- 6.5%
- Equity multiple
- 1.49×
- Total profit
- $13,676
- Equity at exit
- $8,646
Cash invested: $28,000 (down + closing). Projections, not guarantees.
Landlord ↔ Tenant lean methodology
- Overall (STATE)
- 28 Tenant-Leaning
- State Oregon
- 28 Tenant-Leaning · D+6
- County
- — inherits STATE
- City
- — inherits STATE
ZIP-level market 97601
- Home prices YoY
- -3.7%
- Rents YoY
- 3.1%
- Active inventory
- 493
- Price-to-rent
- 7.7×
Monthly cashflow live
- Estimated rent
- $1,082 high interval (Pro) →
- Mortgage (P&I)
- −$524
- Tax from tax record
- −$91 /mo · $1,098/yr
- Insurance
- −$42
- HOA
- −$0
- Vacancy / Maint / Mgmt
- −$227
- Net cashflow
- $198
Break-even live
UW: 25.0% down · 7.5% · 30yr · 1.5% tax · 5.0% vac · 8.0% maint · 8.0% mgmt
Financing live
Cash to close
- Down payment
- $25,000
- Closing costs
- $3,000
- Reserves months
- —
- Total cash needed
- —
Loan-product check · same deal, 3 products live
Conventional
25% down · 7.5% · 30yr
- Down + closing
- —
- Monthly P&I
- —
- Monthly cashflow
- —
- DSCR
- —
- Eligible?
- —
Personal DTI + credit; lowest rate.
DSCR
20% down · 8.5% · 30yr
- Down + closing
- —
- Monthly P&I
- —
- Monthly cashflow
- —
- DSCR
- —
- Eligible?
- —
No personal income docs; deal must DSCR.
Hard money
10% down · 12.0% · 12mo
- Down + closing
- —
- Monthly P&I
- —
- Monthly cashflow
- —
- DSCR
- —
- Eligible?
- —
Short-term bridge; refi at stabilization.
Rent comps 12 comps
| Address | Beds | Baths | Sqft | Rent | $/sqft | DOM | Units | Dist |
|---|---|---|---|---|---|---|---|---|
| 729-731 N 11th St Klamath Falls, OR | 2.0 | 1.0 | 945 | $1,250 | $1.32 | 43d | 1 | 0.65mi |
| 123 Mortimer St Klamath Falls, OR | 1.0 | 1.0 | 750 | $899 | $1.20 | 43d | 1 | 0.66mi |
| 233 Old Fort Rd Klamath Falls, OR | 2.0 | 1.0 | 1050 | $1,250 | $1.19 | 43d | 1 | 0.74mi |
| 632 Lytton St Unit 630 Klamath Falls, OR | 2.0 | 1.0 | 792 | $950 | $1.20 | 43d | 1 | 0.76mi |
| 230 S 11th St Klamath Falls, OR | 2.0 | 1.0 | 498 | $1,100 | $2.21 | 43d | 1 | 0.82mi |
| 240 E Main St Unit 1 Klamath Falls, OR | 1.0 | 1.5 | 750 | $975 | $1.30 | 43d | 1 | 0.88mi |
| 708 Jefferson St Klamath Falls, OR | 2.0 | 1.0 | 800 | $1,050 | $1.31 | 43d | 1 | 0.89mi |
| 151 N Williams Ave Klamath Falls, OR | 1.0–2.0 | 1.0–2.0 | 485 | $1,950 | $4.02 | 43d | 1 | 0.92mi |
| 104 S Williams Ave Unit A Klamath Falls, OR | 3.0 | 2.0 | 800 | $1,295 | $1.62 | 43d | 1 | 0.93mi |
| 223 N 6th St Klamath Falls, OR | 1.0 | 1.0 | 650 | $935 | $1.44 | 43d | 2 | 0.97mi |
| 234 N 3rd St Unit 1 Klamath Falls, OR | 2.0 | 1.0 | 791 | $1,200 | $1.52 | 43d | 1 | 1.16mi |
| 2041 Vine Ave Unit 1 Klamath Falls, OR | 1.0 | 1.0 | 950 | $725 | $0.76 | 43d | 1 | 1.18mi |
Listing history 21 events
-
2026-06-19days on market $100,000 Active 101 DOM
-
2026-06-18days on market $100,000 Active 100 DOM
-
2026-06-17days on market $100,000 Active 99 DOM
-
2026-06-16days on market $100,000 Active 98 DOM
-
2026-06-15days on market $100,000 Active 97 DOM
-
2026-06-14days on market $100,000 Active 95 DOM
-
2026-06-12days on market $100,000 Active 94 DOM
-
2026-06-09days on market $100,000 Active 91 DOM
-
2026-06-08days on market $100,000 Active 90 DOM
-
2026-06-07days on market $100,000 Active 89 DOM
-
2026-06-05days on market $100,000 Active 86 DOM
-
2026-06-03days on market $100,000 Active 85 DOM
-
2026-06-03remarks 431-char remark
-
2026-06-02days on market $100,000 Active 84 DOM
-
2026-06-01days on market $100,000 Active 83 DOM
-
2026-05-31days on market $100,000 Active 82 DOM
-
2026-05-30days on market $100,000 Active 81 DOM
-
2026-03-10$125,000 Active 390-char remark
Show marketing remark (390 chars)
ATTENTION INVESTORS: OPPORTUNITY KNOCKS IN THE BEAUTIFUL PACIFIC TERRACE NEIGHBORHOOD! This property is directly across from Roosevelt elementary and has the advantages of SERIOUS INCOME POTENTIAL! Zoned SF which allows a Duplex. This lot is 0.10 and the lot next door @ 1938 Fremont is also for sale, you could have 2 contiguous lots and 2 duplexes! The duplex is a simulated photo in MLS
-
2005-08-25soldstatus $84,000
-
1990-05-01soldstatus $28,000
-
1972-08-01soldstatus $7,500
ⓘ Source: listings_history table (triggers on properties + properties_extension) + one-shot
backfill from property_details.listing_events for pre-trigger history.
Tax reassessment forecast OR · Resets to sale price
- Current annual tax
- $1,098 · $91/mo
- Projected year-2 tax
- $1,098 · $91/mo
- Expected delta
- $0/yr ($0/mo · 0.0%)
ⓘ Screening estimate from a state-policy table — verify with the county assessor before closing.
Climate risk First Street
- Flood 1/10 Low FEMA zone X · 0% chance over 30 yrs
- Wildfire 6/10 Major
- Heat 3/10 Moderate 7 d/yr ≥91°F today · 17 d/yr by 30 yrs out
- Wind 1/10 Low
- Air quality 10/10 Extreme 29 unhealthy d/yr today · 31 by 30 yrs out
Nearby sold comps map
Loading sold comps map…
Walkable amenities ~0.75 mi
Loading nearby amenities…
Taxation est. · year 1
- Rental income
- $12,989
- − Mortgage interest
- −$5,602
- − Property taxes
- −$1,098
- − Insurance
- −$500
- − Repairs & maintenance
- −$1,039
- − Management
- −$1,039
- − Depreciation
- −$2,909
- Taxable income
- $802
- Est. tax owed @ 24.0%
- −$193
- After-tax cash flow
- $2,178/yr
For passive investors: Depreciation is non-cash, so a rental often shows a tax loss while cash-flowing — sheltering income. Rental losses are passive: they offset passive income freely, and up to $25,000/yr can offset ordinary (W-2) income if you actively participate and your MAGI is under $100k (phasing out to $0 by $150k); unused losses carry forward. On sale, claimed depreciation is recaptured at up to 25%, and gains may owe capital-gains tax (a 1031 exchange can defer both). Figures are a year-1 estimate at your 24.0% rate — not tax advice; consult a CPA.
Schools (NCES district)
- District
- Klamath Falls City Schools
- NCES district ID
- 4107080
- Math proficiency
- 26% ▼ -6.00%
- Reading proficiency
- 40% ▼ -3.00%
- Median HH income
- $34,329
- Composite
- 27.14/100
- National rank
- #7033
- State rank
- #36 of 58 in OR
Livability — Klamath Falls
- Score
- 78/100
- State rank
- #67
- US rank
- #2703
Category grades
Schools grade is shown separately in the Schools card above.
Census & demographics
- Census place
- Klamath Falls, OR
- County
- Klamath County · 56,186 people
- City population
- 56,186
- Metro
- Klamath Falls, OR
- Population (ZIP)
- 22,964
- Household income
- $51,780
- Rent vs Own
- Severe rent burden
- 1323.0
Population outlook (Klamath County) Hauer SSP2
- Today (2025)
- 63,870 people
- By 2030
- 62,279 · -2.5%
- By 2040
- 58,891 · -7.8%
- By 2050
- 56,207 · -12.0%
- By 2075
- 51,239 · -19.8%
- By 2100
- 46,526 · -27.2%
Race, ethnicity, and origin ACS 2023
- Neighborhood character
- Predominantly White (76%)
- Race & ethnicity
- White 76% Hispanic / Latino 12% Two or more races 10% Native American 3% Asian 2%
- Hispanic origin (detail)
- Mexican 9%
- Common ancestry
- Lithuanian 4% Slovak 3% Portuguese 2%
- Foreign-born
- 4% · Canada
- Languages at home
- 92% English-only · Spanish 6%
Political lean MEDSL · Klamath
- 2024 margin
- Solid R (+41.9) · D 27.9% · R 69.8% · Other 2.4%
- 2008→2024 swing
- -8.8pp toward R · 2008: -33.1pp · 2024: -41.9pp
- All cycles
- 2024: R+41.9 2020: R+40.6 2016: R+44.8 2012: R+38.2 2008: R+33.1
Not yet ingested
- Civics
- —
Market trends
- HPI YoY
- ▼ -14.37%
- Current HPI
- 372.5418
- Rent YoY
- ▲ 3.12%
- Metro
- Klamath Falls, OR
- State GDP YoY
- ▲ 2.05%
- F500 in state
- 2
Industry mix (Fortune 500 HQ in OR)
| Industry | F500 HQs | Revenue |
|---|---|---|
| Consumer Goods | 1 | $51B |
|
||
Price history
+1566.7% since first listed4 events — show timeline
- 2026-03-10 Listed $125,000 MLSCO
- 2005-08-25 Sold (Public Records) $84,000 Public Records
- 1990-05-01 Sold (Public Records) $28,000 Public Records
- 1972-08-01 Sold (Public Records) $7,500 Public Records
Property tax history
+4.2%/yrLatest (2025): $1,098 · +2.4% YoY. Source: county tax records.
Cash-flow waterfall
monthlySold comps — $/sqft
last 12 mo · ≤1 miLoading sold comps…