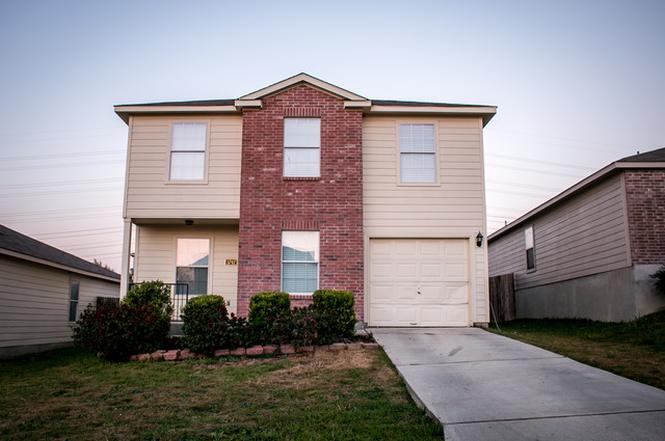
5742 Butch Cyn · San Antonio, TX
Flood risk 1/10 · Minimal
- FEMA flood zone
- X (unshaded)
- Chance of flooding over 30 yrs
- 0.0%
- Est. flood insurance / yr
- $507 – $1,088
Fire risk 5/10 · Moderate
- Est. fire insurance / yr
- $1,222 – $2,270
Heat risk 8/10 · Major
- Hot days now (above 110°F)
- 7 days/yr
- Hot days in 30 yrs
- 23 days/yr
Wind risk 7/10 · Major
- Chance of severe wind over 30 yrs
- 78.0%
Air-quality risk 2/10 · Minimal
- Unhealthy air days now
- 1 days/yr
- Unhealthy air days in 30 yrs
- 1 days/yr
Risk factors via First Street. Map © Google.
Why this score? — see what drove the D grade
The composite is a weighted blend of 9 inputs, each scored 0–100. Each bar is that input's sub-score; the figure is the points it added to the 100-point composite (weight × sub-score).
- ARV discount +10.4/15.0
- Cash flow +8.4/30.0
- Appreciation +5.0/10.0
- Livability +4.0/5.0
- 1% rule +3.5/10.0
- Condition / age +2.5/5.0
- DSCR +2.3/10.0
- Schools +2.2/10.0
- Rent growth +2.1/5.0
$200,000
🖨 Deal sheet (PDF) 📄 Offer letter ✓ Due diligence
Listing remarks
A charming home near the neighborhood park and close to Potranca Creek, this home is nestled in a quiet neighborhood with schools and access to Hwy90/Loop1604 in proximity(3 minutes to access road). Neighborhood park features a gazebo, public restrooms, basketball court, walking trails, playground, and dog park. Less than 15 minute drive to Lackland AFB! This home boasts many upgrades and features. Garage is EV level 2 ready, kitchen has new beautiful quartz counter tops, new stove, dishwasher, and microwave over cooktop. LG Fridge included is 18 months old! Water heater is less than two years old. AC is about 2 years old and is energy efficient, yielding low energy bills during those hot s
Key facts
- Dog park
- Gazebo
- Basketball court
Tags
Property features AI
Finance
- HOA & community: Mandatory HOA; HOA fee $200 semi-annually; Association transfer fee $150; Community amenities include park/playground, jogging trails, bike trails, BBQ/grill and basketball court
Exterior
- Parking: Attached 1-car garage
- Security: Pre-wired for security; Smoke alarm
- Utilities: City water and sewer
- Home design: Pre-owned single-family home; Approximately 19 years old; Slab foundation; Brick and wood exterior; Composition roof
- Construction: Brick and wood construction; Composition roof; Slab foundation; Built approximately 19 years ago
- Exterior features: Covered patio (main level); Deck (main level); Patio slab; Privacy fence; Special yard lighting; Mature trees
Interior
- Kitchen: Microwave; Stove/Range; Refrigerator; Dishwasher; Disposal
- Bedrooms: Master bedroom on upper level with walk-in closet, ceiling fan and full bath (16 x 14); Bedroom 2 (12 x 14); Bedroom 3 (13 x 11)
- Flooring: Ceramic tile; Wood flooring; Vinyl flooring
- Bathrooms: Two full bathrooms and one half bathroom; Master bath with tub/shower combination (12 x 10)
- Heating & cooling: Central heating (electric); Central air conditioning
- Interior features: Ceiling fans throughout; Chandelier; Washer and dryer included; Microwave, stove/range, refrigerator, disposal, and dishwasher included; Owned water softener; Smoke alarm; Pre-wired for security; Electric water heater; One living area; All bedrooms on upper level; All window coverings remain
- Laundry & utility: Laundry located on upper level; Washer and dryer included; Electric water heater; Owned water softener
Neighborhood map
What this means for you Summary
Snapshot
- This is a 3-bed/2.5-bath single-family listed at $200k.
Deal economics
- At list price, monthly cash flow is $-179 ($-2k/yr) — negative.
- To cash-flow at today's rent, offer at most $168k (15.8% below list).
- To meet the 1% rule (rent ≥ 1% of price), the offer needs to be $171k (14.7% below list).
- Recommended offer: $168k (15.8% below list) — sets the bar for cash-flow.
- Cap rate 5.2% vs local median 3.8% in San Antonio — top-decile yield for the area; either an underpriced asset or a hidden risk that comps aren't pricing in. Stress-test before assuming the spread holds.
Location & tenants
- Location reads 80/100 on livability (#31 in TX, #1,616 nationally) — a professional / high-income tenant draw. Strengths: amenities A+, commute A+, cost of living A+; Watch: crime F.
- Southwest ISD (rural): math 21% / reading 31% proficiency, ranked #701 of 826 in TX (top 85%) — low school quality limits family demand, transient renter base, plan for 1-2y turnover; 75% free/reduced lunch — lower-income household profile, screen leases tightly.
- Zoned schools: Southwest El (math 38% / reading 33%, grade F, #1,946 of 4,322 statewide, top 45%, 654 students, 73% FRL); Ronald E Mcnair Middle (math 27% / reading 31%, grade F, #1,103 of 1,662 statewide, top 67%, 748 students, 77% FRL); Southwest H S (math 17% / reading 39%, grade F, #1,170 of 1,632 statewide, top 72%, 2,152 students, 72% FRL) — zoned schools at 74% FRL track the district average.
- Market conditions: Rents soft (-1.7%/yr); 555 active listings in the ZIP; 40 comparable units currently listed for rent nearby; rentals at typical pace (median 26d on market — plan ~3-4 weeks tenant-placement turnaround); solid renter incomes; 8,308 units permitted in Bexar County in 2024 (2,506 in 5+ unit buildings).
Forward outlook
- In year one you build about $1k of equity ($1k loan paydown + $-4 appreciation (-0.0% local appreciation)).
- Bexar County population projected at +50% by 2050 — long-run rental-demand tailwind backs the buy-and-hold thesis.
Negotiation context
- It's been on market 18 days — a 2% lower offer ($197k) is reasonable based on typical stale-listing flexibility.
- 13 sale attempts since 18y ago with the ask held roughly flat each time — persistent listings suggest the price (not the market) is what's stuck; bring a comps-based counter.
Risks & watch-outs
- Climate carrying-cost: major wind risk, 78% chance of damaging wind over 30y; moderate wildfire risk; extreme-heat days projected 7→23/yr by 2055 (HVAC capex compounding) — expect insurance premiums to compound above CPI over the hold.
Questions for the listing agent
- What do current leases actually rent for vs. the listed asking? Can we see a recent rent roll and the last 12 months of T-12 income?
- What does the HOA fee cover, when was the last increase, and are there any pending special assessments or reserve-fund shortfalls?
- Is there a deadline driving the sale (1031 exchange, divorce, estate, relocation)? That informs how much negotiation room exists.
- Crime grade is F in this area — have there been break-ins, vandalism, or insurance claims at this property in the last 3 years? What carrier currently insures it and at what premium?
- The area grade is low — what's the realistic commute time and amenity access for the typical tenant pool here? Any planned neighborhood developments (good or bad) we should know about?
- What's the average days-on-market for RENTAL listings here right now (not sales)? A rising rental-DOM trend means longer vacancies and softer asking-rent achievability than the comps imply.
- What's the recent tenant-quality profile in this submarket — average credit score on applications, eviction rate, late-payment / NSF rate, and stable-employment percentage? A property-management company in the area should have these aggregated.
- How much new for-sale + rental construction is in the pipeline within 1–3 miles? Heavy new supply typically softens prices + rents 12–24 months out; constrained supply supports both.
Investment metrics
- 1% rule
- 0.85% ✗
- Cap rate
- 5.22%
- Cash-on-cash
- -3.84%
- DSCR
- 0.83
- GRM
- 9.8
CMA / ARV
- ARV (median comp)
- $214,025
- List price
- $200,000
- Delta
- 2.79%
- Verdict
- FAIR
- Comps
- 20 within 1.0 mi
Show comp detail 12 sales within ~0.75 mi
| Address | Dist | Beds/Ba | Sqft | Sold | Price | $/sf | Match |
|---|---|---|---|---|---|---|---|
| 5526 Bat | 0.23mi | 3/2.5 | 1,553 (0%) | 4mo | $199,000 | $128 | 86 |
| 11266 Magic Cyn | 0.34mi | 3/2.5 | 1,606 (+3%) | 4mo | $219,000 | $136 | 75 |
| 10740 Criterion | 0.46mi | 3/2.0 | 1,535 (-1%) | 1mo | $276,950 | $180 | 73 |
| 10750 Dazzle | 0.50mi | 3/2.0 | 1,535 (-1%) | 1mo | $276,950 | $180 | 72 |
| 5735 Sandy Cyn | 0.09mi | 3/2.5 | 1,749 (+13%) | 5mo | $215,000 | $123 | 71 |
| 10721 Dazzle | 0.48mi | 3/2.0 | 1,535 (-1%) | 3mo | $316,500 | $206 | 71 |
| 5870 Cosmic Crisp | 0.37mi | 4/2.0 (+1) | 1,572 (+1%) | 3mo | $276,950 | $176 | 71 |
| 5634 Forest Cyn | 0.54mi | 3/2.5 | 1,553 (0%) | 5mo | $214,999 | $138 | 71 |
| 5926 Cosmic Crisp | 0.37mi | 3/2.5 | 1,470 (-5%) | 4mo | $275,950 | $188 | 70 |
| 10744 Criterion | 0.46mi | 3/2.0 | 1,489 (-4%) | 2mo | $289,950 | $195 | 68 |
| 5934 Cosmic Crisp | 0.37mi | 3/2.0 | 1,434 (-8%) | 3mo | $272,950 | $190 | 66 |
| 11014 Rosin Jaw Trl | 0.73mi | 3/2.0 | 1,528 (-2%) | 3mo | $229,000 | $150 | 59 |
Match score weights: distance 35% · size 25% · config 20% · recency 20%. Top-matched comps best support the ARV.
Projected returns pro-forma
-0.0% appreciation · 0.0% rent growth · sell at horizon
- IRR
- -8.6%
- Equity multiple
- 0.60×
- Total profit
- $-22,163
- Equity at exit
- $58,056
- IRR
- -4.8%
- Equity multiple
- 0.52×
- Total profit
- $-26,625
- Equity at exit
- $69,772
Cash invested: $56,000 (down + closing). Projections, not guarantees.
Landlord ↔ Tenant lean methodology
- Overall (STATE)
- 87 Strongly Landlord-Friendly
- State Texas
- 87 Strongly Landlord-Friendly · R+5
- County
- — inherits STATE
- City
- — inherits STATE
ZIP-level market 78252
- Home prices YoY
- -0.0%
- Rents YoY
- -1.7%
- Active inventory
- 555
- Price-to-rent
- 9.8×
Monthly cashflow live
- Estimated rent
- $1,705 high interval (Pro) →
- Mortgage (P&I)
- −$1,049
- Tax from tax record
- −$361 /mo · $4,335/yr
- Insurance
- −$83
- HOA
- −$33
- Vacancy / Maint / Mgmt
- −$358
- Net cashflow
- $-179
Break-even live
Sensitivity live
| Price | -10% $-66 | -5% $-123 | +0% $-179 | +5% $-236 | +10% $-292 |
|---|---|---|---|---|---|
| Rent | -10% $-314 | -5% $-247 | +0% $-179 | +5% $-112 | +10% $-44 |
| Rate | -1.0pp $-78 | -0.5pp $-128 | base $-179 | +0.5pp $-231 | +1.0pp $-284 |
UW: 25.0% down · 7.5% · 30yr · 1.5% tax · 5.0% vac · 8.0% maint · 8.0% mgmt
Financing live
Cash to close
- Down payment
- $50,000
- Closing costs
- $6,000
- Reserves months
- —
- Total cash needed
- —
Loan-product check · same deal, 3 products live
Conventional
25% down · 7.5% · 30yr
- Down + closing
- —
- Monthly P&I
- —
- Monthly cashflow
- —
- DSCR
- —
- Eligible?
- —
Personal DTI + credit; lowest rate.
DSCR
20% down · 8.5% · 30yr
- Down + closing
- —
- Monthly P&I
- —
- Monthly cashflow
- —
- DSCR
- —
- Eligible?
- —
No personal income docs; deal must DSCR.
Hard money
10% down · 12.0% · 12mo
- Down + closing
- —
- Monthly P&I
- —
- Monthly cashflow
- —
- DSCR
- —
- Eligible?
- —
Short-term bridge; refi at stabilization.
Rent comps 40 comps
| Address | Beds | Baths | Sqft | Rent | $/sqft | DOM | Units | Dist |
|---|---|---|---|---|---|---|---|---|
| 5727 Sandy Cyn San Antonio, TX | 3.0 | 2.5 | 1706 | $1,490 | $0.87 | 12d | 1 | 0.09mi |
| 5703 Fossil Cyn San Antonio, TX | 3.0 | 2.0 | 1233 | $1,420 | $1.15 | 45d | 1 | 0.15mi |
| 5822 Blonde Cyn San Antonio, TX | 3.0 | 2.0 | 1233 | $1,390 | $1.13 | 45d | 1 | 0.16mi |
| 5922 Hickory Cyn San Antonio, TX | 3.0 | 2.0 | 1233 | $1,350 | $1.09 | 25d | 1 | 0.19mi |
| 5535 Hidden Cyn San Antonio, TX | 3.0 | 2.0 | 1233 | $1,700 | $1.38 | 25d | 1 | 0.20mi |
| 10930 Moonlit Cyn San Antonio, TX | 3.0 | 2.0 | 1233 | $1,345 | $1.09 | 45d | 1 | 0.22mi |
| 11214 Indian Cyn San Antonio, TX | 3.0 | 2.0 | 1233 | $1,350 | $1.09 | 25d | 1 | 0.23mi |
| 11407 Indian Cyn San Antonio, TX | 3.0 | 2.0 | 1097 | $1,535 | $1.40 | 6d | 1 | 0.28mi |
| 5722 Wildcat Cyn San Antonio, TX | 3.0 | 2.5 | 1569 | $1,526 | $0.97 | 14d | 1 | 0.33mi |
| 5702 Wildcat Cyn San Antonio, TX | 3.0 | 2.5 | 1553 | $1,599 | $1.03 | 6d | 1 | 0.36mi |
| 11230 Begonia Rock San Antonio, TX | 4.0 | 2.0 | 2090 | $1,925 | $0.92 | 45d | 1 | 0.42mi |
| 11459 Coral Cyn San Antonio, TX | 3.0 | 2.0 | 1097 | $1,500 | $1.37 | 25d | 1 | 0.42mi |
| 10903 Honey Crisp San Antonio, TX | 3.0–4.0 | 2.0–2.5 | 1719 | $1,699 | $0.99 | 0d | 47 | 0.42mi |
| 11487 Coral Cyn San Antonio, TX | 3.0 | 2.5 | 1553 | $1,695 | $1.09 | 25d | 1 | 0.47mi |
| 6175 Texas Cyn San Antonio, TX | 1.0–4.0 | 1.0–2.0 | 1056 | $1,357 | $1.28 | 25d | 1 | 0.50mi |
| 5607 Forest Cyn San Antonio, TX | 3.0 | 2.0 | 1097 | $1,480 | $1.35 | 45d | 1 | 0.53mi |
| 10615 Tattersall Blvd San Antonio, TX | 4.0 | 2.5 | 2223 | $1,950 | $0.88 | 25d | 1 | 0.65mi |
| 10520 Pomme San Antonio, TX | 3.0 | 2.5 | 1858 | $1,795 | $0.97 | 18d | 1 | 0.85mi |
| 10518 Egremont San Antonio, TX | 3.0 | 2.0 | 1534 | $2,200 | $1.43 | 0d | 1 | 0.88mi |
| 11620 Midnight Rain San Antonio, TX | 3.0 | 2.5 | 1780 | $1,850 | $1.04 | 45d | 1 | 0.88mi |
| 11620 Midnight Rain San Antonio, TX | 3.0 | 2.5 | 1780 | $1,735 | $0.97 | 0d | 1 | 0.88mi |
| 10909 Charreada Trl San Antonio, TX | 3.0 | 2.0 | 1739 | $1,800 | $1.04 | 25d | 1 | 0.90mi |
| 11735 Midnight Rain San Antonio, TX | 4.0 | 2.0 | 1417 | $1,595 | $1.13 | 22d | 1 | 1.03mi |
| 11732 Red Pheasant San Antonio, TX | 3.0 | 2.5 | 1780 | $1,795 | $1.01 | 25d | 1 | 1.04mi |
| 11556 Mustang Grv San Antonio, TX | 3.0 | 2.0 | 1929 | $2,150 | $1.11 | 22d | 1 | 1.06mi |
| 6710 Greensleeves San Antonio, TX | 3.0 | 2.0 | 1534 | $1,700 | $1.11 | 45d | 1 | 1.06mi |
| 11543 Luckey Ledge San Antonio, TX | 4.0 | 2.0 | 1793 | $1,615 | $0.90 | 45d | 1 | 1.07mi |
| 11727 Black Rose San Antonio, TX | 3.0 | 2.0 | 1316 | $1,595 | $1.21 | 0d | 1 | 1.07mi |
| 11752 Red Pheasant San Antonio, TX | 3.0 | 2.0 | 1246 | $1,595 | $1.28 | 25d | 1 | 1.08mi |
| 11806 Red Pheasant San Antonio, TX | 3.0 | 2.0 | 1252 | $1,550 | $1.24 | 6d | 1 | 1.12mi |
| 3839 Browning Blf San Antonio, TX | 3.0 | 2.0 | 1566 | $1,899 | $1.21 | 45d | 1 | 1.13mi |
| 4546 Longhorn Crst San Antonio, TX | 4.0 | 2.0 | 1720 | $2,200 | $1.28 | 0d | 1 | 1.13mi |
| 11427 Long Trl San Antonio, TX | 3.0 | 2.5 | 1444 | $2,400 | $1.66 | 0d | 1 | 1.14mi |
| 11806 Black Rose San Antonio, TX | 4.0 | 2.5 | 2100 | $2,150 | $1.02 | 45d | 1 | 1.14mi |
| 10858 Quinn Ct San Antonio, TX | 2.0–5.0 | 2.0–3.5 | 1733 | $2,067 | $1.19 | 0d | 1 | 1.15mi |
| 10829 Emerick St San Antonio, TX | 3.0 | 2.5 | 1344 | $1,700 | $1.26 | 25d | 1 | 1.17mi |
| 10834 Quinn Ct San Antonio, TX | 3.0 | 2.5 | 1344 | $1,800 | $1.34 | 45d | 1 | 1.18mi |
| 11811 Wolf Cyn San Antonio, TX | 4.0 | 2.0 | 1893 | $1,725 | $0.91 | 45d | 1 | 1.18mi |
| 11803 Luckey Vis San Antonio, TX | 3.0 | 2.5 | 1778 | $1,711 | $0.96 | 0d | 1 | 1.20mi |
| 7001 Lions Park San Antonio, TX | 3.0 | 2.0 | 1680 | $1,795 | $1.07 | 0d | 1 | 1.22mi |
HOA detail
- Monthly dues
- $33 · $396/yr
- Likely covers
- water
Listing history 43 events
-
2026-06-21days on market $200,000 Active 18 DOM
-
2026-06-18days on market $200,000 Active 15 DOM
-
2026-06-17days on market $200,000 Active 14 DOM
-
2026-06-16days on market $200,000 Active 13 DOM
-
2026-06-15statusdays on market $200,000 Active 12 DOM
-
2026-06-13days on market $200,000 New 10 DOM
-
2026-06-09days on market $200,000 New 6 DOM
-
2026-06-08days on market $200,000 New 5 DOM
-
2026-06-07days on market $200,000 New 4 DOM
-
2026-06-04remarks 699-char remark
-
2026-06-04pricestatusdays on market $200,000 New 1 DOM
-
2026-05-02historical
-
2026-05-02historical
-
2026-04-30$220,000 New
-
2026-04-29historical
-
2026-04-03$220,000 Active
-
2026-03-18historical
-
2026-02-09$220,000 Active
-
2026-02-07status Back on Market
-
2026-02-06historical
-
2026-02-02historical Active Option
-
2026-01-22$220,000 New
-
2026-01-21historical
-
2025-11-03$220,000 Active
-
2025-10-07$220,000 New
-
2025-09-02historical
-
2025-08-19price $219,999
-
2025-07-26price $229,999
-
2025-06-17$238,999 New
-
2018-05-02soldstatus
-
2016-05-03soldstatus Sold
-
2016-05-03soldstatus
-
2016-04-18status Pending
-
2016-04-08historical Active Option
-
2016-03-31price $132,500
-
2016-03-30status Back on Market
-
2016-03-07historical Active Option
-
2016-02-27$135,000 New
-
2009-09-25soldstatus
-
2009-08-07historical
-
2009-06-26$92,000
-
2009-06-26historical
-
2008-07-14$120,000
ⓘ Source: listings_history table (triggers on properties + properties_extension) + one-shot
backfill from property_details.listing_events for pre-trigger history.
Tax reassessment forecast TX · Resets to sale price
- Current annual tax
- $4,335 · $361/mo
- Projected year-2 tax
- $4,335 · $361/mo
- Expected delta
- $0/yr ($0/mo · 0.0%)
ⓘ Screening estimate from a state-policy table — verify with the county assessor before closing.
Climate risk First Street
- Flood 1/10 Low FEMA zone X (unshaded) · 0% chance over 30 yrs
- Wildfire 5/10 Major
- Heat 8/10 Severe 7 d/yr ≥110°F today · 23 d/yr by 30 yrs out
- Wind 7/10 Severe 78% chance of damaging wind over 30 yrs
- Air quality 2/10 Low 1 unhealthy d/yr today · 1 by 30 yrs out
Nearby sold comps map
Loading sold comps map…
Walkable amenities ~0.75 mi
Loading nearby amenities…
Taxation est. · year 1
- Rental income
- $20,463
- − Mortgage interest
- −$11,203
- − Property taxes
- −$4,335
- − Insurance
- −$1,000
- − Repairs & maintenance
- −$1,637
- − Management
- −$1,637
- − HOA
- −$396
- − Depreciation
- −$5,818
- Taxable loss
- −$5,563
- Est. tax savings @ 24.0%
- +$1,335
- After-tax cash flow
- $-815/yr
For passive investors: Depreciation is non-cash, so a rental often shows a tax loss while cash-flowing — sheltering income. Rental losses are passive: they offset passive income freely, and up to $25,000/yr can offset ordinary (W-2) income if you actively participate and your MAGI is under $100k (phasing out to $0 by $150k); unused losses carry forward. On sale, claimed depreciation is recaptured at up to 25%, and gains may owe capital-gains tax (a 1031 exchange can defer both). Figures are a year-1 estimate at your 24.0% rate — not tax advice; consult a CPA.
Schools (NCES district)
- District
- Southwest ISD
- NCES district ID
- 4840950
- Math proficiency
- 21% ▼ -21.00%
- Reading proficiency
- 31% ▼ -5.00%
- Median HH income
- $43,362
- Composite
- 22.22/100
- National rank
- #8153
- State rank
- #701 of 826 in TX
Livability — San Antonio
- Score
- 80/100
- State rank
- #31
- US rank
- #1616
Category grades
Schools grade is shown separately in the Schools card above.
Census & demographics
- County
- Bexar County · 1,990,555 people
- City population
- 1,806,925
- Metro
- San Antonio-New Braunfels, TX
- Population (ZIP)
- 21,790
- Household income
- $85,518
- Rent vs Own
- Severe rent burden
- 152.0
Population outlook (Bexar County) Hauer SSP2
- Today (2025)
- 2,336,851 people
- By 2030
- 2,560,728 · +9.6%
- By 2040
- 3,020,569 · +29.3%
- By 2050
- 3,493,522 · +49.5%
- By 2075
- 4,668,459 · +99.8%
- By 2100
- 5,533,242 · +136.8%
Race, ethnicity, and origin ACS 2023
- Neighborhood character
- Predominantly Hispanic (68%)
- Race & ethnicity
- Hispanic / Latino 68% Two or more races 29% White 17% Black 8% Asian 3% Native American 1%
- Hispanic origin (detail)
- Mexican 61% Puerto Rican 1%
- Common ancestry
- Hispanic 2% Lithuanian 1% German 1%
- Foreign-born
- 12% · Canada, South Korea
- Languages at home
- 58% English-only · Spanish 38% Tagalog/Filipino 2% Other Indo-European 1%
Political lean MEDSL · Bexar
- 2024 margin
- Lean D (+9.8) · D 54.3% · R 44.6% · Other 1.1%
- 2008→2024 swing
- +4.2pp toward D · 2008: 5.6pp · 2024: 9.8pp
- All cycles
- 2024: D+9.8 2020: D+18.2 2016: D+13.5 2012: D+4.6 2008: D+5.6
Not yet ingested
- Civics
- —
Market trends
- HPI YoY
- ▬ -0.00%
- Current HPI
- 183.6413
- Rent YoY
- ▼ -1.67%
- Metro
- San Antonio-New Braunfels, TX
- State GDP YoY
- ▲ 3.95%
- F500 in state
- 110
Industry mix (Fortune 500 HQ in TX)
| Industry | F500 HQs | Revenue |
|---|---|---|
| Energy | 16 | $1,198B |
|
||
| Technology | 5 | $198B |
|
||
| Engineering / Construction | 4 | $72B |
|
||
| Energy Services | 3 | $60B |
|
||
| Utilities | 3 | $41B |
|
||
| Healthcare | 2 | $330B |
|
||
Price history
+66.7% since first listed33 events — show timeline
- 2026-06-03 Listed $200,000 LERA
- 2026-05-02 Listing Removed — LERA
- 2026-05-02 Listing Removed — CTXMLS
- 2026-04-30 Listed $220,000 LERA
- 2026-04-29 Listing Removed — LERA
- 2026-04-03 Listed $220,000 CTXMLS
- 2026-03-18 Listing Removed — CTXMLS
- 2026-02-09 Listed $220,000 CTXMLS
- 2026-02-07 Relisted — LERA
- 2026-02-06 Listing Removed — CTXMLS
- 2026-02-02 Contingent — LERA
- 2026-01-22 Listed $220,000 LERA
- 2026-01-21 Listing Removed — LERA
- 2025-11-03 Listed $220,000 CTXMLS
- 2025-10-07 Listed $220,000 LERA
- 2025-09-02 Listing Removed — LERA
- 2025-08-19 Price Changed $219,999 LERA
- 2025-07-26 Price Changed $229,999 LERA
- 2025-06-17 Listed $238,999 LERA
- 2018-05-02 Sold (Public Records) — Public Records
- 2016-05-03 Sold (MLS) — LERA
- 2016-05-03 Sold (Public Records) — Public Records
- 2016-04-18 Pending — LERA
- 2016-04-08 Contingent — LERA
- 2016-03-31 Price Changed $132,500 LERA
- 2016-03-30 Relisted — LERA
- 2016-03-07 Contingent — LERA
- 2016-02-27 Listed $135,000 LERA
- 2009-09-25 Sold (MLS) — LERA
- 2009-08-07 Listing Removed — LERA
- 2009-06-26 Listing Removed — LERA
- 2009-06-26 Listed $92,000 LERA
- 2008-07-14 Listed $120,000 LERA
Property tax history
+6.2%/yrLatest (2025): $4,335 · -4.9% YoY. Source: county tax records.
Cash-flow waterfall
monthlySold comps — $/sqft
last 12 mo · ≤1 miLoading sold comps…